Documentation Revision Date: 2015-12-28
Summary
This data set includes three files in comma-separated (.csv) format and three shapefiles (.shp) provided as zip files (*.zip).
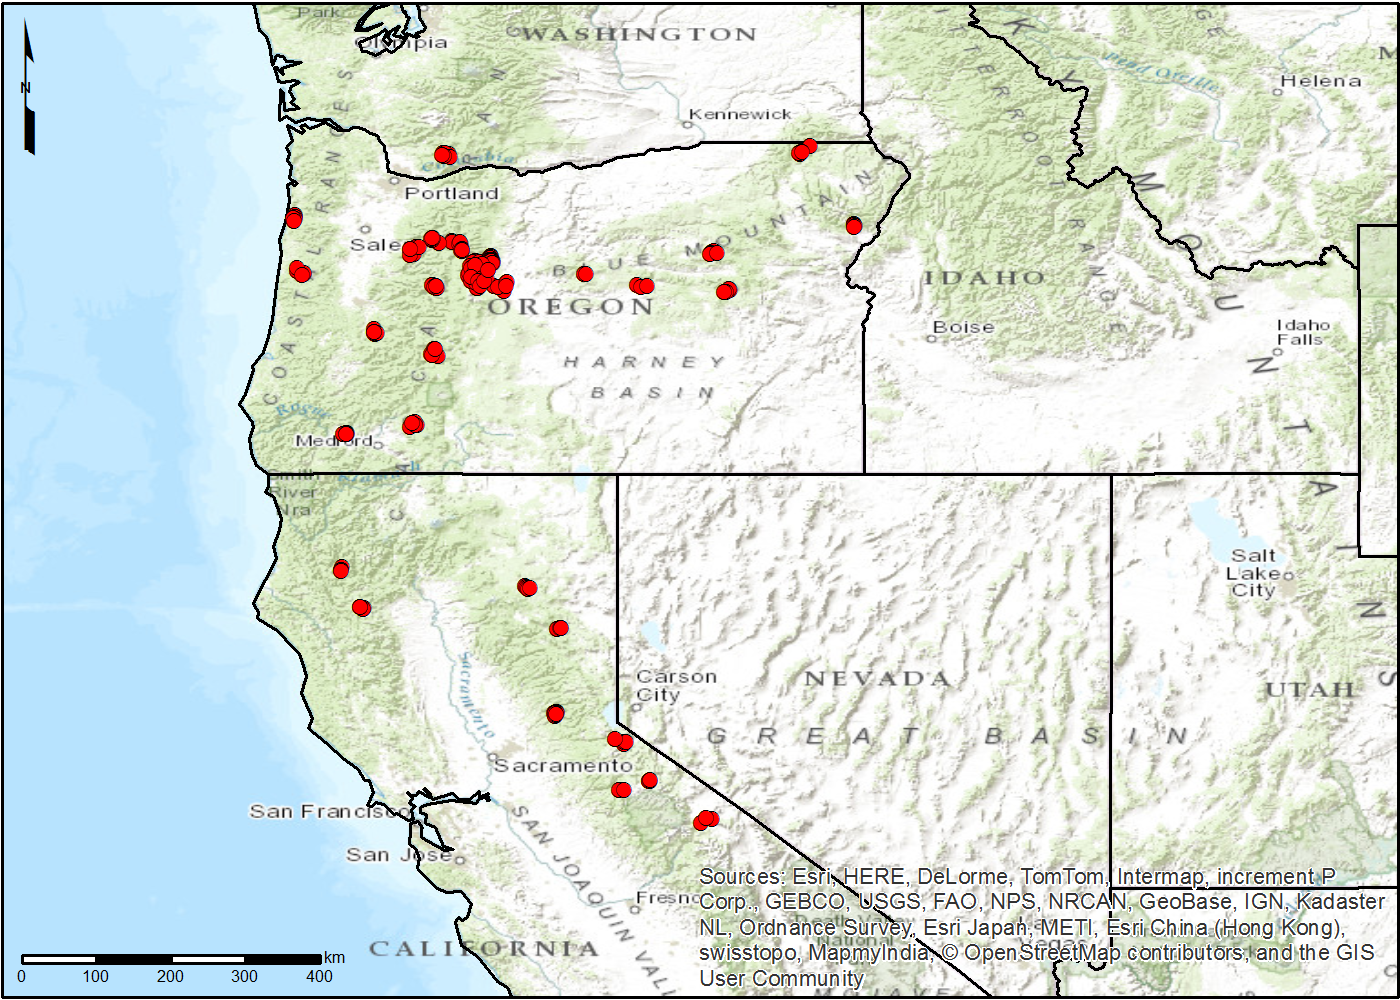
FIgure 1. Locations of the sampling areas in the Pacific Northwest forests.
Citation
Law, B.E., and L.T. Berner. 2015. NACP TERRA-PNW: Forest Plant Traits, NPP, Biomass, and Soil Properties, 1999-2014. ORNL DAAC, Oak Ridge, Tennessee, USA. http://dx.doi.org/10.3334/ORNLDAAC/1292
Table of Contents
- Data Set Overview
- Data Characteristics
- Application and Derivation
- Quality Assessment
- Data Acquisition, Materials, and Methods
- Data Access
- References
Data Set Overview
This data set contains standardized, integrated measurements and estimates of specific leaf area, leaf longevity, leaf carbon and nitrogen for 35 tree and shrub species derived from more than 1,200 branch samples collected from over 200 forest plots, including several AmeriFlux sites. Plot-level measurements of forest composition, structure (e.g. tree biomass), and productivity estimates, as well as measurements of soil structure (e.g. bulk density) and chemistry (e.g. carbon) are also included.
The data are from six projects conducted by the Terrestrial Ecosystem Research and Regional Analysis- Pacific Northwest (TERRA-PNW) research group between 1999 and 2014 across Oregon and Northern California.
Project: North American Carbon Program (NACP)
The NACP (Denning et al., 2005; Wofsy and Harriss, 2002) is a multidisciplinary research program to obtain scientific understanding of North America's carbon sources and sinks and of changes in carbon stocks needed to meet societal concerns and to provide tools for decision makers. Successful execution of the NACP has required an unprecedented level of coordination among observational, experimental, and modeling efforts regarding terrestrial, oceanic, atmospheric, and human components. The project has relied upon a rich and diverse array of existing observational networks, monitoring sites, and experimental field studies in North America and its adjacent oceans. It is supported by a number of different federal agencies through a variety of intramural and extramural funding mechanisms and award instruments.
Data Characteristics
Spatial Coverage
The sampling areas included forests in Oregon and northern California: the Coast Range, West Cascades, East Cascades, Blue Mountains, Klamath Mountains, northern Great Basin, and Sierra Nevada.
Spatial Resolution
The plot design consisted of a 1-ha plot containing four subplots (center, north, southwest, southeast) that were spaced at 35 m between subplot centers, with subplot diameter ranging from 10 to 17 m, depending on tree density.
Temporal Coverage
Measurements for leaf traits are provided for 20000517 - 20140723.
Soil data are provided for 20010603 - 20070820.
Tree biomass and productivity data are provided for 19990527 - 20140723.
Temporal Resolution
Daily in varying months.
Study Area (All latitudes and longitudes are given in decimal degrees)
| Study Area | Westernmost Longitude | Easternmost Longitude | Northernmost Latitude | Southernmost Latitude |
|---|---|---|---|---|
| Forests in Oregon and Northern California | -123.904 | -117.131 | 45.9477 | 37.7844 |
Data File Information
Data are included for:
- Leaf traits-specific leaf area, leaf longevity, leaf carbon and nitrogen for 35 tree and shrub species derived from more than 1,200 branch samples collected from over 200 forest plots, including several AmeriFlux sites
- Plot-level measurements of forest composition, structure (e.g. tree biomass), and productivity estimates
- Soil chemistry, bulk density, soil carbon, and soil nitrogen
There are three files in comma-separated (.csv) format and three shapefiles (.shp) provided as zip files (*.zip):
File 1. NACP_TERRA_PNW_leaf_trait.csv: This file provides leaf trait variables for the years 2000-2002, 2005,2008, and 2014.
File 2. NACP_TERRA_PNW_biomass_productivity.csv: This file provides tree wood and foliage aboveground biomass for the years 1999, 2001-2002, 2004-2005, 2007-2008, and 2014.
File 3. NACP_TERRA_PNW_soil.csv: This file provides soil chemistry and bulk density data for the years 2001, 2004-2005, and 2007.
File 4. NACP_TERRA_PNW_leaf_trait.zip: A shapefile (.shp) of the data in file 1, provided in a .zip file.
File 5. NACP_TERRA_PNW_biomass_productivity.zip: A shapefile (.shp) of the data in file 2, provided in a .zip file.
File 6. NACP_TERRA_PNW_soil.zip: A shapefile (.shp) of the data in file 3, provided in a .zip file.
File 1. NACP_TERRA_PNW_leaf_trait.csv
Missing data are represented as -9999.
| Column | Column Heading | Units/format | Description |
|---|---|---|---|
| 1 | PROJECT | Project name | |
| 2 | YEAR | YYYY | Sampling year |
| 3 | MONTH | MM | Sampling month |
| 2 | DAY | DD | Sampling day |
| 4 | PLOT_ID | Plot identification number | |
| 5 | ECOREGION | EPA Level III Ecoregion | |
| 6 | CLUSTER | General sampling area | |
| 7 | LATITUDE | decimal degrees | Plot latitude (WGS84) |
| 8 | LONGITUDE | decimal degrees | Plot longitude (WGS84) |
| 9 | LAI_O | m2/m2 | Overstory leaf area index |
| 10 | HEIGHTC_m | m | Plot-average canopy height |
| 11 | PFT | Plant function type | |
| 12 | DIVISION | Angiosperm or gymnosperm | |
| 13 | GENUS | Genus name | |
| 14 | SPECIES | Species name | |
| 15 | COMMON_NAME | Species common name | |
| 16 | LEAF_PSA | cm2 | Leaf projected surface area (PSA) |
| 17 | PSA_to_HSA | Coefficient converting PSA to HSA (see Table 5 in this document) | |
| 18 | LEAF_HSA | cm2 | Leaf hemisurface area (HSA) |
| 19 | LEAF_DRY_WT | g | Leaf sample dry weight |
| 20 | LEAF_CARBON_WT | gC | Leaf sample carbon weight |
| 21 | SLA_PSA | cm2 PSA/gC | Specific leaf area based on PSA |
| 22 | SLA_HSA | cm2 HSA/gC | Specific leaf area based on HSA |
| 23 | LEAF_CARBON | percent | Leaf carbon mass fraction |
| 24 | LEAF_NITROGEN | percent | Leaf nitrogen mass fraction |
| 25 | LEAF_CN | Leaf carbon to nitrogen mass ratio | |
| 26 | LEAF_LIFE | year | Leaf lifespan |
| 27 | NOTES | General notes |
File 2: NACP_TERRA_PNW_biomass_productivity.csv
Missing data are represented as -9999.
| Column | Column Heading | Units/format | Description | |
|---|---|---|---|---|
| 1 | PROJECT | Project name | ||
| 2 | YEAR | YYYY | Sampling year | |
| 3 | MONTH | MM | Sampling month | |
| 4 | DAY | DD | Sampling day | |
| 5 | PLOT_ID | Plot identification number | ||
| 6 | PLOT_ID_ALT | Alternative PLOT_ID is previously sampled | ||
| 7 | PLOT_ID_AMERIFLUX | AmeriFlux site name abbreviation | ||
| 8 | ECOREGION | EPA Level III Ecoregion | ||
| 9 | CLUSTER | General sampling area | ||
| 10 | LATITUDE | decimal degrees | Plot latitude (WGS84) | |
| 11 | LONGITUDE | decimal degrees | Plot longitude (WGS84) | |
| 12 | ELEVATION | m | Elevation above sea level | |
| 13 | MAT_C | degrees C | Mean annual temperature (1984-2013) | |
| 14 | MAP | mm/yr | Mean annual precipitation (1984-2013) | |
| 15 | SITE_DESC | General site description | ||
| 16 | ASA | year | Average stand age | |
| 17 | SPP_O1_ABBREV | Primary overstory species abbreviation | ||
| 18 | SPP_O1_BASAL_AREA_FRACTION | Primary overstory species basal area fraction | ||
| 19 | SPP_O2_ABBREV | Secondary overstory species abbreviation | ||
| 20 | SPP_O2_BASAL_AREA_FRACTION | percent | Secondary overstory species basal area fraction | |
| 21 | SPP_O3_ABBREV | Tertiary overstory species abbreviation | ||
| 22 | SPP_O3_BASAL_AREA_FRACTION | percent | Tertiary overstory species basal area fraction | |
| 23 | SPP_O4_ABBREV | Quaternary overstory species abbreviation | ||
| 24 | SPP_O4_BASAL_AREA_FRACTION | percent | Quaternary overstory species basal area fraction | |
| 25 | LAI_O | m2/m2 | Stand overstory leaf area index | |
| 26 | HEIGHTC | m | Average canopy height | |
| 27 | AG_BIOMASS_TREE_WOOD_AS_CARBON | gC/m2 | Tree wood aboveground biomass | |
| 28 | AG_BIOMASS_TREE_FOLIAGE_AS_CARBON | gC/m2 | Tree foliage aboveground biomass | |
| 29 | AG_BIOMASS_TREE_TOTAL_AS_CARBON | gC/m2 | Tree total aboveground biomass | |
| 30 | AG_PROD_TREE_WOOD_AS_CARBON | gC/m2/yr | Tree wood aboveground productivity | |
| 31 | AG_PROD_TREE_FOLIAGE_AS_CARBON | gC/m2/yr | Tree foliage aboveground productivity | |
| 32 | AG_PROD_TREE_TOTAL_AS_CARBON | gC/m2/yr | Tree total aboveground productivity |
File 3 : NACP_TERRA_PNW_soil.csv
Missing data are represented as -9999.
| Column | Column Heading | Units/format | Description |
|---|---|---|---|
| 1 | PROJECT | Project name | |
| 2 | YEAR | YYYY | Sampling year |
| 3 | MONTH | MM | Sampling month |
| 4 | DAY | DD | Sampling day |
| 5 | PLOT_ID | Plot identification number | |
| 6 | PLOT_ID_ALT | Alternative PLOT_ID is previously sampled | |
| 7 | PLOT_ID_AMERIFLUX | AmeriFlux site name abbreviation | |
| 8 | ECOREGION | EPA Level III Ecoregion | |
| 9 | CLUSTER | General sampling area | |
| 10 | LATITUDE | decimal degrees | Plot latitude (WGS84) |
| 11 | LONGITUDE | decimal degrees | Plot longitude (WGS84) |
| 12 | ELEVATION | m | Elevation above sea level |
| 13 | MAT_C | degrees C | Mean annual temperature (1984-2013) |
| 14 | MAP | mm/yr | Mean annual precipitation (1984-2013) |
| 15 | SOIL_DEPTH | cm | Total soil depth |
| 16 | SOIL_LAYER | Soil layer sampled | |
| 17 | UPPER_DEPTH_OF_SOIL_LAYER | cm | Upper depth of the soil layer |
| 18 | LOWER_DEPTH_OF_SOIL_LAYER | cm | Lower depth of the soil layer |
| 19 | BULK_DENSITY | kg/m2 | Soil bulk density for a specified soil profile layer |
| 20 | CARBON_CONTENT_OF_SOIL_LAYER | gC/m2 | Carbon mass for a specified mineral soil profile layer, given in grams of C per square meter of ground |
| 21 | NITROGEN_CONTENT_OF_SOIL_LAYER | gN/m2 | Nitrogen mass for a specified mineral soil profile layer, given in grams of N per square meter of ground |
| 22 | pH_OF_SOIL_LAYER | pH of the soil layer | |
| 23 | VOLUME_FRACTION_OF_SAND_IN_SOIL_LAYER | percent |
Volume fraction of sand in the soil layer Volume fraction of sand (0.05-2 mm diameter) for a specified profile layer, with values given as a percentage of total air-dry mass excluding fragments > 2-mm diameter. |
| 24 | VOLUME_FRACTION_OF_SILT_IN_SOIL_LAYER | percent | Volume fraction of silt (0.002-0.05 mm diameter) for a specified profile layer, with values given as a percentage of total air-dry mass excluding fragments > 2-mm diameter. |
| 25 | VOLUME_FRACTION_OF_CLAY_IN_SOIL_LAYER | percent | Volume fraction of clay (< 0.002 mm diameter) for a specified profile layer, with values given as a percentage of total air-dry mass excluding fragments > 2-mm diameter. |
Shapefiles
There are three shapefiles (*.zip files) which provide the data from files 1-3 above. All shapefiles contain six files (*.shx, *.dbf, *.prj, *.sbn, *.sbx, and *.shp).
File 4. NACP_TERRA_PNW_leaf_trait.zip: A shapefile (.shp) of leaf trait data in file 1.
File 5. NACP_TERRA_PNW_biomass_productivity.zip: A shapefile (.shp) of biomass data in file 2.
File 6. NACP_TERRA_PNW_soil.zip: A shapefile (.shp) of soil data in file 3.
Parameters of the shapefiles:
Geometry Type: Point
Geographic Coordinate System: GCS_WGS_1984
Datum: D_WGS_1984
Prime Meridian: Greenwich
Angular Unit: Degree
Extent:
North: 45.9477
South: 37.7844
West: -123.9038
East: -117.1309
Attributes:
FID: Internal feature number; sequential unique whole numbers that are automatically generated
Shape: Feature geometry
***ALL OTHER ATTRIBUTES ARE THE SAME AS THE *.CSV FILES***
Companion Files
There are three companion files provided with this data set (.kmz format) included for quick visualization in Google Earth. The files provide the same data as the files listed above:
NACP_TERRA_PNW_leaf_trait.kmz
NACP_TERRA_PNW_forest_biomass_productivity.kmz
NACP_TERRA_PNW_soil.kmz
Application and Derivation
This data set provides standardized plant trait measurements and associated plot-level characteristics important for ecosystem modeling.
These data have been used to (1) parameterize and test ecological models (2) evaluate satellite algorithms and eddy covariance measurements (3) assess regional carbon budgets and consequences of forest management (e.g. harvest regimes, bioenergy production); and (4) explore relationships between soil carbon and detritus.
Quality Assessment
Consistent field and laboratory protocols (Law et al., 2008) were employed among projects. Exceptions did occur, such as Pinus leaf area estimated using callipers vs. a LI-3100C when deriving specific leaf area (SLA). The sampling intensity specified by the protocols was designed to achieve a coefficient of variation <20%. Repeat measurements of leaf area using the LI-3100C tended to vary by less than 3%. Additionally, all elemental analysis of leaf and soil carbon and nitrogen were performed by Central Analytical Laboratory, which incorporated periodic measurements of calibration samples and blanks to ensure accuracy.
After compiling the data, several quality control measures were implemented on the leaf trait (SLA, C, N, and lifespan) measurements. We plotted each variable and combinations of variables to identify and correct errors in data entry, as well as to identify and remove potential erroneous measurement. After correcting obvious data entry errors, we then identified leaf trait measurements that exceeded the species-average by more than three standard deviations. Making two passes through the dataset, we chose to screening branch samples if any trait measurement exceeded this threshold; a criteria for inclusion that struck a balance between the need to remove erroneous measurements, while also maintain the full range of phenotypic plasticity.
Estimates of leaf lifespan, leaf nitrogen, and SLA for evergreen needleleaf trees differed, respectively, by +60%, -15%, and -6% in comparison to global estimates for this plant flucntional type (PFT) from the TRY plant-trait data base (Kattge et al., 2011). Similarly, estimates for deciduous broadleaf trees differed from TRY estimates by +95%, 0%, and +12% for the same traits. Some of this variation can be attributed to differences in species mixture between our regional dataset and the globally-oriented TRY data set.
Differences in species-specific leaf trait estimates between our study and other studies could be due to (1) trait variation along resource gradients (Dwyer et al., 2014, Guerin et al., 2012); (2) differences in plant exposure to short-term stress (e.g. leaf shedding due to drought-stress); (3) differences in the seasonality of sample collection (Matson et al., 1994, Nippert and Marshall, 2003); (4) differences in sampling location within the canopy (Nippert and Marshall, 2003, Marshall and Monserud, 2003); or (5) differences in sample processing methods (e.g. SLA estimated with or without the petiole) (Pérez-Harguindeguy et al., 2013).
Data Acquisition, Materials, and Methods
The descriptions below are largely from Berner and Law (In press). Please see this publication for additional information. This data set provides the data that are described in that article plus the derived Shapefiles as described in Section 2.
Site and project descriptions
Sampling sites (n=239) from six projects were spread among six forested ecoregions located in Oregon and northern California:
1) The RADAR project (1999) focused on the East Cascades and sought to characterize forest canopy structure and biomass. Measurements were made on 20 plots, largely dominated by ponderosa pine (Pinus ponderosa), but several were dominated by grand fir (Abies grandis).
2) The EPA project (2001) was a regional study over Oregon and northern California. Measurements were made on 96 plots, with 36 plots spread among three intensive clusters (Coast Range, West Cascades, East Cascades), each of which included 4 age classes x 3 replications. The remaining 60 plots were distributed regionally to capture Landsat spectral variability.
3) The COHO project (2002) focused on measuring and modeling carbon stocks and fluxes at five sites in the East Cascades. Measurements were made at young, mature and old ponderosa pine sites, as well as at mature grand fir and western juniper (Juniperus occidentalis) sites.
4) The Oregon and California (ORCA) project (2004-2005) sought to broaden the regional sampling network and tree species representation though extensive sampling in the East Cascades, Blue Mountains, Klamath Mountains, northern Great Basin, and Sierra Nevada, with measurements made on 80 plots (Law et al., 2006, Hudiburg et al., 2009). In 2005, measurements were made on 14 of these plots in the Sierra Nevada.
5) The Metolius Fire (METOFIRE) project (2007-2008) focused on quantifying pre- and post-fire carbon pools and productivity on four mixed-severity wildfires (2002-2003) in mixed fir and ponderosa pine forests in East Cascades (Meigs et al., 2009). Measurements were made on 64 plots, with burned and unburned stands measured in 2007 and 2008, respectively.
6) The Cascade Drought Impact Study (CADIS; 2014) evaluated the role of water availability in shaping tree morphological traits and forest carbon cycling along a steep climatic gradient in the East Cascades (Berner and Law, 2015). Measurements were made on 15 sites spread evenly among western juniper, ponderosa pine, and grand fir.
Table 4. Summary of Terra-PNW projects. The primary sampling year and key references are provided for each project, as are number of sites, genera, species, and branch samples.
| Project | Year | Number of… | Key references | |||
| Sites | Genera | Species | Branches | |||
| RADAR | 1999 | 20 | --- | --- | --- | Law et al. (2001) |
| EPA | 2001 | 90 | 19 | 24 | 562 | Law et al. (2004) |
| COHO | 2002 | 3 | 5 | 5 | 86 | Schwarz et al. (2004) |
| ORCA | 2004 | 73 | 13 | 18 | 397 | Law et at. (2006) |
| METOFIRE | 2007 | 64 | 2 | 2 | 88 | Meigs et al. (2009) |
| CADIS | 2014 | 15 | 4 | 6 | 163 | Berner & Law (2015) |
Field sampling
The plot design consisted of a 1-ha plot containing four subplots (center, north, southwest, southeast) that were spaced at 35 m between subplot centers, with subplot diameter ranging from 10 to 17 m, depending on tree density. Tree height and diameter at breast height (DBH) were measured on each subplot for all stems that were 10-80 cm DBH. All large trees >80 cm DBH were measured on the entire 1-ha plot, while sapling surveys (stems 1-10 cm DBH) were conducted inside the subplots with radii of 2-5 m depending on tree density. Around twenty tree cores were collected per plot, with half used to estimate annual growth and age, and the remaining used to determine wood density. Overstory leaf area index (LAI, one-sided) was measured at 35-45 locations on each subplot using an LAI-2000 or LAI-2200 (LiCor, Lincoln, NE).
Mid-canopy, south-facing branches with high, but vertically-variable light exposure were harvested for each species present on a plot, with sample size per species (generally 5 to 10) determined by the species prevalence within a plot. Additionally, soil cores were collected from multiple layers (e.g. 0-20, 20-50, 50-100 cm).
Foliage analysis
Leaf carbon and nitrogen content
Leaf carbon and nitrogen content were measured on one-year old foliage, except in the case of deciduous species, where measurements were based on current-year, fully-expanded and hardened foliage. Leaf samples were oven-dried at 70 degrees C for at least 48 hours and then finely ground using a coffee-grinder, mortar and pestle, or both. Carbon and nitrogen concentrations were then measured with a LECO CNS2000 analyzer by Central Analytical Laboratory at Oregon State University.
Specific leaf area
SLA was measured on one-year old foliage, except in the case of deciduous species, where measurements were based on current-year, fully-expanded and hardened foliage. Fresh leaf PSA was measured using a LI-3100C Area Meter (LiCor, Lincoln, NE). For broad-leaf angiosperms, leaf PSA was assumed to be equivalent to hemisurface area (HSA; while for conifers, leaf PSA was converted to HSA using published conversion coefficients (Barclay et al., 2000, Smith et al., 1991, Hicks and Dugas 1998, Gower and Norman 1991, Law et al., 2001).
Species with unknown conversion coefficients were assigned values from similar species. For Pinus species, leaf HSA was estimated from measurements of needle length and maximum fascicle diameter, except for samples collected as part of the CADIS project, which were scanned using the LI-3100C. After measuring leaf surface area, the samples were oven-dried at 70 degrees C for at least 48 hours and then weighed. Leaf dry mass was converted to carbon based on elemental analysis of sample carbon content (described above). The SLA of each sample was then calculated by dividing leaf PSA or HSA by carbon mass.
Table 5. Summary of literature-derived coefficients used to convert projected surface area (PSA) of selected species to hemisurface area (HSA) when determining specific leaf area.
| Species |
Coefficient used to convert PSA to HSA |
Reference | Notes |
| Abies lasiocarpa | 1.09 | Smith et al., 1991 | Interpreted from Fig. 1 (Smith et al., 1991) and bias-corrected by 0.16 based on systematic offset in comparison of PINPON, PINCON, and PSEMEN from Barclay and Goodman, 2000; Law et al., 2001 |
| Abies magnifica | 1.09 | Barclay and Goodman, 2000 | Coefficient for Abies grandis |
| Abies procera | 1.09 | Barclay and Goodman, 2000 | Coefficient for Abies grandis |
| Calocedrus decurrens | 1.15 | Barclay and Goodman, 2000 | Coefficient for Tsuga heterophylla |
| Juniperus occidentalis | 1.57 | Hicks and Dugas, 1998 | |
| Larix occidentalis | 1.29 | Gower and Norman, 1991 | Coefficient for Lairx decidua |
| Picea engelmannii | 1.19 | Smith et al., 1991 | See note for Abies lasiocarpa |
| Picea sitchensis | 1.16 | Barclay and Goodman, 2000 | |
| Pinus contorta | 1.29 | Barclay and Goodman, 2000 | |
| Pinus flexilis | 1.19 | Smith et al., 1991 | See note for Abies lasiocarpa |
| Pinus jeffreyi | 1.18 | Law et al., 2001 | Coefficient for Pinus ponderosa |
| Pinus lambertiana | 1.18 | Law et al., 2001 | Coefficient for Pinus ponderosa |
| Pinus monticola | 1.18 | Law et al., 2001 | Coefficient for Pinus ponderosa |
| Pinus ponderosa | 1.18 | Law et al., 2001 | Coefficient for Pinus ponderosa |
| Pseudotsuga menziesii | 1.19 | Barclay and Goodman, 2000 | |
| Thuja plicata | 1.14 | Barclay and Goodman, 2000 | |
| Tsuga heterophylla | 1.15 | Barclay and Goodman, 2000 | |
| Tsuga mertensiana | 1.15 | Barclay and Goodman, 2000 | Coefficient for Tsuga heterophylla |
Leaf lifespan
Leaf lifespan, also known as leaf longevity or leaf retention time, describes the number of years that a leaf is alive. Leaf lifespan was estimated using the “counting cohorts” method, which involves counting the number of annual leaf cohorts present on an individual branch back to the point where less than 50% of the leaves produced during a given year still remain attached to the branch (Pérez-Harguindeguy et al., 2013).
Stand characterization
Geographic location
The latitude, longitude, and elevation are provided for each plot. Geographic coordinates are given in decimal degrees based on the WGS84 geographic datum and elevation is in meters above sea level. Geographic coordinates were determined using a hand-held global positioning system (GPS). Elevations were extracted from the Shuttle Radar Topography Mission version 2 digital elevation model based on the geographic coordinates.
Stand age
Stand age is defined in this case as the average age, given in years, of the oldest 10% of trees located in a stand or, if fewer than three trees fell into the oldest 10%, then the average age of all trees that were cored. Stand age was estimated based on tree cores collected from eight to 20 trees on each plot, with sample size dependent on project. Trees were cored to the pith at breast height using an increment borer. The tree cores were mounted on a wooden block and sanded to reveal the annual rings. The age of each tree was then determined by either examining the tree core under a microscope, or by scanning the tree core with a flatbed scanner and then ingesting the image into the WinDENDRO software (Regent Instruments Inc., Québec). For large trees where increment core samples did not reach the pith, the missing rings were determined from total number of rings within 5 cm distance of the inner end of core sample and estimates of the missing length by subtracting increment core length from the radius of the tree at breast height.
Species overstory composition
Species overstory composition described the relative dominance of overstory species on a plot and is provided for up to four species. Each species is denoted using a six-letter genus-species abbreviation. Species dominance is described as the percentage of stand basal area represented by the species. Basal area was computed for each tree based on measurement of DBH and then summed within species.
Average canopy height
Average canopy height, given in meters, of all trees located on a plot. Tree height was measured using a laser.
Leaf area index
Summer maximum leaf area index of the overstory canopy corrected for canopy and foliage clumping, as well as wood interception (Law et al., 2001; Chen et al., 1996). Optical measurements of the effective overstory canopy LAI were made at breast height (1.37 m) with a LAI-2000 or LAI-2200 Plant Canopy Analyzer (LI-COR Inc., Lincoln, NE) under diffusive light at 35-45 locations on the each sample plot. Measurements were corrected for clumping and wood interception based on the method described in Law et al., 2001. The measurements were subject to post-collection processing to remove data points measured below the threshold of irradiance (< 0.2 umol m-2 s-1) of the above canopy sensor. Species-specific values of the needle-to-shoot ratio for foliage clumping within shoot (gamma) were from published data of Law et al., 2001, Gower et al.,1999, and Frazer et al., 2000. Species with unknown gamma were assigned values from morphologically similar species. In mixed-species stands, the gamma-clumping corrections were weighted by the frequency distribution of stem counts of each species, or by the relative basal area of each species, depending on project. Elemental clumping index (omega), which quantifies the effect of foliage clumping at scales larger than the shoot, was determined from continuous measurements with a TRAC (3rd Wave Engineering, Ontario, Canada) optical device along three 100-m transects (Law et al., 2001) or by LAI-2200 measurements at each sampling point. Wood interception (W), defined here as half-surface area of stem and branches above breast-height (1.37 m), was computed as a function of stand basal area at breast height based on the strong relationship (r2=0.90) observed between W and basal area across 96 sites measured as part of the EPA project (Law, unpublished data). Overstory LAI was then computed by subtracting W from clumping-corrected LAI.
Projected surface area (PSA) was converted to hemisurface area (HSA) when determining specific leaf area.
Tree aboveground biomass
Aboveground biomass of live tree wood (i.e., stem, branches, and bark) and tree foliage per square meter of ground (g C m-2 ground), as well as total (i.e., wood + foliage) aboveground biomass pool, were estimated for each plot. For each tree on a plot, wood component biomass was estimated based on measurements of tree DBH and height. Stem volume was estimated using species- and ecoregion-specific volume allometric equations; where species- or ecoregion-specific equations were not available, substitutions were made based on growth form and plant type (Law et al., 2001, Means et al., 1996, Means et al., 1994, Gholz et al., 1979) . Stem volume was then converted to mass based on species-specific wood density, with wood density either measured using tree cores from the plots or taken from regional (USDA Forest Service, 1965, 1972) or national (Forest Products Laboratory, 1974) technical reports prepared by the USDA Forest Service. Branch and bark mass were estimated using species-specific biomass equations, again substituting equations for similar species were necessary. Stem, branch and bark dry mass were assumed to be 51% carbon. Aboveground tree wood biomass was then derived by summing component carbon pools across trees on a subplot, dividing by subplot area, and then averaging across subplots. Tree foliage biomass was estimated for each subplot from overstory LAI and species biomass-weighted average leaf mass per unit area (LMA = 1/SLA), converted to carbon mass based on plot-average leaf carbon concentrations, and then averaged across subplots. Total aboveground biomass on each subplot was computed as the sum of wood and foliage biomass.
Tree annual aboveground net primary productivity
Annual aboveground net primary productivity of tree wood and tree foliage per square meter of ground per year (g C m-2 ground year-1), as well as total aboveground productivity, were estimated for each plot. For each tree on a plot wood component net productivity was estimated based on the difference in biomass at two points in time divided by the number of intervening years, generally 5- or 10-years depending on project. Current wood biomass was estimated as described above, while prior wood biomass was estimated by hindcasting tree DBH and height using tree core increment measurements and DBH-height relationships. Wood component productivity was summed across trees on a subplot, divided by subplot area, and then averaged across subplots. Tree foliage productivity was calculated for each subplot by dividing foliage carbon mass, as described above, by the species biomass-weighted average leaf longevity and then averaged across subplots.
Soil characterization
Soil depth
Effective soil depth (cm) measured with a steel tile probe to a maximum depth of 100 cm.
Soil profile minimum and maximum depth
Each soil characteristic described below was derived for a given portion of the mineral soil profile, defined by a minimum and maximum depth below the mineral soil surface, given in centimeters. Target depth in each soil profile included 0-20 cm, 20-50 cm, and 50-100 cm; however, the actual profile depths are noted for each layer.
Soil bulk density
Bulk density was determined using material < 2 mm diameter based on air-dry weight and soil core volumes that excluded coarser fragments.
Soil carbon and nitrogen mass
The soil samples were air-dried using a ventilated drying system and then live vegetation and roots were removed. Samples were pulverized, then carbon and nitrogen content were measured with a LECO CNS2000 analyzer by Central Analytical Laboratory at Oregon State University. Carbon and nitrogen content in each mineral soil profile layer were then computed from elemental concentrations, soil bulk density, and sampling depth. See Sun et al. (2004) for more details.
Soil pH
Soil pH for a specified profile layer was determined using a ratio of soil mass to water of 1:2. The analysis was performed by Central Analytical Laboratory at Oregon State University.
Soil sand, silt, and clay content
The fraction of each particle size class was determined using air-dried soil samples following the specification hydrometer method described in Gee and Bauder (1986). This analysis was performed by Central Analytical Laboratory at Oregon State University.
Data Access
This data is available through the Oak Ridge National Laboratory (ORNL) Distributed Active Archive Center (DAAC).
NACP TERRA-PNW: Forest Plant Traits, NPP, Biomass, and Soil Properties, 1999-2014
Contact for Data Center Access Information:
- E-mail: uso@daac.ornl.gov
- Telephone: +1 (865) 241-3952
References
Barclay, H. J. and Goodman, D. Conversion of total to projected leaf area index in conifers. Canadian Journal of Botany 78, 447-454 (2000).
Berner, L. T. and Law, B. E. Plant traits, productivity, biomass and soil properties from forest sites in the Pacific Northwest, 1999-2014. (2016).Scientific Data. 3. Article 160002. https://doi.org/10.1038/sdata.2016.2 .
Berner, L. T. and Law, B. E. Water limitations on forest carbon cycling and conifer traits along a steep climatic gradient in the Cascade Mountains, Oregon. Biogeosciences 12, 6617-6635, doi:10.5194/bg-12-6617-2015 (2015).
Chen, J. M. Optically-based methods for measuring seasonal variation of leaf area index in boreal conifer stands. Agricultural and Forest Meteorology 80, 135-163 (1996).
Denning, A.S., et al. 2005. Science implementation strategy for the North American Carbon Program: A Report of the NACP Implementation Strategy Group of the U.S. Carbon Cycle Interagency Working Group. U.S. Carbon Cycle Science Program, Washington, DC. 68 pp.
Dwyer, J. M., Hobbs, R. J. & Mayfield, M. M. Specific leaf area responses to environmental gradients through space and time. Ecology 95, 399-410, doi:10.1890/13-0412.1 (2014).
Forest Products Laboratory. Would Handbook: Wood as an engineering material. 72 (Forest Products Laboratory, 1974).
Frazer, G. W., Trofymow, J. & Lertzman, K. P. Canopy openness and leaf area in chronosequences of coastal temperate rainforests. Canadian Journal of Forest Research 30, 239-256 (2000).
Gee, G. W. and Bauder, J. M. in Methods of Soil Analysis, Part 1- Physical and Mineralogical Methods Vol. Agronomy Monograpy 9 (ed A. Klute) 383-411 (Soil Science Society of America, 1986).
Gholz, H. L., Grier, C., Campbell, A. & Brown, A. Equations for estimating biomass and leaf area of plants in the Pacific Northwest. (Oregon State University, School of Forestry, Forest Research Lab, Corvallis, OR, 1979).
Gower, S. T., Kucharik, C. J. & Norman, J. M. Direct and indirect estimation of leaf area index, fapar, and net primary production of terrestrial ecosystems. Remote Sensing of Environment 70, 29-51 (1999).
Gower, S. T. & Norman, J. M. Rapid estimation of leaf area index in conifer and broad-leaf plantations. Ecology 72, 1896-1900 (1991).
Gower, S. T., Grier, C. C. & Vogt, K. A. Aboveground production and N and P use by Larix occidentalis and Pinus contorta in the Washington Cascades, USA. Tree physiology 5, 1-11 (1989).
Guerin, G. R., Wen, H. & Lowe, A. J. Leaf morphology shift linked to climate change. Biology letters 8, 882-886 (2012).
Hicks, R. & Dugas, W. Estimating ashe juniper leaf area from tree and stem characteristics. Journal of Range Management Archives 51, 633-637 (1998).
Hudiburg, T. et al. Carbon dynamics of Oregon and Northern California forests and potential land-based carbon storage. Ecological Applications 19, 163-180 (2009).
Kattge, J. et al. TRY–a global database of plant traits. Global Change Biology 17, 2905-2935 (2011).
Law, B. E. Regional analysis of drought and heat impacts on forests: current and future science directions. Global Change Biology 20, 3595-3599, doi:10.1111/gcb.12651 (2014).
Law, B. E. et al. Terrestrial carbon observations: Protocols for vegetation sampling and data submission. (Food and Agriculture Organization of United Nations, 2008).
Law, B. E. et al. in Scaling and Uncertainty Analysis in Ecology, 167-190 (Springer, 2006).
Law, B. E., Cescatti, A. & Baldocchi, D. D. Leaf area distribution and radiative transfer in open-canopy forests: implications for mass and energy exchange. Tree Physiology 21, 777-787 (2001).
Law, B. E., Thornton, P. E., Irvine, J., Anthoni, P. M. & Van Tuyl, S. Carbon storage and fluxes in ponderosa pine forests at different developmental stages. Global Change Biology 7, 755-777 (2001).
Law, B. E., Van Tuyl, S., Cescatti, A. & Baldocchi, D. D. Estimation of leaf area index in open-canopy ponderosa pine forests at different successional stages and management regimes in Oregon. Agricultural and Forest Meteorology 108, 1-14 (2001).
Lei, T. & Lechowicz, M. Functional responses of Acer species to two simulated forest gap environments: leaf-level properties and photosynthesis. Photosynthetica 33, 277-289 (1997).
Marshall, J. D. & Monserud, R. A. Foliage height influences specific leaf area of three conifer species. Canadian Journal of Forest Research 33, 164-170 (2003).
Matson, P., Johnson, L., Billow, C., Miller, J. & Pu, R. Seasonal patterns and remote spectral estimation of canopy chemistry across the Oregon transect. Ecological Applications, 280-298 (1994).
Means, J. E., Krankina, O. N., Jiang, H. & Li, H. Estimating live fuels for shrubs and herbs with BIOPAK. 21 (U.S. Department of Agriculture, Forest Service, Pacific Northwest Research Station, Portland, OR, 1996).
Means, J. E., Hansen, H. A., Koerper, G. J., Alaback, P. B. & Klopsch, M. W. Software for computing plant biomass--BIOPAK users guide. 184 (U.S. Department of Agriculture, Forest Service, Pacific Northwest Research Station, Portland, OR, 1994).
Meigs, G. W., Donato, D. C., Campbell, J. L., Martin, J. G. & Law, B. E. Forest fire impacts on carbon uptake, storage, and emission: the role of burn severity in the Eastern Cascades, Oregon. Ecosystems 12, 1246-1267 (2009).
Nippert, J. B. & Marshall, J. D. Sources of variation in ecophysiological parameters in Douglas-fir and grand fir canopies. Tree Physiology 23, 591-601 (2003).
Pérez-Harguindeguy, N. et al. New handbook for standardised measurement of plant functional traits worldwide. Australian Journal of Botany 61, 167-234 (2013).
Smith, W., Schoettle, A. & Cui, M. Importance of the method of leaf area measurement to the interpretation of gas exchange of complex shoots. Tree physiology 8, 121-127 (1991).
Sun, O. J., Campbell, J., Law, B. E. & Wolf, V. Dynamics of carbon stocks in soils and detritus across chronosequences of different forest types in the Pacific Northwest, USA. Global Change Biology 10, 1470-1481 (2004).
USDA Forest Service. Western Wood Density Survey: Report No. 2. Vol. FPL-183 (USDA Forest Service, 1972).
USDA Forest Service. Western Wood Density Survey: Report No. 1. Vol. FPL-27 (USDA Forest Service, 1965).
Wofsy, S.C., and R.C. Harriss. 2002. The North American Carbon Program (NACP). Report of the NACP Committee of the U.S. Interagency Carbon Cycle Science Program. U.S. Global Change Research Program, Washington, DC. 56 pp.