Get Data
Revision Date: August 25, 2015
Summary:
This data set provides landcover maps of (1) peatland type (bog, fen, marsh, swamp) with levels of biomass (open, forested) and (2) Burn Severity Index (BSI) (Dyrness and Norum, 1983) for four wildfire areas in northern Alberta, Canada. The four wildfire sites include the Utikuma fire site of 2011, Kidney Lake fire site of 2011, Fort McMurray west fire site of 2009, and Fort McMurray east fire site of 2009.
The peatland classification at 12.5-m resolution (fen vs. bog including treed vs. open vs. shrubby) at each wildfire site was based on a pre-burn 2007 multi-date, multi-sensor fusion (Optical-IR, C-band and L-band SAR) approach. Over 350 field locations were sampled in central Alberta to train and validate the peatland type maps. The additional site, Wabasca, was an unburned site.
Burn severity was measured in the field using the Burn Severity Index (BSI) (Dyrness and Norum 1987), a qualitative assessment of burnt moss that uses a 1-5 scale, with 1 being unburnt and 5 being severely burnt. The field data of ground consumption were correlated with Landsat pre- and post-burn imagery, specific to peatlands, to develop multivariate models for calculating burn severity and %-not-sphagnum-moss. These models were used to generate the Burn Severity Maps at 30-m resolution (percent unburned moss, and the burn severity index (BSI)).
All sites were visited in 2013 for field measurements and the Utikuma site was also visited in 2012 for field measurements. Additional biophysical data for the various peatlands (aboveground biomass – tree and shrub, plant heights, density, etc.) were collected and will be provided in another data set.
There are five peatland type maps in GeoTIFF (*.tif) format and six burn severity maps in GeoTIFF (*.tif) format with this data set. Field data from central Alberta used to train and validate the peatland type maps is included as a comma-separated (*.csv) file.
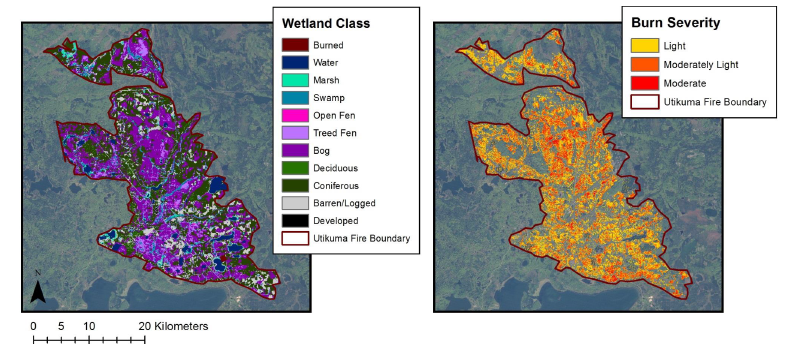
Figure 1. Utikuma site map showing peatland type for non-burned areas and modeled BSI for the Utikuma fire (Bourgeau-Chavez et al., 2015).
Data and Documentation Access:
Get Data: http://daac.ornl.gov/cgi-bin/dsviewer.pl?ds_id=1283
Companion Files:
- NACP_Peatland_Burn-Severity.pdf: a pdf of this guide
Data Citation:
Cite this data set as follows:
Bourgeau-Chavez, L.L., S. Endres, E. Banda, R. Powell, M.R. Turetsky, B. Benscoter, and E.S Kasischke. 2015. NACP Peatland Landcover Type and Wildfire Burn Severity Maps, Alberta, Canada. ORNL DAAC Oak Ridge, Tennessee, USA. http://dx.doi.org/10.3334/ORNLDAAC/1283
Table of Contents:
- 1 Data Set Overview
- 2 Data Characteristics
- 3 Applications and Derivation
- 4 Quality Assessment
- 5 Acquisition Materials and Methods
- 6 Data Access
- 7 References
1. Data Set Overview:
Project: North American Carbon Program (NACP)
The NACP (Denning et al., 2005; Wofsy and Harriss, 2002) is a multidisciplinary research program to obtain scientific understanding of North America's carbon sources and sinks and of changes in carbon stocks needed to meet societal concerns and to provide tools for decision makers. Successful execution of the NACP has required an unprecedented level of coordination among observational, experimental, and modeling efforts regarding terrestrial, oceanic, atmospheric, and human components. The project has relied upon a rich and diverse array of existing observational networks, monitoring sites, and experimental field studies in North America and its adjacent oceans. It is supported by a number of different federal agencies through a variety of intramural and extramural funding mechanisms and award instruments.
This data set provides landcover maps including peatland type (bog, fen, marsh, swamp) and level of biomass (open, forested) and burn severity maps for four wildfire areas in Alberta, Canada. The four wildfire sites include the Utikuma fire site of 2011, Kidney Lake fire site of 2011, Fort McMurray west fire site of 2009, and Fort McMurray east fire site of 2009.
The Peatland Type Maps (fen vs. bog including treed vs. open vs. shrubby) were based on multidate, multi-sensor fusion (Optical-IR, C-band and L-band SAR); the Burn Severity Maps (percent unburned moss, and a burn severity index (BSI)) were based on the ground consumption and Landsat pre- and post-burn imagery specific to peatlands. Over 350 field locations were sampled in in central Alberta to train and validate the peatland type maps.
All sites were visited in 2013 for field measurements and the Utikuma site was also visited in 2012 for field measurements. Burn severity was measured in the field using the Burn Severity Index (BSI) (Dyrness and Norum 1987), a qualitative assessment of burnt moss that uses a 1-5 scale, with 1 being unburnt and 5 being severely burnt. The field data were correlated with Landsat data to develop multivariate models for calculating burn severity and %-not-sphagnum-moss. These models were used to generate the burn severity maps.
2. Data Characteristics:
Spatial Coverage
Central Alberta, Canada
Spatial Resolution
Peatland Landcover Type maps are at 12.5-m resolution and Wildfire Burn Severity Maps are 30-m resolution. Field sites are points in the center of 0.5-acre plots at selected locations across central Alberta within the map areas shown on Figure 2.
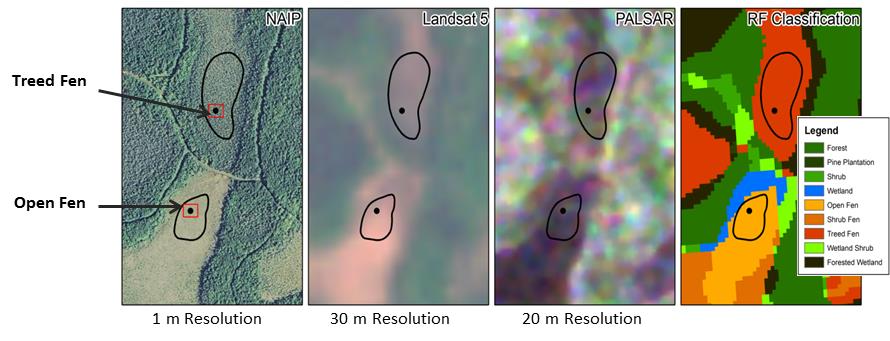
Figure 2. The field validation sampling plot (first image, the National Agricultural Imagery Program ) in relation to the 30-m resolution Landsat, 20-m resolution SAR and the output map product. The red box shows a field measured plot of 40 x 50 m, black dot is the center of this plot. Black outline polygons are air photo interpreted areas for training data in the classifier.
Temporal Coverage
Field data were collected from 2010-06-17 to 2013-07-22
Temporal Resolution
These are one-time estimates of landcover and burn severity, based on one-time measurements at each field site.
Site boundaries: (All latitude and longitude given in decimal degrees, datum: WGS84)
| Site (Region) | Westernmost Longitude | Easternmost Longitude | Northernmost Latitude | Southernmost Latitude |
|---|---|---|---|---|
| Canada | -114.9007 | -110.2864 | 57.2062 | 56.9053 |
Data File Information
There are 11 GeoTIFF files (*.tiff) and one comma-separated file (.csv) with this data set. The GeoTIFF files are landcover maps including peatland type (bog, fen, marsh, swamp) at 12.5-m resolution, and level of biomass (open, forested) and burn severity maps at 30-m resolution for four peatland wildfire areas in northern Alberta, Canada: Utikuma, Kidney Lake, Fort McMurray west, and Fort McMurray east. The .csv file provides field data from central Alberta used to train and validate the peatland type maps.
Table 1. GeoTIFF file names
| File name | |
|---|---|
| Peatland-type GeoTIFFS | |
| peatland_type_fort_mcmurray_east.tif | |
| peatland_type_fort_mcmurray_west.tif | |
| peatland_type_kidney_lake.tif | |
| peatland_type_wabasca.tif | |
| peatland_type_utikuma.tif | |
| Burn Severity GeoTIFFS | |
| BSI_Kidney_Lake_2009.tif | |
| BSI_MWF_2009.tif | |
| BSI_Utikuma_2011.tif | |
| pct-not-sphag_Kidney_Lake_2009.tif | |
| pct-not-sphag_MWF_2009.tif | |
| pct-not-sphag_Utikuma_2011.tif | |
Spatial Data Properties
Peatland-type GeoTIFFS-The spatial properties vary for each Peatland-type GeoTIFF with regards to their spatial extents, column numbers and rows. However the properties below are the same for all files:
Spatial Data Properties
Spatial Representation Type: Raster
Pixel Depth: 4 bit
Pixel Type: byte
Compression Type: LZW
Number of Bands: 1
Raster Format: TIFF
Source Type: descrete
No Data Value: 15
Scale Factor: 0.9996
|
File: peatland_type_fort_mcmurray_east.tif
Spatial Data Properties Number Columns: 6896 Column Resolution: 12.5 meter Number Rows: 9727 Row Resolution: 12.5 meter Extent in the item's coordinate system North: 6278803.284 South: 6157215.784 West: 437201.645 East: 523401.645 Spatial Reference Properties Type: Projected Geographic Coordinate Reference: WGS 1984 Projection: UTM_Zone_12_Northern_Hemisphere Open Geospatial Consortium (OGC) Well Known Text (WKT) PROJCS["UTM_Zone_12N", GEOGCS["WGS 84", DATUM["WGS_1984", SPHEROID["WGS 84",6378137,298.257223563, AUTHORITY["EPSG","7030"]], AUTHORITY["EPSG","6326"]], PRIMEM["Greenwich",0], UNIT["degree",0.0174532925 AUTHORITY["EPSG","4326"]], PROJECTION["Transverse_Mercator"], PARAMETER["latitude_of_origin",0], PARAMETER["central_meridian",-111], PARAMETER["scale_factor",0.9996], PARAMETER["false_easting",500000], PARAMETER["false_northing",0], UNIT["metre",1, AUTHORITY["EPSG","9001"]], AUTHORITY["EPSG","32612"]] File: peatland_type_fort_mcmurray_west.tif Spatial Data Properties Number Columns: 6906 Column Resolution: 12.5 meter Number Rows: 9743 Row Resolution: 12.5 meter Extent in the item's coordinate system North: 6279473.486 South: 6157685.986 West: 403546.17 East:489871.17 Spatial Reference Properties Type: Projected Geographic Coordinate Reference: WGS 1984 Projection: UTM_Zone_12_Northern_Hemisphere Open Geospatial Consortium (OGC) Well Known Text (WKT) PROJCS["UTM_Zone_12N", GEOGCS["WGS 84", DATUM["WGS_1984", SPHEROID["WGS 84",6378137,298.257223563, AUTHORITY["EPSG","7030"]], AUTHORITY["EPSG","6326"]], PRIMEM["Greenwich",0], UNIT["degree",0.0174532925199433], AUTHORITY["EPSG","4326"]], PROJECTION["Transverse_Mercator"], PARAMETER["latitude_of_origin",0], PARAMETER["central_meridian",-111], PARAMETER["scale_factor",0.9996], PARAMETER["false_easting",500000], PARAMETER["false_northing",0], UNIT["metre",1, AUTHORITY["EPSG","9001"]], AUTHORITY["EPSG","32612"]] File: peatland_type_kidney_lake.tif Spatial Data Properties Number Columns: 5482 Column Resolution: 12.5 meter Number Rows: 9743 Row Resolution: 12.5 meter Extent in the item's coordinate system North: 6337775.277 South: 6269250.277 West: 595501.336 East:675951.336 Spatial Reference Properties Type: Projected Geographic Coordinate Reference: WGS 1984 Projection: UTM_Zone_11_Northern_Hemisphere Open Geospatial Consortium (OGC) Well Known Text (WKT) PROJCS["UTM_Zone_11N", GEOGCS["WGS 84", DATUM["WGS_1984", SPHEROID["WGS 84",6378137,298.257223563, AUTHORITY["EPSG","7030"]], AUTHORITY["EPSG","6326"]], PRIMEM["Greenwich",0], UNIT["degree",0.0174532925199433], AUTHORITY["EPSG","4326"]], PROJECTION["Transverse_Mercator"], PARAMETER["latitude_of_origin",0], PARAMETER["central_meridian",-117], PARAMETER["scale_factor",0.9996], PARAMETER["false_easting",500000], PARAMETER["false_northing",0], UNIT["metre",1, AUTHORITY["EPSG","9001"]], AUTHORITY["EPSG","32612"]] File: peatland_type_utikuma.tif Spatial Data Properties Number Columns: 7,937 Column Resolution: 12.5 meter Number Rows: 12,217 Row Resolution: 12.5 meter Extent in the item's coordinate system North: 6260024.076 South: 6107319.336 West: 576912.049 East: 676119.507 Spatial Reference Properties Type: Projected Geographic Coordinate Reference: WGS 1984 Projection: UTM_Zone_11_Northern_Hemisphere Open Geospatial Consortium (OGC) Well Known Text (WKT) PROJCS["UTM_Zone_11N", GEOGCS["WGS 84", DATUM["WGS_1984", SPHEROID["WGS 84",6378137,298.257223563, AUTHORITY["EPSG","7030"]], AUTHORITY["EPSG","6326"]], PRIMEM["Greenwich",0], UNIT["degree",0.0174532925199433], AUTHORITY["EPSG","4326"]], PROJECTION["Transverse_Mercator"], PARAMETER["latitude_of_origin",0], PARAMETER["central_meridian",-117], PARAMETER["scale_factor",0.9996], PARAMETER["false_easting",500000], PARAMETER["false_northing",0], UNIT["metre",1, AUTHORITY["EPSG","9001"]], AUTHORITY["EPSG","32612"]] File: peatland_type_wabasca.tif Spatial Data Properties Number Columns: 6,528 Column Resolution: 12.5 meter Number Rows: 12,932 Row Resolution: 12.5 meter Extent in the item's coordinate system North: 6276847 South: 6115197 West: 313991.275 East: 395591.275 Spatial Reference Properties Type: Projected Geographic Coordinate Reference: WGS 1984 Projection: UTM_Zone_12_Northern_Hemisphere Open Geospatial Consortium (OGC) Well Known Text (WKT) PROJCS["UTM_Zone_12N", GEOGCS["WGS 84", DATUM["WGS_1984", SPHEROID["WGS 84",6378137,298.257223563, AUTHORITY["EPSG","7030"]], AUTHORITY["EPSG","6326"]], PRIMEM["Greenwich",0], UNIT["degree",0.0174532925199433], AUTHORITY["EPSG","4326"]], PROJECTION["Transverse_Mercator"], PARAMETER["latitude_of_origin",0], PARAMETER["central_meridian",-111], PARAMETER["scale_factor",0.9996], PARAMETER["false_easting",500000], PARAMETER["false_northing",0], UNIT["metre",1, AUTHORITY["EPSG","9001"]], AUTHORITY["EPSG","32612"]] |
Burn Severity GeoTIFFS
Table 3. The spatial properties do not vary for the burn severity GeoTIFFS and they are defined below.
Example file: Utikuma_modeled_pct_not_Sphag_bound.tif
|
Spatial Representation Type: Raster Pixel Depth: 32 bit Pixel Type: floating point Compression Type: LZW Number of Bands: 1 Raster Format: TIFF Source Type: descrete No Data Value: -3.40282346639e+038 Scale Factor: 0.9996 Number Columns: 2196 Column Resolution: 30 meter Number Rows: 2986 Row Resolution: 30 meter Extent in the item's coordinate system North: 6278424.60221 South: 6188844.60221 West: 569284.295196 East: 635164.295196 Spatial Reference Properties Type: Projected Geographic Coordinate Reference: WGS 1984 Projection: UTM_Zone_11_Northern_Hemisphere Open Geospatial Consortium (OGC) Well Known Text (WKT) PROJCS["WGS 84 / UTM zone 11N", GEOGCS["WGS 84", DATUM["WGS_1984", SPHEROID["WGS 84",6378137,298.257223563, AUTHORITY["EPSG","7030"]], AUTHORITY["EPSG","6326"]], PRIMEM["Greenwich",0], UNIT["degree",0.0174532925199433], AUTHORITY["EPSG","4326"]], PROJECTION["Transverse_Mercator"], PARAMETER["latitude_of_origin",0], PARAMETER["central_meridian",-117], PARAMETER["scale_factor",0.9996], PARAMETER["false_easting",500000], PARAMETER["false_northing",0], UNIT["metre",1, AUTHORITY["EPSG","9001"]], AUTHORITY["EPSG","32611"]] |
Field Data Descriptions
Field data from central Alberta were used to train and validate the peatland type maps. Field data were compiled from the four fire sites and the Wabasca unburned site. Table 2 describes these data.
Missing values are represented as -9999.
Table 2. File description for Alberta_field_validation_data_variable.csv
| Variable name | Units | Explanation |
|---|---|---|
| Site Name | Unique name given to a field point | |
| Date | YYYY-MM-DD | |
| Latitude | decimal degrees | Latitude in decimal degrees of the center point of each plot. The locations (plots) represent a homogenous ½ acre area around point. |
| Longitude | decimal degrees | Longitude in decimal degrees of the center point of each plot. The locations (plots) represent a homogenous ½ acre area around point. |
| Time | HH:MM | Time at which field work began in local time (MDT) |
| Observers | Name | Person(s) who collected data |
| Peat_depth | cm | Estimate of depth of peat, using a peat probe (depth of rod pushed through the peat layer) |
| Peat_depth_flag | A flag of 1111 indicates a minimum value ( i.e 200 cm indicates peat is greater than 200 cm in depth but actual depth was not measured) and a flag value of 2222 indicates values that were recorded as approximate in the field notes | |
| Soil_ph | pH units, measured in the field, with pH probe at 30cm deep | |
| Ecosystem | Type of ecosystem; Bog, Fen, Marsh, Swamp, Open Water, Upland, Floating Aquatic, Other | |
| Wetness | Wetness of ground estimated by visual inspection: Dry (no moisture present); Moist (moisture present but not saturated); Soggy (saturated with water but no areas of standing water); Standing Water (visible standing water present in plot) | |
| Vegetation | List of vegetation species present | |
| Dense_trees | percent | Percent or range coding-Percent of plot (1/2 acre area) covered in dense trees. |
| Dense_trees_flag | In some plots tree coverage was recorded as an estimated percent in others it was coded as high, moderate or low. For consistency a value of 75 % was recorded for those plots marked high, 50 % for those marked moderate and 25% for those marked low. Plots where the coverage was coded rather than estimated we have included a flag value of 5555 | |
| Dense_trees_dist | Description of dense tree distribution. Three patterns were common and are indicated where noted in field notes: Evenly distributed throughout the plot (E), found primarily in the center of the plot (C) and found primarily around the periphery of the plot (P) | |
| Moderate_trees | percent | Percent or range coding Percent of plot (1/2 acre area) covered in moderate trees. |
| Moderate_trees_flag | In some plots tree coverage was recorded as an estimated percent in others it was coded as high, moderate or low. For consistency a value of 75 % was recorded for those plots marked high, 50 % for those marked moderate and 25% for those marked low. Plots where the coverage was coded rather than estimated we have included a flag value of 5555 | |
| Moderate_trees_dist | Description of moderate tree distribution. Three patterns were common and are indicated where noted in field notes: Evenly distributed throughout the plot (E), found primarily in the center of the plot (C) and found primarily around the periphery of the plot (P) | |
| Sparse_trees | percent | Percent of plot (1/2 acre area) covered in sparse trees. |
| Sparse_trees_flag | In some plots tree coverage was recorded as an estimated percent in others it was coded as high, moderate or low. For consistency a value of 75 % was recorded for those plots marked high, 50 % for those marked moderate and 25% for those marked low. Plots where the coverage was coded rather than estimated we have included a flag value of 5555 | |
| Sparse_trees_dist | percent | Description of sparse tree distribution. Three patterns were common and are indicated where noted in field notes: Evenly distributed throughout the plot (E), found primarily in the center of the plot (C) and found primarily around the periphery of the plot (P) |
| Open_water | Percent of plot (1/2 acre area) covered in open water. | |
| Open_water_flag | In some plots open water coverage was recorded as an estimated percent in others it was coded as high, moderate or low. For consistency a value of 75 % was recorded for those plots marked high, 50 % for those marked moderate and 25% for those marked low. Plots where the coverage was coded rather than estimated we have included a flag value of 5555 | |
| Open_water_dist | Description of open water distribution. Three patterns were common and are indicated where noted in field notes: Evenly distributed throughout the plot (E), found primarily in the center of the plot (C) and found primarily around the periphery of the plot (P) | |
| Shrubby | percent | Percent of plot (1/2 acre area) covered in shrubs. |
| Shrubby_flag | In some plots shrub coverage was recorded as an estimated percent in others it was coded as high, moderate or low. For consistency a value of 75 % was recorded for those plots marked high, 50 % for those marked moderate and 25% for those marked low. Plots where the coverage was coded rather than estimated we have included a flag value of 5555 | |
| Shrubby_dist | Description of shru distribution. Three patterns were common and are indicated where noted in field notes: Evenly distributed throughout the plot (E), found primarily in the center of the plot (C) and found primarily around the periphery of the plot (P) | |
| Moss | percent | Percent of plot (1/2 acre area) covered in moss. |
| Moss_flag | In some plots moss coverage was recorded as an estimated percent in others it was coded as high, moderate or low. For consistency a value of 75 % was recorded for those plots marked high, 50 % for those marked moderate and 25% for those marked low. Plots where the coverage was coded rather than estimated we have included a flag value of 5555 | |
| Moss_dist | Description of moss distribution. Three patterns were common and are indicated where noted in field notes: Evenly distributed throughout the plot (E), found primarily in the center of the plot (C) and found primarily around the periphery of the plot (P) | |
| Grass_sedge | percent | Percent of plot (1/2 acre area) covered in grass/sedge, based on a visual inspection. |
| Grass_sedge_flag | In some plots grass/sedge coverage was recorded as an estimated percent in others it was coded as high, moderate or low. For consistency a value of 75 % was recorded for those plots marked high, 50 % for those marked moderate and 25% for those marked low. Plots where the coverage was coded rather than estimated we have included a flag value of 5555 | |
| Grass_sedge_dist | Description of grass/sedge distribution. Three patterns were common and are indicated where noted in field notes: Evenly distributed throughout the plot (E), found primarily in the center of the plot (C) and found primarily around the periphery of the plot (P) | |
| Other | percent | Percent of plot (1/2 acre area) covered in other vegetation. Sometimes value is a percent and others is a range (High, Moderate, Low) |
| Other_flag | In some plots coverage of other vegetation was recorded as an estimated percent in others it was coded as high, moderate or low. For consistency a value of 75 % was recorded for those plots marked high, 50 % for those marked moderate and 25% for those marked low. Plots where the coverage was coded rather than estimated we have included a flag value of 5555 | |
| Other_dist | Description of other distribution: E (evenly distributed), C (center only), and P (peripheral) | |
| Other_descr | Description of other vegetation cover | |
| Dominant_spp_1 | genus_species | Scientific name of dominant species ( grasses and sedges not identified to species) |
| Live_ht_spp1 | m | Average height of live dominant species 1 |
| Dead_ht_spp1 | m | Average height of dead dominant species 1 |
| Areal_coverage_spp1 | percent | Percent of area covered by dominant species 1 |
| Percent_live_spp1 | percent | Percent of dominant species 1 live (by area) |
| Percent_dead_spp1 | percent | Percent of dominant species 1 dead (by area) |
| Growth_stage_spp1 | Growth Stage for dominant species 1: dormant, emerging, seedling, immature, mature, flowering | |
| Dominant_spp_2 | Scientific name of second most dominant species ( grasses and sedges not identified to species) | |
| Live_ht_spp2 | m | Average height of live dominant species 2 |
| Dead_ht_spp2 | m | Average height of dead dominant species 2 |
| Areal_coverage_spp2 | percent | Percent of area covered by dominant species 2 |
| Percent_live_spp2 | percent | Percent of dominant species 2 live (by area) |
| Percent_dead_spp2 | percent | Percent of dominant species 1 dead (by area) |
| Stage of Growth | Growth Stage for dominant species 2: dormant, emerging, seedling, immature, mature, flowering | |
| North | North facing photo id number | |
| East | East facing photo id number | |
| South | South facing photo id number | |
| West | West facing photo id number | |
| Nadir | Nadir facing photo id number | |
| Other | ID numbers for other photos from the site | |
| Notes | Comments on photos |
3. Data Application and Derivation:
The goal was to integrate multispectral data, field observations, and modeling to develop high-quality maps that delineate the severity and occurrence of fire disturbance in northern boreal peatlands. The land cover classification maps were integrated with the burn severity maps to answer questions such as do peatlands burn as severely as upland forests.
4. Quality Assessment:
Over 350 field locations were sampled at the five field sites in central Alberta to train and validate the peatland type maps shown below. Overall map accuracy was 97% using a Random Forests classifier. Random Forests is a machine learning algorithm that uses a series of decision trees to classify individual pixels
The total accuracy for Utikuma was 96.0%, Kidney Lake was 92.5%, Wabasca was 88.5%, Fort McMurray East was 94.4%, and Fort McMurray West was 90.7%.
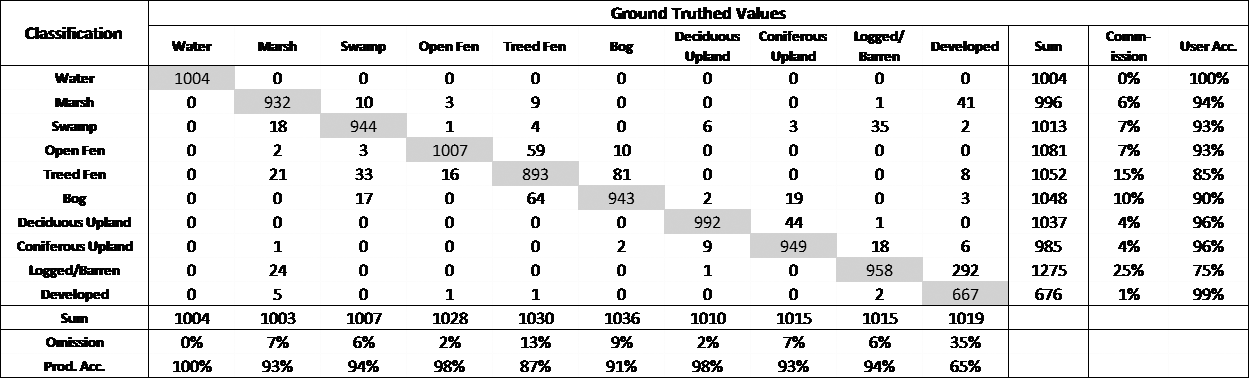
Figure 3. Error matrix of overall map accuracy.
5. Data Acquisition Materials and Methods:
This data set provides landcover maps including peatland type (bog, fen, marsh, swamp) and level of biomass (open, forested) and burn severity maps for four wildfire areas in Alberta, Canada.
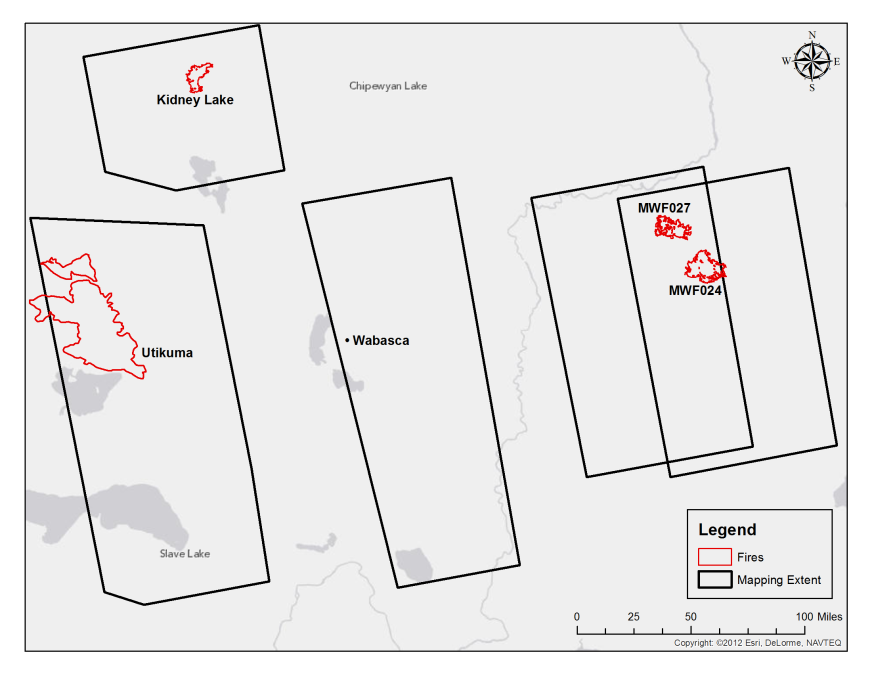
Figure 4. Location map of the four wildfire areas in northern Alberta, Canada (Bourgeau-Chavez et al., 2015).
Peatland Type Mapping (Bourgeau-Chavez et al., 2015)
The peatland classification (fen vs. bog including treed vs. open vs. shrubby) at each site was based on a pre-burn 2007 multi-date, multi-sensor fusion (Optical-IR, C-band and L-band SAR) approach. The Random Forests classifier was used which is a machine learning algorithm that takes advantage of an ensemble of classifiers that are built using training data. It generates a group of independent classification trees and the pixel class is determined by a majority vote of the trees. The training data was created through aerial photo interpretation combined with field data.
Over 350 field locations were sampled in central Alberta to train and validate the peatland type maps. Field points were selected based on map classes. Data collections followed a standardized protocol. Field crews used a hand held GPS, a GPS camera, maps of aerial photographs, and tape measurers. At each location, a vegetative index was constructed; ecosystem type was assigned, species diversity notes, dominant species composition assigned, water level measured, vegetation life stage recorded, and height and density measured for the over story. Additionally, hand drawn maps and delineation of laminated aerial photograph maps distinguished unique vegetation types and species transition areas. Geolocated photographs were taken in the four cardinal directions at a centralized location providing an additional layer of validation and ground truth for each location.
Landsat data were resampled to match the SAR data.
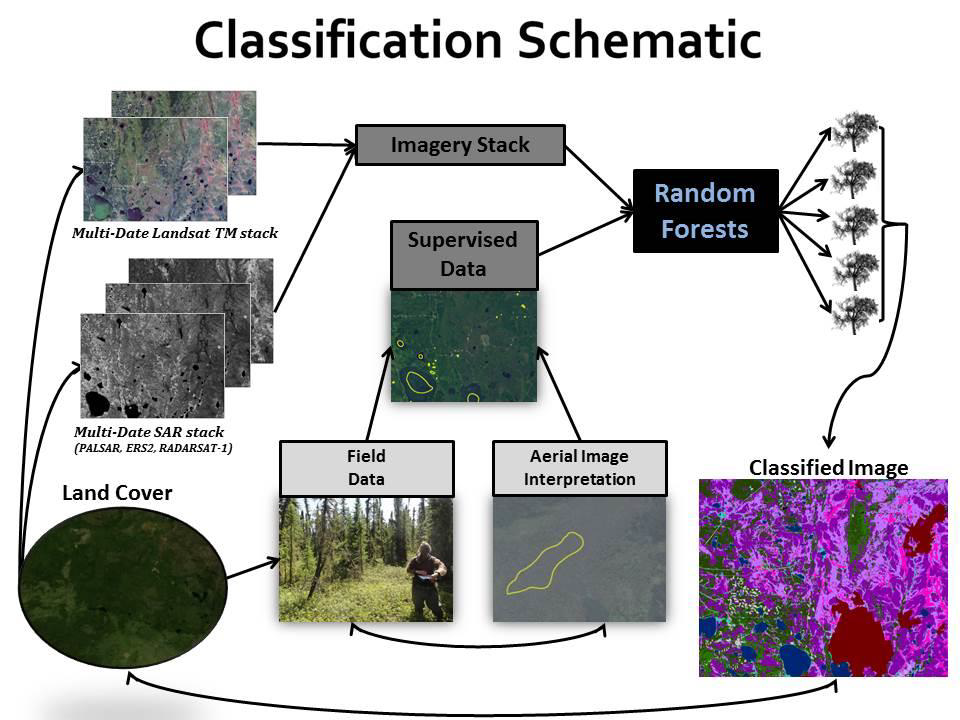

Figure 5. Classification schematic (Bourgeau-Chavez et al., 2015).
Burn Severity Mapping
In the spring of 2011, a 90,000-ha wildfire occurred near Utikuma Lake Alberta consuming large areas of peat. The fire was very patchy with low to moderate burn severity. In 2012, 48 field sites were sampled with intense measurements to understand fuel consumption. In 2013, this site and three additional burn sites, were visited to gather data focused on developing Landsat-based burn severity algorithms. The three additional wildfire burn sites were the Kidney Lake-fire site in 2011, and two sites at Fort McMurray, both had fires in 2009 (MWF027 and MWF024).
Burn severity was measured in the field in 2013 at the four sites using the Burn Severity Index (BSI) (Dyrness and Norum 1983), a qualitative assessment of burnt moss that uses a 1-5 scale. The classes are: 1- unburned moss, 2- singed moss, 3- light burned moss, 4- moderately burned moss, and 5- severely burned moss.
Within a plot the percent area in each of five burn severity classes to the ground layer were qualitatively assessed, then the burn severity index (BSI) was created by summing the fraction of each burn class times the index number (1-5) to create a single BSI value. The field data were correlated with Landsat data to develop multivariate models for calculating burn severity and %-not-sphagnum-moss. These models were used to generate the burn severity maps for the four wildfires.
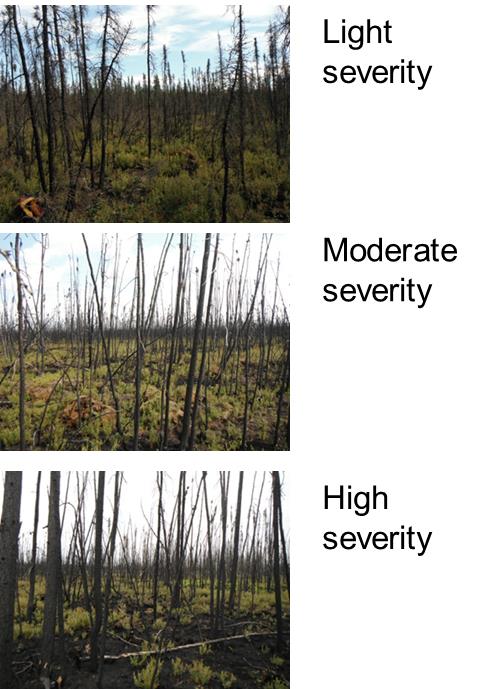
Figure 6. Photos one year post-burn showing examples of light, moderate and high burn severity (Bourgeau-Chavez et al., 2015).
Another variable measured in the field was percent unburned moss, which is typically sphagnum. This metric was also highly correlated to satellite Landsat data as was the reverse (1 - % unburned moss) or area not sphagnum. This is typically what burns, the non-sphagnum mosses.
Various Landsat bands and band combinations were tested to determine the best method for mapping burn severity from remote sensing satellite data. Traditional burn severity metrics (dNBR, rdNBR, tasseled cap greenness, brightness, and wetness) were also evaluated. Multivariate models were developed for each of four metrics determined to represent overall site burn severity-- %-unburned-moss, %-not-sphagnum moss, depth-of-burn, and burn severity index (BSI). Before developing the multivariate models, we conducted uni-variate analysis on individual bands and band combinations.
The models were based on data collected from all four wildfires.
Variable selection for the multivariate models was achieved by examining the uni-variate correlation results, consulting a collinearity matrix to identify which variables were highly correlated with each other, and choosing sets of 4-8 non-collinear variables to evaluate via all-subsets regression (for models containing 2-4 variables). The top
five results (by adj-R2) were examined in detail to find models for which all/most component variables were significant.
The multivariate models for two of the four burn severity metrics tested (%-unburned-moss and depth-of-burn) were unsatisfactory due to low R2 values. The best fit model for BSI (with
adj-R2=0.60) was:
BSI = 72.6 + 504 * diff4:5
The best fit model for %-not-sphagnum-moss (with adj-R2=0.57) was:
%-not-sphag = -7.4 + (73.6 * diff2:7) + (70.6 * diff4:5)
We validated the models generated with the 2013 field data against the 2012 field data
of the Utikuma Lake fire.
From these multivariate models we produced burn severity maps for each fire for each of the two satisfactory burn severity metrics.
6. Data Access:
These data are available through the Oak Ridge National Laboratory (ORNL) Distributed Active Archive Center (DAAC)
Data Archive Center:
Contact for Data Center Access Information:
E-mail: uso@daac.ornl.gov
Telephone: +1 (865) 241-3952
7. References:
Denning, A.S., et al. 2005. Science implementation strategy for the North American Carbon Program: A Report of the NACP Implementation Strategy Group of the U.S. Carbon Cycle Interagency Working Group. U.S. Carbon Cycle Science Program, Washington, DC. 68 pp
Dyrness, C.T. and D.A.Norum. 1983. The effects of experimental fires on black spruce forest floors in interior Alaska. Canadian Journal of Forest Research, 1983, 13(5): 879-893, 10.1139/x83-118.
Laura L. Bourgeau-Chavez, Nancy H.F. French, Eric S. Kasischke, Merritt R. Turetsky, Liza K. Jenkins, Sarah Endres, Elizabeth Banda1, Michael Billmire, and Bill de Groot. 2015. Poster. Vulnerability of North American Boreal Peatlands to Interactions between Climate, Hydrology, and Wildland Fires. Presented at NACP Principle Investigators Meeting 5, Jan 26 - 29, 2015.
Wofsy, S.C., and R.C. Harriss. 2002. The North American Carbon Program (NACP). Report of the NACP Committee of the U.S. Interagency Carbon Cycle Science Program. U.S. Global Change Research Program, Washington, DC. 56 pp.