Documentation Revision Date: 2025-06-20
Dataset Version: 2
Summary
There are 1,797 files in netCDF v4 format with this dataset. Each file contains all time steps of a single variable output from one of five simulations by each model. Note that not all models performed all simulations. MsTMIP defined a list of required/optional variables to be generated by each model. This Version 2 release include model results from two additional models (JPL-CENTURY and JPL-HYLAND) and an ensemble of estimates (including mean and spread) for selected variables across models. No previously released data values have changed.
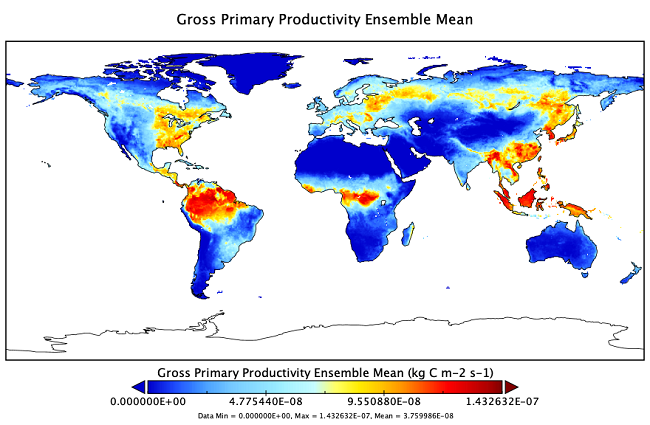
Figure 1. Ensemble mean of global monthly 0.5-degree Gross Primary Productivity (GPP) in July 2010 from the RG1 simulation by 10 TBMs (CLM4, CLM4VIC, DLEM, ISAM, JPL-HYLAND, LPJ-wsl, ORCHIDEE-LSCE, SiBCASA, TEM6, and VEGAS2.1)
Citation
Huntzinger, D.N., C.R. Schwalm, Y. Wei, R. Shrestha, R.B. Cook, A.M. Michalak, K.V.R. Schafer, A.R. Jacobson, M.A. Arain, P. Ciais, B.D. Fisher, H. Kolus, M. Sikka, Y. Elshorbany, D.J. Hayes, M. Huang, S. Huang, A. Ito, A.K. Jain, H. Lei, C. Lu, F. Maignan, J. Mao, N.C. Parazoo, C. Peng, S. Peng, B. Poulter, D.M. Ricciuto, H. Tian, X. Shi, W. Wang, N. Zeng, F. Zhao, Q. Zhu, J. Yang, and B. Tao. 2021. NACP MsTMIP: Global 0.5-degree Model Outputs in Standard Format, Version 2.0. ORNL DAAC, Oak Ridge, Tennessee, USA. https://doi.org/10.3334/ORNLDAAC/1599
Table of Contents
- Dataset Overview
- Data Characteristics
- Application and Derivation
- Quality Assessment
- Data Acquisition, Materials, and Methods
- Data Access
- References
- Dataset Revisions
Dataset Overview
This dataset provides an updated version of global gridded estimates of carbon, energy, and hydrologic fluxes between the land and atmosphere from 17 Terrestrial Biosphere Models (TBMs) in a standard format. Model estimates are at monthly and yearly time steps for the period 1900 to 2010, with a spatial resolution of 0.5 degree x 0.5 degree globally, excluding Antarctica. In addition to estimates from individual models, this dataset also contains an ensemble of estimates (including mean and spread) for selected variables across models. Model ensembles are provided at monthly time steps. The 17 TBMs are models participating in the Multi-scale Synthesis and Terrestrial Model Intercomparison Project (MsTMIP): BIOME-BGC, CLASS-CTEM-N, CLM4, CLM4VIC, DLEM, GTEC, ISAM, JPL-CENTURY, JPL-HYLAND, LPJ-wsl, ORCHIDEE-LSCE, SiB3, SiBCASA, TEM6, TRIPLEX-GHG, VEGAS2.1, and VISIT. The data are provided in Climate & Forecast (CF) convention compatible netCDF version 4 format.
Project: North American Carbon Program (NACP)
The North American Carbon Program (NACP) is a multidisciplinary research program designed to improve understanding of North America's carbon sources, sinks, and stocks. The central objective is to measure and understand the sources and sinks of Carbon Dioxide (CO2), Methane (CH4), and Carbon Monoxide (CO) in North America and adjacent oceans. The NACP is supported by a number of different federal agencies.
The NACP Multi-scale synthesis and Terrestrial Model Intercomparison Project (MsTMIP) is a formal model intercomparison and evaluation effort focused on improving the diagnosis and attribution of carbon exchange at regional and global scales (Huntzinger et al., 2013). The MsTMIP experimental design includes simulations run at two spatial resolutions (0.5 and 0.25-degree) and for two spatial domains (globally and regionally over North America) in order to assess model performance at scales relevant to carbon management and climate change predictions. MsTMIP builds upon current and past synthesis activities, and has a unique framework designed to isolate, interpret, and inform understanding of how model structural differences impact estimates of carbon uptake and release.
Acknowledgements
MsTMIP Phase 1 was funded by NASA's Terrestrial Ecology Program (Grant NNX11AO08A). During Phase 1, data management for MsMTIP was conducted by MAST-DC, with funding from NASA's Terrestrial Ecology Program (grant NNH10AN68I). This is a contribution of the North American Carbon Program.
Related Publication
Huntzinger, D. N., Schwalm, C., Michalak, A. M., Schaefer, K., King, A. W., Wei, Y., Jacobson, A., Liu, S., Cook, R. B., Post, W. M., Berthier, G., Hayes, D., Huang, M., Ito, A., Lei, H., Lu, C., Mao, J., Peng, C. H., Peng, S., Poulter, B., Riccuito, D., Shi, X., Tian, H., Wang, W., Zeng, N., Zhao, F., and Zhu, Q. 2013. The North American Carbon Program Multi-Scale Synthesis and Terrestrial Model Intercomparison Project – Part 1: overview and experimental design. Geoscientific Model Development 6:2121-2133. https://doi.org/10.5194/gmd-6-2121-2013
Related Datasets
Wei, Y., S. Liu, D.N. Huntzinger, A.M. Michalak, N. Viovy, W.M. Post, C.R. Schwalm, K. Schaefer, A.R. Jacobson, C. Lu, H. Tian, D.M. Ricciuto, R.B. Cook, J. Mao, and X. Shi. 2014. NACP MsTMIP: Global and North American Driver Data for Multi-Model Intercomparison. ORNL DAAC, Oak Ridge, Tennessee, USA. http://doi.org/10.3334/ORNLDAAC/1220
Liu, S., Y. Wei, W.M. Post, R.B. Cook, K. Schaefer, and M.M. Thornton. 2014. NACP MsTMIP: Unified North American Soil Map. ORNL DAAC, Oak Ridge, Tennessee, USA. http://doi.org/10.3334/ORNLDAAC/1242
Huntzinger, D.N., C.R. Schwalm, A.M. Michalak, K. Schaefer, Y. Wei, R.B. Cook, and A.R. Jacobson. 2014. NACP MsTMIP Summary of Model Structure and Characteristics. ORNL DAAC, Oak Ridge, Tennessee, USA. http://doi.org/10.3334/ORNLDAAC/1228
Fisher, J.B., M. Sikka, D.N. Huntzinger, C.R. Schwalm, and J. Liu. 2016. CMS: Modeled Net Ecosystem Exchange at 3-hourly Time Steps, 2004-2010. ORNL DAAC, Oak Ridge, Tennessee, USA. http://doi.org/10.3334/ORNLDAAC/131
Data Characteristics
Spatial Coverage: Global (excluding Antarctica)
Spatial Resolution: 0.5 x 0.5 degree
Temporal Coverage: 1900-01-01 to 2010-12-31
Temporal Resolution: Monthly or yearly
Study Area (All latitudes and longitudes are given in decimal degrees.)
| Site | Westernmost Longitude | Easternmost Longitude | Northernmost Latitude | Southernmost Latitude |
|---|---|---|---|---|
| Global | -180.00 | 180.00 | 90.00 | -90.00 |
Data Description
There are 1,797 files in netCDF v4 format with this dataset; one file for each variable per simulation (five simulations) per model (17 models plus model ensemble). Note that not all models performed all simulations. Each file contains global gridded data with 1,320 (for monthly data) or 110 (for yearly data) time intervals from 1901 to 2010. Open water pixels are set to -9999 (treated as fill value).
Data file naming convention:
MODELNAME_SIMULATIONCODE_TIMERESOLUTION_VARIABLENAME.nc4, where:
- MODELNAME is one of the 17 models defined in column “Model Name” of Table 1 or the model ensemble.
- SIMULATIONCODE is one of the 5 simulations, defined in column “Simulation Name” of Table 2.
- TIMERESOLUTION is either “Monthly” or “Annual”.
- VARIABLENAME is one of the 45 variables, defined in column “Variable Name” column of Table 3.
Example file names:
- ENSEMBLE_BG1_Monthly_GPP.nc4
- TEM6_SG3_Monthly_GPP.nc4
- TRIPLEX-GHG_SG2_Annual_CarbPools.nc4
Table 1. MsTMIP Models
| Model Name | Institution | Country |
|---|---|---|
| BIOME-BGC | BIOME-BGC | USA |
| CLASS-CTEM-N | CLASS-CTEM-N | Canada |
| CLM4 | CLM4 | USA |
| CLM4VIC | CLM4VIC | USA |
| DLEM | DLEM | USA |
| GTEC | GTEC | USA |
| ISAM | ISAM | USA |
| JPL-CENTURY | JPL-CENTURY | USA |
| JPL-HYLAND | JPL-HYLAND | USA |
| LPJ-wsl | LPJ-wsl | France |
| ORCHIDEE-LSCE | ORCHIDEE-LSCE | France |
| SiB3 | SiB3 | USA |
| SiBCASA | SiBCASA | USA |
| TEM6 | TEM6 | USA |
| TRIPLEX-GHG | TRIPLEX-GHG | Canada |
| VEGAS2.1 | VEGAS2.1 | USA |
| VISIT | VISIT | Japan; USA |
Table 2. MsTMIP Global Simulations
| Simulation Name | Climate Forcing | Land-Use History | X3 | X4 |
|---|---|---|---|---|
| RG1 | Constant | Constant | Constant | Constant |
| SG1 | CRU+NCEP | Constant | Constant | Constant |
| SG2 | CRU+NCEP | Time-varying | Constant | Constant |
| SG3 | CRU+NCEP | Time-varying | Time-varying | Constant |
| BG1 | CRU+NCEP | Time-varying | Time-varying | Time-varying |
Table 3. MsTMIP Variables
| Variable Name | Long Name | Units | Description |
|---|---|---|---|
| AbvGrndWood | Above ground woody biomass | kg C m-2 | Total above ground wood biomass |
| AutoResp | Autotrophic Respiration | kg C m-2 s-1 | Autotrophic respiration rate |
| CarbPools | Size of each carbon pool | kg C m-2 | Size of each carbon pool |
| CO2air | Near surface CO2 concentration | μmol mol-1 | Near surface dry air CO2 mole fraction |
| Evap | Total Evapotranspiration | kg m-2 s-1 | Sum of all evaporation sources, averaged over a grid cell |
| Fdepth | Frozen Layer Thickness | m | Total freeze depth; depth to zero centigrade isotherm in non-permafrost |
| Fire_flux | Fire emissions | kg C m-2 s-1 | Flux of carbon due to fires |
| fPAR | Absorbed fraction incoming PAR | (-) * | Absorbed fraction incoming photosyntetically active radiation |
| GPP | Gross Primary Productivity | kg C m-2 s-1 | Rate of photosynthesis |
| HeteroResp | Heterotrophic Respiration | kg C m-2 s-1 | Heterotrophic respiration rate |
| LAI | Leaf Area Index | m2 m-2 | Area of leaves per area ground |
| LW_albedo | Longwave Albedo | (-) * | Longwave albedo |
| LWdown | Surface incident longwave radiation | W m-2 | Surface incident longwave radiation |
| Lwnet | Net Longwave Radiation | W m-2 | Incident lonwave radiation minus the simulated outgoing longwave radiation, averaged over a grid cell |
| NEE | Net Ecosystem Exchange | kg C m-2 s-1 | NEE=(HeteroResp+AutoResp) + Disturbance_Emissions + Product_Emissions – GPP |
| NEP | Net Ecosystem Productivity | kg C m-2 s-1 | Net Ecosystem Productivity (NEP=GPP-(HeteroResp+AutoResp)) |
| npool | Number Carbon Pools | (-) * | Total number of carbon pools |
| NPP | Net Primary Productivity | kg C m-2 s-1 | Net Primary Productivity (NPP=GPP-AutoResp) |
| nsoil | Number Soil Layers | (-) * | Total number of soil layers |
| poolname | Name of each Carbon Pool | Name of each carbon pool (i.e., wood, or Coarse Woody Debris) | |
| Psurf | Surface pressure | Pa | Surface pressure |
| Qair | Near surface specific humidity | kg kg-1 | Near surface specific humidity |
| Qh | Sensible heat | W m-2 | Sensible heat flux averaged over a grid cell |
| Qle | Latent heat | W m-2 | Latent heat flux, averaged over a grid cell |
| Qs | Surface runoff | kg m-2 s-1 | Runoff from the land surface and/or subsurface stormflow |
| Qsb | Subsurface runoff | kg m-2 s-1 | Gravity drainage and/or slow response lateral flow. Ground water recharge will have the opposite sign. |
| Rainf | Rainfall rate | kg m-2 s-1 | Rainfall rate |
| SnowDepth | Total snow depth | m | Total snow depth |
| SoilMoist | Average Layer Soil Moisture | kg m-2 | Soil water content in each user-defined soil layer (3D variable). Includes the liquid, vapor and solid phases of water in the soil. |
| SoilTemp | Average Layer Soil Temperature | K | Average soil temperature in each user-defined soil layer (3D variable) |
| SoilWet | Total Soil Wetness | (-) * | Vertically integrated soil moisture divided by maximum allowable soil oisture above wilting point. |
| SW_albedo | Shortwave Albedo | (-) * | Shortwave albedo |
| SWdown | Surface incident shortwave radiation | W m-2 | Surface incident shortwave radiation |
| SWE | Snow Water Equivalent | kg m-2 | Total water mass of snow pack (ice plus liquid water) |
| SWnet | Net shortwave radiation | W m-2 | Incoming solar radiation less the simulated outgoing shortwave radiation, averaged over a grid cell |
| Tair | Near surface air temperature | K | Near surface air temperature |
| Tdepth | Active Layer Thickness | m | Total thaw depth; depth to zero centigrade isotherm in permafrost |
| TotalResp | Total Respiration | kg C m-2 s-1 | Total respiration (TotalResp=AutoResp+HeteroResp) |
| TotLivBiom | Total living biomass | kg C m-2 | Total carbon content of the living biomass (leaves+roots+wood) |
| TotSoilCarb | Total Soil Carbon | kg C m-2 | Total soil and litter carbon content integrated over the entire soil profile |
| Veg | Transpiration | kg m-2 s-1 | Total plant transpiration |
| Wind | Near surface module of the wind | m s-1 | Near surface module of the wind |
| z_bottom | Soil Layer Bottom Depth | m | Depth from soil surface to bottom of soil layer |
| z_node | Soil Layer Node Depth | m | Depth from soil surface to layer prognostic variables; typically center of soil layer |
| z_top | Soil Layer Top Depth | m | Depth from soil surface to top of soil layer |
* (-) is the MsTMIP convention to denote dimensionless variables.
Application and Derivation
The factors that influence the spatial and temporal evolution of carbon sources and sinks vary across the globe. However, the precision, as well as the spatial and temporal resolution, of available driver data varies greatly across regions. This dataset provides modeled data from simulations that used standardized driver datasets.
Quality Assessment
This dataset contains all model results that have undergone basic screening. During screening every effort was made to semantically map original outputs provided by the modeling teams to the required MsTMIP set of variables. In addition to semantic checks, screening also included checks on sign convention, limits (e.g., negative values for GPP), as well as whether model output conforms to the spatiotemporal resolution and simulation protocol of MsTMIP. Screening results are provided in Section 5 of this document.
Inclusion in MsTMIP Version 2 does not imply that the model results themselves are error free; merely that basic thresholds for usability in scientific manuscripts have been met.
Data Acquisition, Materials, and Methods
The model output data provided with this dataset includes carbon, energy, and hydrologic fluxes between the land and atmosphere at monthly and yearly time steps. The models’ results were processed to semantically map original outputs, provided by the modeling teams, to the required MsTMIP set of variables. The screened and processed outputs were then formatted as CF-compliant netCDF files. Refer to Table 1 in Section 2 of this document for additional model information.
Driver Data
To ensure consistent and comparable model results, the models used MsTMIP benchmark reference driver datasets, including standard weather drivers, remotely sensed phenology, biome classification, land-use history, and disturbance for use by all participating modeling teams (Wei et al., 2014; Liu et al., 2014).
Model Screening
MsTMIP defined a list of required/optional variables to be generated by each model.
MsTMIP Version 2 contains all model results that have undergone basic screening. During screening every effort was made to semantically map original outputs provided by the modeling teams to the required MsTMIP set of variables.
Screening also included checks on sign convention, limits (e.g., negative values for GPP), as well as whether model output conformed to the spatiotemporal resolution and simulation protocol of MsTMIP. This screening was performed on a test subset of model variables: AutoResp, Evap, GPP, HeteroResp, NEE, NEP, NPP, TotalResp, and TotLivBiom.
During this process special emphasis was placed on NEE. The MsTMIP protocol defines NEE as: Net Ecosystem Exchange = HeteroResp + AutoResp + Disturbance_Emissions + Product_Emissions - GPP; where Disturbance_Emissions is assumed to include fire flux and land use change emissions. Most models cannot simulate all NEE sub-processes. Similarly, several models cannot simulate all five MsTMIP global simulations. Any deviations from the protocol, e.g., missing NEE sub-process, simulation availability, and/or other issues, are noted below for each model.
Important User Note
It is important to remember that the model results provided in this dataset are not original model outputs from participating models. Rather, outputs have undergone post-processing to match the MsTMIP protocol as much as possible. Steps in that processing are detailed below for each model and include semantic remapping of model outputs. Finally, inclusion in MsTMIP Version 2 does not imply that the model results themselves are error free; merely that basic thresholds for usability in scientific manuscripts have been met.
Screening and Post-Processing Details for Each Model
BIOME-BGC
SG2 and SG3 are not available. For all simulations fixed land cover types are used. For BG1, only constant N deposition is used. For RG1, only 1801 to 1900 are simulated. This time period was mapped to 1901-2010 by using 1801-1810 as 1901-1910 and 1801-1900 as 1911-2010.
Net Ecosystem Exchange = HeteroResp+AutoResp+Fire_flux-GPP; land use change and product emissions are not simulated.
CLASS-CTEM-N
Units do not match protocol for Evap and some large outlying values present in carbon fluxes. All carbon fluxes are capped at 1000 gC m-2 month-1. Values in exceedance of this threshold are set to NA. Barren/vegetated mask excludes high productivity vegetated areas.
Net Ecosystem Exchange = -Net Ecosystem Productivity; disturbance emissions (fire flux and land use change emissions) and product emissions are not simulated.
CLM4
Original NEP has units gC m-2 s-1; NEP was converted to kgC m-2 s-1 during processing.
Net Ecosystem Exchange = HeteroResp+AutoResp+Disturbance_Emissions_(CO2)+Product_Emissions_(CO2)-GPP.,where
Disturbance_Emissions_(CO2) includes fire flux and land use change emissions. Net Ecosystem Exchange also includes hrv_xsmrpool flux (maintenance respiration deficit).
CLM4VIC
Net Ecosystem Exchange = HeteroResp+AutoResp+Disturbance_Emissions_(CO2)+Product_Emissions_(CO2)-GPP, where
Disturbance_Emissions_(CO2) includes fire flux and land use change emissions. Net Ecosystem Exchange also includes hrv_xsmrpool flux (maintenance respiration deficit).
DLEM
DLEM simulates latitudinal bands -88.25 to +88.25 only, the missing bands were infilled as ocean or barren pixels.
The Net Ecosystem Exchange reported does not incorporate all reported simulated subcomponents. It is calculated using mass balance: Net Ecosystem Exchange = HeteroResp+AutoResp-GPP+Proddec+Lulc, where
Proddec is Product_Emissions_(CO2) and Lulc is annual land use change emissions. Lulc is first apportioned equally across all 12 months. DLEM does not simulate fire flux.
GTEC
BG1 is not available. For RG1 only 1900 to 1999 are simulated. This time period was mapped to 1901-2010 by using 1900-1910 as 1901-1910 and 1900-1999 as 1911-2010. Lat 90.75N and Lon: 81.25E is a bad pixel (e.g., GPP c.1 300 gC m-2 month-1 for a tundra pixel). Pixel set to zero for all screened variables.
Net Ecosystem Exchange = HeteroResp+AutoResp+Product_Emissions_(CO2)-GPP; fire flux and land use change emissions are not simulated.
ISAM
HeteroResp flux original units in kgC m-2 week-1; units converted (using an average week/month ratio of 365/12/7) to kgC m-2 s-1 during processing.TotLivBiom (calculated using mass balance: C_leaf+C_rootc+C_rootf+C_stem [the sum of all live carbon pools]) units are kgC m-2 s-1; TotLivBiom is converted to kgC m-2 during processing.
The Net Ecosystem Exchange reported does not incorporate all reported simulated subcomponents. It is calculated using mass balance:
Net Ecosystem Exchange = HeteroResp+AutoResp+Ld-GPP; where Ld is Disturbance_Emissions_(CO2). Ld original units kgC m-2 month-1 are converted to kgC m-2 s-1 for this calculation. Fire flux and product emissions are not simulated.
JPL-CENTURY
None.
JPL-HYLAND
None.
LPJ-wsl
BG1 is not available. A dynamic global vegetation model is used for natural vegetation (as opposed to the prescribed forcing data for land cover/use change), while the crop grid cell fraction is determined by the forcing data.
Net Ecosystem Exchange = HeteroResp+AutoResp+Disturbance_Emissions_(CO2)-GPP; where
Disturbance_Emissions_(CO2) includes both fire flux and land use change emissions. Product emissions are not simulated. Net Ecosystem Exchange also includes grazing emissions.
ORCHIDEE-LSCE
BG1 is not available.
Net Ecosystem Exchange = HeteroResp+AutoResp+Disturbance_Emissions_(CO2)+Product_Emissions_(CO2)-GPP; where
isturbance_Emissions_(CO2) includes only land use change emissions. Fire flux is not simulated.
SiB3
BG1 is not available. SiB3 lacks carbon pools.
Net Ecosystem Exchange = -Net Ecosystem Productivity; disturbance emissions (fire flux and land use change emissions) and product emissions are not simulated.
SiBCASA
BG1 is not available.
Net Ecosystem Exchange = HeteroResp+AutoResp+Disturbance_Emissions_(CO2)-GPP; where
Disturbance_Emissions_(CO2) includes only land use change emissions. Fire flux and product emissions are not simulated.
TEM
RG1/SG1 have a different barren/vegetated mask than BG1/SG2/SG3 in the original model output. To harmonize the barren/vegetated mask for all simulations the BG1 mask is used for RG1/SG1 during processing.
Several model outputs contain bands, linear features, on a North-South axis, with missing or abnormally small values located in either North America (Quebec), South America (Colombia-Brazil-Peru), and/or Africa (longitude 15.25E from 31.75N to 25.75S). These were infilled using nearest neighbor interpolation.
Banded output by simulation: BG1, RG1, SG1, SG3: GPP, HeteroResp, NEE, NPP, SWE, TotLivBiom, TotSoilCarb
SG2: All variables
Net Ecosystem Exchange = HeteroResp+AutoResp+Disturbance_Emissions_(CO2)+Product_Emissions_(CO2)-GPP, where
Disturbance_Emissions_(CO2) includes fire flux and land use change emissions.
TRIPLEX-GHG
SG1 is not available. For all simulations fixed land cover types are used. Original model output saved as one file per variable per month. e.g., a single file contains every month of June from 1901 to 2010 for a given output field. All carbon flux original units in gC m-2 month-1 10000-1; these are converted to kgC m-2 s-1 during processing.
Evap original units in mm day-1; Evap is converted to kg m-2 s-1 during processing.
Net Ecosystem Exchange = -Net Ecosystem Productivity; disturbance emissions (fire flux and land use change emissions) and product emissions are not simulated.
VEGAS2.1
BG1 is not available. The prescribed forcing data for land cover/use change is not used for unmanaged land. Instead a dynamic global vegetation model is used. For managed land, --crop/pasture fraction and wood harvest-- the prescribed forcing data was used.
Net Ecosystem Exchange = HeteroResp+AutoResp+Disturbance_Emissions_(CO2)+Product_Emissions_(CO2)-GPP, where
Disturbance_Emissions_(CO2) includes fire flux and land use change emissions.
VISIT
BG1 is not available. For RG1 and SG1 Net Ecosystem Exchange values are identical. RG1 contains a different set of variables; only GPP, NEE, CarbonPools1-3, and Evap are available.
Net Ecosystem Exchange = -1 * Net Ecosystem Productivity; disturbance emissions (fire flux and land use change emissions) and product emissions are not simulated.
Model Ensembles
For select monthly variables (i.e., GPP, NEE, NEP, NPP, TotalResp, TotLivBiom, and TotSoilCarb) in each of the five simulations, the ensemble mean (e.g., NPP_mean) and standard deviation or spread (e.g., NPP_spread) were calculated across models. Note that since not all models ran all five simulations, produced all variables, nor covered global land areas, the number of models used to calculate the ensemble mean and spread varied across variables, simulations, and grid cells. The VAR_n (e.g., NPP_n) variable in the ensemble NetCDF files provides the number of models used to create ensemble mean and spread on each grid cell. The “source” global attribute in each ensemble NetCDF file lists names of all the models used to create a particular ensemble NetCDF file.
Data Access
These data are available through the Oak Ridge National Laboratory (ORNL) Distributed Active Archive Center (DAAC).
NACP MsTMIP: Global 0.5-degree Model Outputs in Standard Format, Version 2.0
Contact for Data Center Access Information:
- E-mail: uso@daac.ornl.gov
- Telephone: +1 (865) 241-3952
References
Huntzinger, D. N., Schwalm, C., Michalak, A. M., Schaefer, K., King, A. W., Wei, Y., Jacobson, A., Liu, S., Cook, R. B., Post, W. M., Berthier, G., Hayes, D., Huang, M., Ito, A., Lei, H., Lu, C., Mao, J., Peng, C. H., Peng, S., Poulter, B., Riccuito, D., Shi, X., Tian, H., Wang, W., Zeng, N., Zhao, F., and Zhu, Q. 2013. The North American Carbon Program Multi-Scale Synthesis and Terrestrial Model Intercomparison Project – Part 1: overview and experimental design. Geoscientific Model Development 6:2121-2133. https://doi.org/10.5194/gmd-6-2121-2013
Huntzinger, D.N., C.R. Schwalm, A.M. Michalak, K. Schaefer, Y. Wei, R.B. Cook, and A.R. Jacobson. 2014. NACP MsTMIP Summary of Model Structure and Characteristics. ORNL DAAC, Oak Ridge, Tennessee, USA. http://doi.org/10.3334/ORNLDAAC/1228
Fisher, J.B., M. Sikka, D.N. Huntzinger, C.R. Schwalm, and J. Liu. 2016. CMS: Modeled Net Ecosystem Exchange at 3-hourly Time Steps, 2004-2010. ORNL DAAC, Oak Ridge, Tennessee, USA. http://doi.org/10.3334/ORNLDAAC/131
Liu, S., Y. Wei, W.M. Post, R.B. Cook, K. Schaefer, and M.M. Thornton. 2014. NACP MsTMIP: Unified North American Soil Map. ORNL DAAC, Oak Ridge, Tennessee, USA. http://dx.doi.org/10.3334/ORNLDAAC/1242
Wei, Y., S. Liu, D. Huntzinger, A. Michalak, N. Viovy, W. Post, C. Schwalm, K. Schaefer, A. Jacobson, and C. Lu. 2014. The North American Carbon Program Multi-scale Synthesis and Terrestrial Model Intercomparison Project–Part 2: environmental driver data. Geoscientific Model Development 7:2875-2893. https://doi.org/10.5194/gmd-7-2875-2014
Wei, Y., S. Liu, D.N. Huntzinger, A.M. Michalak, N. Viovy, W.M. Post, C.R. Schwalm, K. Schaefer, A.R. Jacobson, C. Lu, H. Tian, D.M. Ricciuto, R.B. Cook, J. Mao, and X. Shi. 2014. NACP MsTMIP: Global and North American Driver Data for Multi-Model Intercomparison. ORNL DAAC, Oak Ridge, Tennessee, USA. http://dx.doi.org/10.3334/ORNLDAAC/1220
Dataset Revisions
|
Version |
Release Date |
Revision Notes |
|
2 |
2025-07-03 |
This release includes model results from two additional models (JPL-CENTURY and JPL-HYLAND) and an ensemble of estimates (including mean and spread) for selected variables across models. The global attributes for all files were edited to remove any persoanally identifiable information (name, contact information, ect.). No previously release data values were altered. |
|
1 |
2018-04-22 |
Data files were updated to include citation information at the request of the authors. The data values were not modified. |
|
0.5 |
2016-06-22 |
Initial release. |