Get Data
Summary:
This data set provides a "bottom-up" CO2 emissions inventory for the mid-continent region of the United States for the year 2007. The study was undertaken as part of the North American Carbon Program (NACP) Mid-Continent Intensive (MCI) campaign.
Emissions for the MCI region were compiled from these resources into nine inventory sources (Table 1):
- forest biomass and soil carbon, harvested woody products carbon, and agricultural soil carbon from the U.S. Greenhouse Gas (GHG) Inventory (EPA, 2010; Heath et al., 2011);
- high resolution data on fossil and biofuel CO2 emissions from Vulcan (Gurney et al,. 2009);
- CO2 uptake by agricultural crops, lateral transport in crop biomass harvest, and livestock CO2 emissions using USDA statistics (West et al., 2011);
- agricultural residue burning (McCarty et al., 2011);
- CO2 emissions from landfills (EPA, 2012);
- and CO2 losses from human respiration using U.S. Census data (West et al., 2009).
The CO2 inventory in the MCI region was dominated by fossil fuel combustion, carbon uptake during crop production, carbon export in biomass (commodities) from the region, and to a lesser extent, carbon sinks in forest growth and incorporation of carbon into timber products.
Figure 1 displays the emissions from agricultural residue burning for the MCI region for the year 2007.
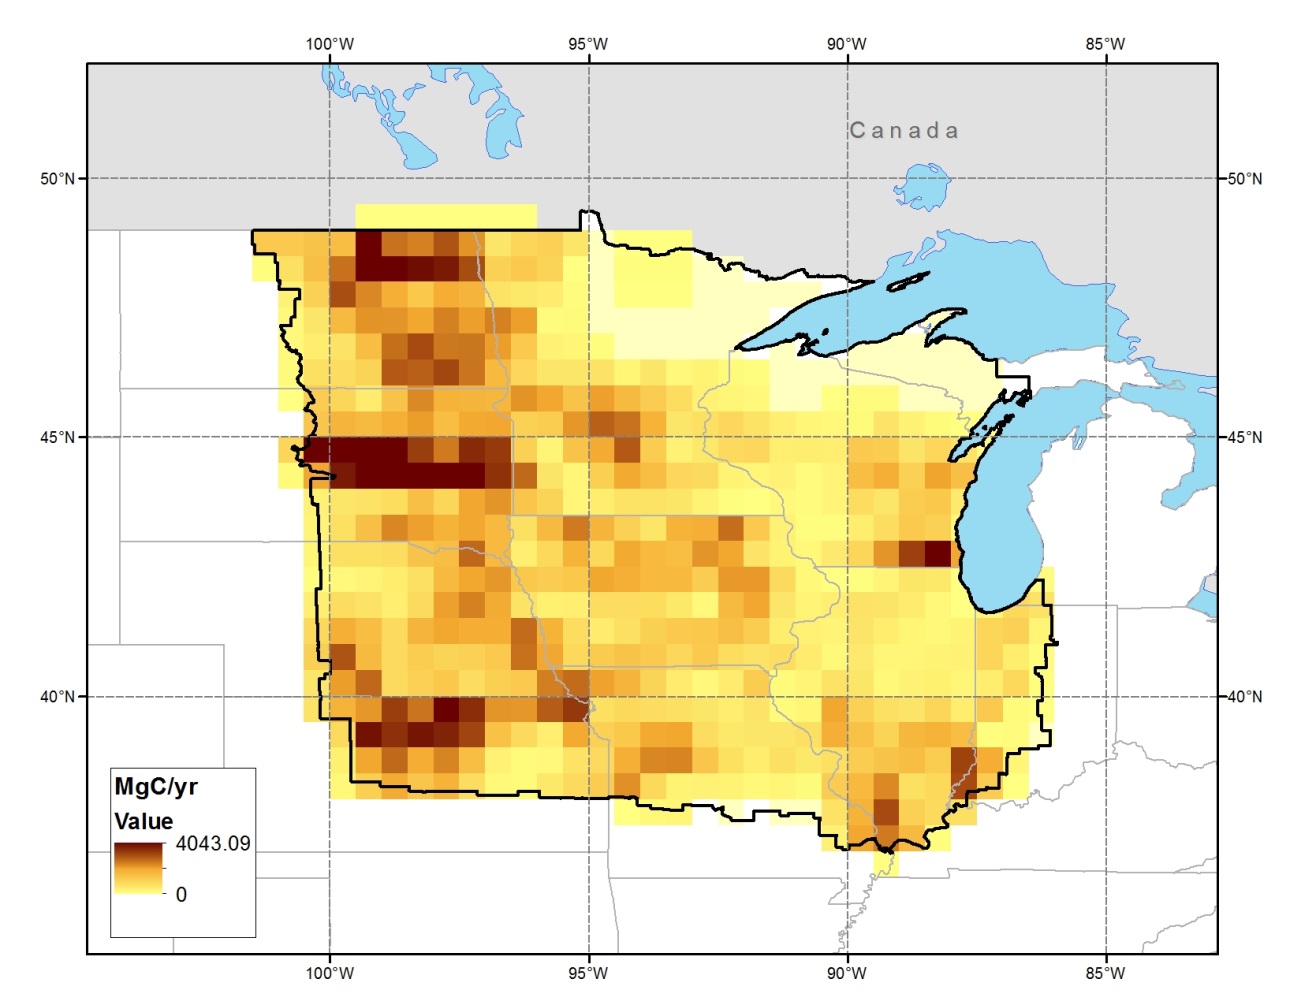
Figure 1. CO2-C emissions from agricultural residue burning for the MCI mid-continent region (bold boundary line) at 0.5 x 0.5-degree resolution for the year 2007.
The CO2 emissions inventory data, as Mg C/year, for the MCI region at 0.5 x 0.5-degree resolution are provided for the nine (9) emission sources in two data file formats:
- Ten space-delimited text format (*.txt) files -- nine files with single source data and one file of all source data, and
- Nine NetCDF version 4 (*.nc4) files with single source data.
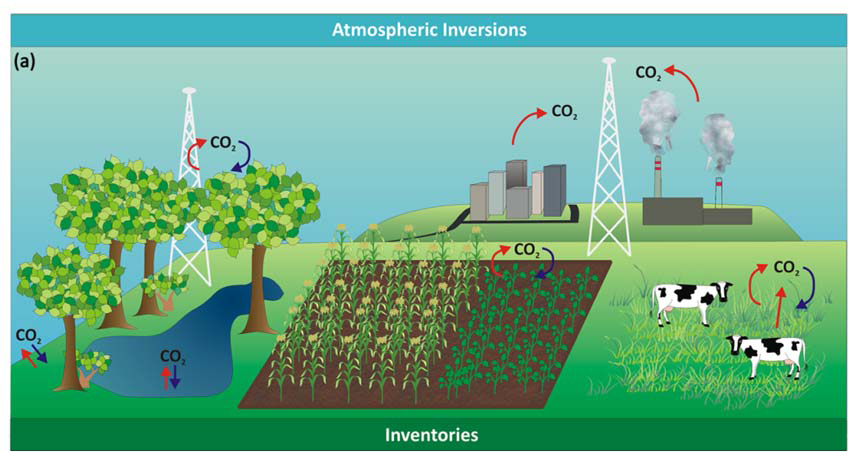
Figure 2 . Sources (red arrows) and sinks (blue arrows) of atmospheric CO2. The NACP MCI was a test-bed for comparing "top-down" (atmospheric inversion) and "bottom-up" (inventory; this data set) methodologies that are used to estimate regional CO2 fluxes. Source: after Ogle et al. 2013.
Data and Documentation Access:
Get Data: http//:daac.ornl.gov/cgi-bin/dsviewer.pl?ds_id=1205
Supplemental Information:
- NetCDF file (*.nc4) header records. File (NACP_MCI_CO2_Inventory_netcdf_headers.pdf) contains copies of the header records of each of the files. All headers have the same structure.
- MCI Region boundary file??
Related Data Products:
- NACP MCI: Tower Atmospheric CO2 Concentrations, Upper Midwest Region, USA, 2007-2009
- NACP MCI: CO2 Flux from Inversion Modeling, Upper Midwest Region, USA., 2007
Data Citation:
Cite this data set as follows:
Ogle, S.M., A.E. Schuh, T.O. West, K.R. Gurney, L.S. Heath, J.L. McCarty, J.E. Smith, F.J. Breidt, and D. Cooley. 2014. NACP MCI: CO2 Emissions Inventory, Upper Midwest Region, USA., 2007. Data set. Available on-line [http://daac.ornl.gov] from Oak Ridge National Laboratory Distributed Active Archive Center, Oak Ridge, Tennessee, USA. http://dx.doi.org/10.3334/ORNLDAAC/1205
Table of Contents:
- 1 Data Set Overview
- 2 Data Description
- 3 Applications and Derivation
- 4 Quality Assessment
- 5 Acquisition Materials and Methods
- 6 Data Access
- 7 References
1. Data Set Overview:
Project: North American Carbon Program (NACP)
The NACP (Denning et al., 2005; Wofsy and Harriss, 2002) is a multidisciplinary research program to obtain scientific understanding of North America's carbon sources and sinks and of changes in carbon stocks needed to meet societal concerns and to provide tools for decision makers. Successful execution of the NACP has required an unprecedented level of coordination among observational, experimental, and modeling efforts regarding terrestrial, oceanic, atmospheric, and human components. The project has relied upon a rich and diverse array of existing observational networks, monitoring sites, and experimental field studies in North America and its adjacent oceans. It is supported by a number of different federal agencies through a variety of intramural and extramural funding mechanisms and award instruments.
Recently, NACP organized several synthesis activities to evaluate and inter-compare biosphere model outputs and observation data at local to continental scales for the time period of 2000 through 2005. The synthesis activities have included three component studies, each conducted on different spatial scales and producing numerous data products: (1) site-level synthesis that examined process-based model estimates and observations at over 30 AmeriFlux and Fluxnet-Canada tower sites across North America; (2) a regional, mid-continent intensive study centered in the agricultural regions of the United States and focused on comparing inventory-based estimates of net carbon exchange with those from atmospheric inversions; and (3) a regional and continental synthesis evaluating model estimates against each other and available inventory-based estimates across North America. A number of other NACP syntheses are underway, including ones focusing on non-CO2 greenhouse gases, the impact of disturbance on carbon exchange, and coastal carbon dynamics. The Oak Ridge National Laboratory (ORNL) Distributed Active Archive Center (DAAC) is the archive for the NACP synthesis data products.
The data sources for this data set are listed in Table 1. The inventory data are provided for each emission source, in a single text (.txt) file (space delimited format).
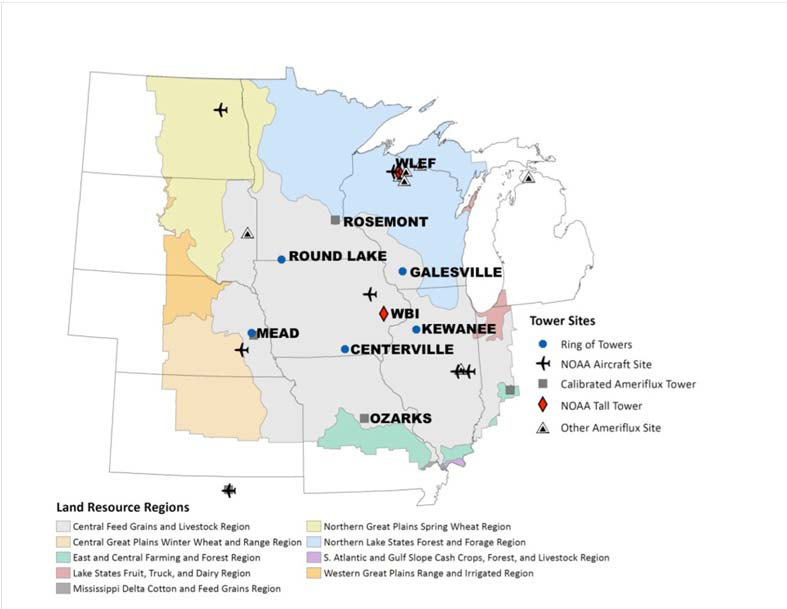
Figure 3. Map of MCI domain located in the U.S. Upper Midwest. Source: Schuh et al. (2013).
Authors:
| Contact | |
|---|---|
| Schuh, Andrew E. | aschuh@kiwi.atmos.colostate.edu |
| West, Tristram O. | tristram.west@pnnl.gov |
| Ogle, Stephen M. | stephen.ogle@colostate.edu |
| Gurney, Kevin R. | kevin.gurney@asu.edu |
| Heath, Linda S. | lheath@fs.fed.us |
| McCarty, Jessica L. | j.mccarty@louisville.edu |
| Breidt, F. Jay | jbreidt@stat.colostate.edu |
| Cooley, Daniel | cooleyd@stat.colostate.edu |
Data Sources
Table 1.CO2 emissions inventory sources
| CO2 Emissions Inventory Sources | References |
|---|---|
| Fossil and biofuel combustion | Gurney et al. (2009) |
| Forest biomass and soil C, and incorporation into harvested woody products | EPA (2010), Heath et al. (2011) |
| Cropland soil organic C stock changes | EPA (2010), Ogle et al. (2010) |
| Grassland soil organic C stock changes | EPA (2010), Ogle et al. ( 2010) |
| Carbon in harvested crop biomass | West et al. 2011, West et al. (2010) |
| CO2 emissions from decomposition of waste in landfills | EPA (2012). See Notes below. |
| Agricultural residue burning | McCarty et al. (2011) |
| Livestock respiration | West et al. (2011) |
| Human respiration | West et al. (2009) |
2. Data Description:
This data set contains a “bottom-up” CO2 emissions inventory for the year 2007 for the MCI region compiled from the data sources shown in Table 1 above. The inventory data are provided for each emission source, in a single text format file.
The CO2 emissions inventory data, as Mg C/year, for the MCI region at 0.5 x 0.5-degree resolution are provided for the nine (9) emission sources in two data file formats:
- Ten space-delimited text format (*.txt) files -- nine files with single source data and one file of all source data, and
- Nine NetCDF version 4 (*.nc4) files with single source data.
2.1. Spatial Coverage
Site: U.S. Upper Midwest
Site Boundaries: (All latitude and longitude given in decimal degrees)
| Site (Region) | Westernmost Longitude | Easternmost Longitude | Northernmost Latitude | Southernmost Latitude |
|---|---|---|---|---|
| U.S. Upper Midwest | -105 | -81 | 50 | 36 |
2.2. Spatial Resolution
Grid Resolution is 0.5 degree (Latitude/Longitude values provided for centroids of grid cells). Spatial Reference System: WGS84 Geographic Lat/lon.
2.3. Temporal Coverage
20070101 - 20071231
2.4. Temporal Resolution
Annual
2.5. Data File Information
The CO2 emissions inventory data are provided for each emission source, as described in Table 1 above.
A Monte Carlo approach of sampling the probability distribution functions (PDFs) for each source and grid cell was used to generate emission values. The result of each of the 100 Monte Carlo iterations is reported for each emission source (except SOILC_GRASS) in a grid cell. That is, for a given source (except SOILC_GRASS) there 100 values for each of the 1,344 grid cells or 134,400 observations.
Text files
There are nine individual source *.txt data files Eight have 100 values for each grid cell (134,400 observations). One file, grassland soil C (SOILC_GRASS), has only one emission estimate provided per grid cell for this minor source, so the file has 1,344 data observations.
The combined source .txt file has 1,076,544 data observations. Note that this file, with over one million observations, will not completely load into MS Excel 2010.
Data Files:
Individual emission sources:
NACPMCIEmissionsInventory_2007_CROPFIRE.txt
NACPMCIEmissionsInventory_2007_FOREST.txt
NACPMCIEmissionsInventory_2007_FOSSIL.txt
NACPMCIEmissionsInventory_2007_HARVEST.txt
NACPMCIEmissionsInventory_2007_HUMANRESP.txt
NACPMCIEmissionsInventory_2007_LANDFILL.txt
NACPMCIEmissionsInventory_2007_LIVESTOCK.txt
NACPMCIEmissionsInventory_2007_SOILC_CROP.txt
NACPMCIEmissionsInventory_2007_SOILC_GRASS.txt
All emission sources:
NACPMCIEmissionsInventory_2007.txt
CO2 Flux Convention:
Note that negative emission estimates represent a net annual uptake of CO2 associated with the emission source, while positive emission estimates represent a net annual release of CO2.
Data File Contents:
All text data files have the same contents in a space-delimited format.
Table 2. Data file column headings and parameter definitions
| COLUMN | COLUMN HEADING | DESCRIPTION | UNITS |
|---|---|---|---|
| 1 | LON | Longitude | Decimal degrees |
| 2 | LAT | Latitude | |
| 3 | C | CO2 flux | Mg CO2-C yr-1 (Positive estimates represent a net release of CO2 into the atmosphere and negative estimates represent a net uptake of CO2 by terrestrial processes) |
| 4 | REALZ | Monte Carlo realization or iteration | Numeric (from 1 to 100) |
| 5 | TYPE | Source of emissions | See Table 3 |
Table 3. Identifiers for sources of emissions in column 5 (TYPE)
| TYPE SOURSE IDENTIFIERS | DESCRIPTION |
|---|---|
| FOSSIL | Fossil and bioenergy combustion |
| FOREST | Forest biomass and soil C stock changes, and harvested wood products |
| HARVEST | Cropland harvested grain |
| HUMANRESP | Human respiration |
| LIVESTOCK | Livestock respiration |
| CROPFIRE | Residue burning |
| LANDFILL | CO2 emissions from decomposition of waste land fills |
| SOILC_CROP | Soil organic C stock changes in cropland |
| SOILC_GRASS | Soil organic C stock changes in grassland |
Sample Data Record
Selected observations from NACPMCIEmissionsInventory_2007_CROPFIRE.txt.
| "LON" "LAT" "C" "REALZ" "TYPE" "-104.75" " "36.25" "0" "1" "CROPFIRE" "-104.75" " 36.75 "0" "1" "CROPFIRE" "-104.75" " 37.25 "0" "1" "CROPFIRE" ... "-91.25" "39.25" "295.369825661637" "43" "CROPFIRE" "-91.25" "39.75" "63.3378726872082" "43" "CROPFIRE" "-91.25" "40.25" "62.1673687893531" "43" "CROPFIRE" … "-81.25" " 46.75" "0" "100" "CROPFIRE" "-81.25" " 47.25" "0" "100" "CROPFIRE" "-81.25" " 47.75" "0" "100" "CROPFIRE" ... |
NetCDF Data Files
There are nine NetCDF version 4 format (*.nc4) files with data for a single source.
Individual emission sources:
NACPMCIEmissionsInventory_2007_CROPFIRE.nc4
NACPMCIEmissionsInventory_2007_FOREST.nc4
NACPMCIEmissionsInventory_2007_FOSSIL.nc4
NACPMCIEmissionsInventory_2007_HARVEST.nc4
NACPMCIEmissionsInventory_2007_HUMANRESP.nc4
NACPMCIEmissionsInventory_2007_LANDFILL.nc4
NACPMCIEmissionsInventory_2007_LIVESTOCK.nc4
NACPMCIEmissionsInventory_2007_SOILC_CROP.nc4
NACPMCIEmissionsInventory_2007_SOILC_GRASS.nc4
Data File Contents:
NetCDF file headers: All headers have the same structure. Details of each file header can be found in companion file NACPMCIEmissionsInventory_2007_NetCDF_Headers.pdf.
The CROPFIRE through SOILC_CROP source files have values for 100 “realizations” per grid cell while the SOILC_GRASS source has just one (1) “realization” per cell.
Sample Data Records:
|
{ dimensions: realz = UNLIMITED ; // (100 currently) lon = 48 ; lat = 28 ; variables: int realz(realz) ; realz:long_name = "realization" ; double lon(lon) ; lon:long_name = "longitude coordinate" ; lon:standard_name = "longitude" ; lon:units = "degrees_east" ; double lat(lat) ; lat:long_name = "latitude coordinate" ; lat:standard_name = "latitude" ; lat:units = "degrees_north" ; double C(realz, lat, lon) ; C:long_name = "CO2-C flux from residue burning" ; C:coordinates = "lon lat" ; C:units = "MgC/yr" ; C:missing_value = -999. ; C:_FillValue = -999. ; // global attributes: :Conventions = "CF-1.0" ; } |
3. Data Application and Derivation:
This data product contributes to a multidisciplinary research program to obtain scientific understanding of North America's carbon sources and sinks and of changes in carbon stocks needed to meet societal concerns and to provide tools for decision makers.
The inventory was compiled from a variety of sources (Table 1.). The data contribute to an effort to resolve net CO2 exchange in the Mid-Continent Region of North America by comparing and reconciling results from "top-down" inverse modeling and "bottom-up" inventory-based approaches.
4. Quality Assessment:
According to the CO2 inventory data for the year 2007 compiled for this study, net CO2 emissions in the MCI region were dominated by fossil fuel combustion, carbon uptake during crop production and export of biomass C in commodities from the region, and to a lesser extent from forest growth and incorporation of carbon into timber products. At the scale of the entire MCI region, the total CO2 flux that was estimated in the emissions inventory agreed well with atmospheric inversion CO2 fluxes. The uncertainty in total regional flux was reduced by more than 20% by reconciling the individual CO2 flux estimates from the emissions inventory with the atmospheric measurements and inversion modeling into a single estimate (Cooley et al., 2013).
NOTE: CO2 emissions from fossil fuel combustion were integrated directly into the inversion modeling framework and so the comparisons were made between the inversion and inventory based on the non-fossil fuel emission sources.
5. Data Acquisition Materials and Methods:
Mid-Continent Intensive Region. The U.S. upper Midwest (Figure 3) was the region selected for the MCI because of its uncomplicated terrain and because the dominant crop ecosystems are extensively documented. The region is primarily agricultural, with cropland and grassland being the dominant vegetation types, but has forest cover in the southern and especially northern portions of the region (U.S. Geological Survey Land Cover Institute, 2010; see http://landcover.usgs.gov). Corn and soybeans are the dominant crops; in Iowa, the area planted with these crops is 52% and 41% of the total agricultural area, respectively (U.S. Department of Agriculture, National Agricultural Statistics Service (USDA, NASS), 2010).
CO2 Emissions Inventory. The “bottom-up” CO2 emissions inventory was compiled from data on forest biomass and soil C, harvested woody products, and agricultural soil C from the U.S. GHG Inventory (EPA, 2010); high resolution data on fossil and biofuel CO2 emissions from Vulcan (Gurney et al,. 2009); CO2 uptake by agricultural crops, lateral transport in crop biomass harvest, and livestock CO2 emissions using USDA statistics (West et al., 2011); agricultural residue burning (McCarty et al., 2011); CO2 emissions from landfills (EPA, 2012); and CO2 losses from human respiration using U.S. Census data (West et al., 2009). Information about each of the emission sources (methods and results) can be found in the references cited for each source.
Emissions Estimates and Uncertainty. Uncertainty for emission estimates was derived from a Monte Carlo analysis in which probability distribution functions were developed for the flux estimates from each of the sources and random draws were made to produce 100 realizations of the total flux in the grid cell. The carbon inventory was constructed on an annual time frame, due to temporal limitations in the FIA and harvest statistics, and was derived from spatial data with a US county level resolution. For example, US counties in Iowa are very homogenous in size and shape and have a resolution of approximately 40-km by 40-km and thus the county sizes are comparable to the 0.5 by 0.5-degree resolution grid cells used to display the inventory (Schuh et al., 2013).
6. Data Access:
This data set is available through the Oak Ridge National Laboratory (ORNL) Distributed Active Archive Center (DAAC).
Data Archive Center:
Contact for Data Center Access Information:
E-mail: uso@daac.ornl.gov
Telephone: +1 (865) 241-3952
7. References:
Cooley, D., F.J. Breidt, S.M. Ogle, A. Schuh, and T. Lauvaux. 2013. A constrained least-squares approach to combine bottom-up and top-down CO2 flux estimates. Environmental and Ecological Statistics 20: 129-146. doi:10.1007/s10651-012-0211-6
Denning, A.S., et al. 2005. Science implementation strategy for the North American Carbon Program: A Report of the NACP Implementation Strategy Group of the U.S. Carbon Cycle Interagency Working Group. U.S. Carbon Cycle Science Program, Washington, DC. 68 pp.
Gurney, K.R., D.L. Mendoza, Y. Zhou, M.L. Fischer, C.C Miller, S. Geethakumar, and S. de la Rue du Can. 2009. High resolution fossil fuel combustion CO2 emissions fluxes for the United States. Environmental Science and Technology 43(14): 5535-5541. doi:10.1021/es900806c
Heath, L.S., J.E. Smith, K.E. Skog, D.J. Nowak, and C.W. Woodall. 2011. Managed forest carbon estimates for the U.S. Greenhouse Gas Inventory, 1990-2008. Journal of Forestry 109(3): 167-173.
McCarty, J.L. 2011. Remote-sensing based estimates of annual and seasonal emissions from crop residue burning in the contiguous United States. Journal of the Air and Waste Management Association 61(1): 22-34. doi:10.3155/1047-3289.61.1.22
Ogle, S.M., and A.E. Schuh. 2013. Mid-Continent Intensive Campaign Archive Data: CO2 Emissions Inventory. Supporting Information for NASA NACP Project: Resolving Net CO2 Exchange in the Mid-Continent Region of North America by Comparing and Reconciling Results from Inverse Modeling and Inventory-Based Approaches. Colorado State University, Fort Collins, CO. 7 pp.
Ogle, S.M., F.J. Breidt, M. Easter, S. Williams, K. Killian, and K. Paustian. 2010. Scale and uncertainty in modeled soil organic carbon stock changes for US croplands using a process-based model. Global Change Biology 16(2): 810-820. doi:10.1111/j.1365-2486.2009.01951.x
Pipatti, R., and P. Svardal. 2006. Solid Waste Disposal, Volume 5, Chapter 3. In: Eggelston, S., L. Buendia, K. Miwa, T. Ngara, and K.. Tanabe (eds.). 2006 IPCC Guidelines for National Greenhouse Gas Inventories. Institute for Global Environmental Strategies, Hayama, Japan. 44 pp.
U.S. Department of Agriculture, National Agricultural Statistics Service (USDA, NASS). 2010. Quick Stats Database [http://www.nass.usda.gov/Quick_Stats/]. Washington, D.C.
U.S. Environmental Protection Agency (U.S. EPA). 2010. Inventory of U.S. Greenhouse Gas Emissions and Sinks: 1990-2008. EPA 430-R-10- 006. U.S. Environmental Protection Agency, Office of Atmospheric Programs, Washington, D.C. 407 pp.
U.S. Environmental Protection Agency (U.S. EPA). 2012. Landfill Methane Outreach Program-Landfill and Project Database. United States Environmental Protection Agency, Washington D.C.
West, T.O., V. Bandaru, C.C. Brandt, A.E. Schuh, and S.M. Ogle. 2011. Regional uptake and release of crop carbon in the United States. Biogeosciences 8: 2037-2046. doi:10.5194/bgd-8-631-2011
West, T.O., C.C. Brandt, L.M. Baskaran, C.M. Hellwinckel, R. Mueller, C.J. Bernacchi, V. Bandaru, B. Yang, B.S. Wilson, G. Marland, R.G. Nelson, D.G. De la Torre Ugarte, and W.M. Post. 2010. Cropland carbon fluxes in the United States: increasing geospatial resolution of inventory-based carbon accounting. Ecological Applications 20(4): 1074-1086. doi:10.1890/08-2352.1
West, T.O., G. Marland, N. Singh, B.L. Bhaduri, and A.B. Roddy. 2009. The human carbon budget: an estimate of the spatial distribution of metabolic carbon consumption and release in the United States. Biogeochemistry 94: 29-41. doi:10.1007/s10533-009-9306-z
Wofsy, S.C., and R.C. Harriss. 2002. The North American Carbon Program (NACP). Report of the NACP Committee of the U.S. Interagency Carbon Cycle Science Program. U.S. Global Change Research Program, Washington, DC. 56 pp.
Additional Sources of Information:
Lauvaux, T., A.E. Schuh, M. Uliasz, S. Richardson, N. Miles, A E. Andrews, C. Sweeney, L.I. Diaz, D. Martins, P.B. Shepson, and K.J. Davis. 2012. Constraining the CO2 budget of the corn belt: exploring uncertainties from the assumptions in a mesoscale inverse system. Atmos. Chem. Phys. 12: 337–354. doi:10.5194/acp-12-337-2012
Miles, N.L., S.J. Richardson, K.J. Davis, T. Lauvaux, A.E. Andrews, T.O. West, V. Bandaru, and E. R. Crosson. 2012. Large amplitude spatial and temporal gradients in atmospheric boundary layer CO2 mole fractions detected with a tower-based network in the U.S. upper Midwest. J. Geophys. Res. 117: G01019. doi:10.1029/2011JG001781
Schuh, A.E., T. Lauvaux, T.O. West, A.S. Denning, K.J. Davis, N. Miles , S. Richardson, M. Uliasz , E. Lokupitiya, D. Cooley, A. Andrews, and S. Ogle. 2013. Evaluating atmospheric CO2 inversions at multiple scales over a highly inventoried agricultural landscape. Global Change Biology 19: 1424-1439. doi: 10.1111/gcb.12141
U.S. Environmental Protection Agency (U.S. EPA). 2001. Solid waste management and greenhouse gases—a life-cycle assessment of emissions and sinks. EPA530-R-02-006, United States Environmental Protection Agency, Washington D.C.