Documentation Revision Date: 2022-03-21
Dataset Version: 1
Summary
There are three data files in GeoTIFF (*.tif) format included in this dataset.
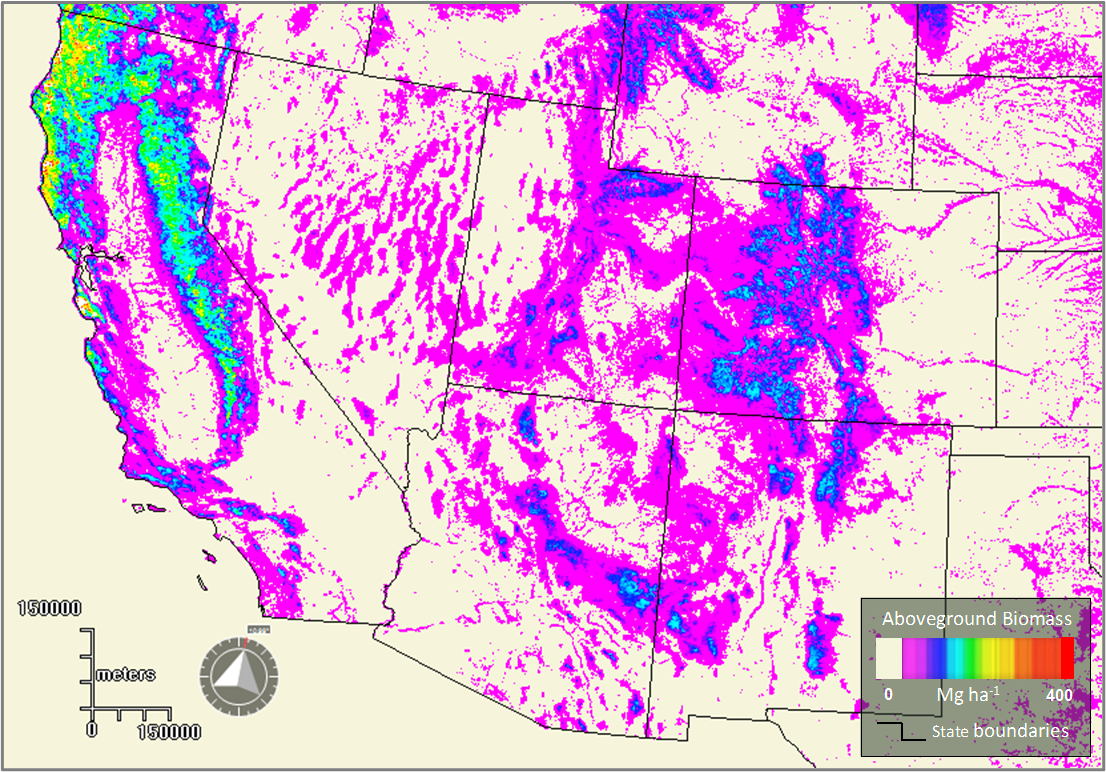
Figure 1. Generalized 2005 aboveground biomass (AGB) map for the southwestern U.S, derived from the Multiangle Imaging Spectro-Radiometer (MISR).
Citation
Chopping, M.J., Z. Wang, C. Schaaf, M.A. Bull, and R.R. Duchesne. 2022. Forest Aboveground Biomass for the Southwestern U.S. from MISR, 2000-2021. ORNL DAAC, Oak Ridge, Tennessee, USA. https://doi.org/10.3334/ORNLDAAC/1978
Table of Contents
- Dataset Overview
- Data Characteristics
- Application and Derivation
- Quality Assessment
- Data Acquisition, Materials, and Methods
- Data Access
- References
Dataset Overview
This dataset provides estimates of forest AGB (Mg ha-1) at a resolution of 250 m for the southwestern United States over the time period 2000–2021. The AGB estimates were derived from the Jet Propulsion Laboratory Multiangle Imaging Spectro-Radiometer (MISR) Level 1B2 Terrain radiance data and a multi-angle approach that exploits the relationship between forest AGB and a suite of red band reflectance values modeled at different viewing angles with respect to the direction of illumination. The year 2000 National Biomass and Carbon Dataset (NBCD 2000) AGB estimates were used to fit a model coefficient for the MISR-derived AGB estimates for the year 2000, with AGB estimates for all subsequent years dependent on both this coefficient and MISR red band bidirectional reflectance factors (BRFs). Quality assurance (QA) files are also provided that allow users to impose criteria of varying stringency. The BRDF model-fitting RMSE value was used as one of the criteria to determine if the AGB estimates were reasonable. This dataset is the first example of forest AGB estimation based on a multi-angle index applied using MISR data.
Project: North American Carbon Program
The North American Carbon Program (NACP) is a multidisciplinary research program designed to improve understanding of North America's carbon sources, sinks, and stocks. The central objective is to measure and understand the sources and sinks of Carbon Dioxide (CO2), Methane (CH4), and Carbon Monoxide (CO) in North America and adjacent oceans. The NACP is supported by a number of different federal agencies.
Related Publication
Chopping, M., Z. Wang, M. Bull, C. Schaaf, M.A. Bull, and R. Duchesne. 2022. Forest aboveground biomass in the Southwestern U.S. from a MISR multi-angle index, 2000–2015. Remote Sensing of Environment 274C. https://doi.org/10.1016/j.rse.2009.05.017
Related Datasets
Berner, L.T., B.E. Law, A.J. Meddens, and J.A. Hicke. 2019. Tree Mortality from Fires and Bark Beetles at 1-km Resolution, Western USA, 2003-2012. ORNL DAAC, Oak Ridge, Tennessee, USA. https://doi.org/10.3334/ORNLDAAC/1512
Hagen, S., N. Harris, S.S. Saatchi, T. Pearson, C.W. Woodall, S. Ganguly, G.M. Domke, B.H. Braswell, B.F. Walters, J.C. Jenkins, S. Brown, W.A. Salas, A. Fore, Y. Yu, R.R. Nemani, C. Ipsan, and K.R. Brown. 2016. CMS: Forest Carbon Stocks, Emissions, and Net Flux for the Conterminous US: 2005-2010. ORNL DAAC, Oak Ridge, Tennessee, USA. https://doi.org/10.3334/ORNLDAAC/1313
Kellndorfer, J., W. Walker, K. Kirsch, G. Fiske, J. Bishop, L. Lapoint, M. Hoppus, and J. Westfall. 2013. NACP Aboveground Biomass and Carbon Baseline Data, V.2 (NBCD 2000), U.S.A., 2000. ORNL DAAC, Oak Ridge, Tennessee, USA. https://doi.org/10.3334/ORNLDAAC/1161
Xu, Q., A. Man, M.M. Fredrickson, Z. Hou, J. Pitkanen, B. Wing, C. Ramirez, B. Li, and J. Greenberg. 2018. LiDAR-Derived Aboveground Biomass and Uncertainty for California Forests, 2005-2014. ORNL DAAC, Oak Ridge, Tennessee, USA. https://doi.org/10.3334/ORNLDAAC/1537
Acknowledgments
This work was supported by NASA, JPL (grants 1365499 and 1552327) for the project “Forest and Shrub Mapping with MISR” and NASA ROSES NNH09ZDA001N-TERRAQUA (grant NNX11AF90G). The MISR data were obtained from the NASA Langley Research Center Atmospheric Science Data Center. Xiaohong Chopping provided informed comments and suggestions. Sassan Saatchi (NASA, JPL) provided advice on the CMS GLAS dataset. Jonathan Greenberg (University of Nevada, Reno) provided advice on the CMS aerial lidar-based dataset.
Data Characteristics
Spatial Coverage: Southwestern U.S. (Arizona, California, Colorado, Nevada, New Mexico, Utah, parts of Wyoming and West Texas)
Spatial Resolution: 250 meters
Temporal Coverage: 2000-05-15 to 2021-06-30
Temporal Resolution: Annual
Study Area: Latitude and longitude are given in decimal degrees.
| Site | Northernmost Latitude | Southernmost Latitude | Easternmost Longitude | Westernmost Longitude |
|---|---|---|---|---|
| Southwestern U.S. | 46.281 | 28.599 | -99.019 | -126.180 |
Data File Information
There are three data files in GeoTIFF (*.tif) format included in this dataset.
Table 1. File names and descriptions.
| File Names | Number of Bands | Description |
|---|---|---|
| MISR_agb_estimates_20002021.tif | 22 | Estimates of forest AGB (live, dry) per year; Band 1 corresponds to the year 2000, Band 2 corresponds to the year 2001, and Band 22 corresponds to the year 2021; see Table 2 for an explanation of cell values |
| MISR_qa_codes_20002021.tif | 22 | QA codes for each AGB estimate per year; Band 1 corresponds to the year 2000, Band 2 corresponds to the year 2001, and Band 22 corresponds to the year 2021; see Table 3 for an explanation of cell values |
| MISR_qa_passed.tif | 1 | Number of AGB estimates passing all tests; see Table 4 for an explanation of cell values |
Data File Details
- Forest aboveground biomass (AGB) is in units of Mg ha-1.
- The data type for MISR_agb_estimates_20002021.tif is a signed 16-bit integer. Other files use the unsigned 8-bit integer data type.
- Each file contains 6648 rows and 8501 columns.
- The Coordinate Reference System is “Albers Equal Area (Conic)” (EPSG:9822); +proj= aea +lat_1= 29.5 +lat_2= 45.5 +lat_0= 23 +lon_0= -96 +x_0= 0 +y_0= 0 +datum= WGS84 +units= m +no_defs
Table 2. Value descriptions for the file MISR_agb_estimates_20002021.tif.
| Value | Description |
|---|---|
| -1 | No data were available or the values were out of bounds. |
| 0 | Data were available, and the AGB estimate was 0. |
| >0 | Data were available, and the AGB estimate was >0. |
Table 3. Value descriptions for the file MISR_qa_codes_20002021.tif. Details of the QA criteria are provided in Section 4.
| Value | Description |
|---|---|
| 0 | For cells where data were available (i.e., values ≥0 in MISR_agb_estimates_20002021.tif), the AGB estimate for the year 2000 failed to meet the QA criteria so all AGB estimates for all years at that cell are suspect. |
| 1 | For cells where data were available, the AGB estimate for the given year met the QA criteria. |
| 2 | An estimate is missing for the given year. |
| 3 | For cells where data were available, the AGB estimate for the given year met the BRDF model-fitting RMSE criteria (i.e., ≥0.008). |
| 4 | For cells where data were available, the AGB estimate for the given year was much greater than the AGB estimate for the year 2000 (i.e., >AGB2000+100). |
Table 4. Value descriptions for the file MISR_qa_passed.tif.
| Value | Description |
|---|---|
| 0 | The number of years (across the 22 year period) that passed all QA criteria is 0. |
| >0 | The number of years (across the 22 year period) that passed all QA criteria is >0. |
Application and Derivation
This dataset is the first example of forest AGB estimation based on a multi-angle index applied using MISR data. The map time series spans two decades, providing a history for each location that may include carbon losses from disturbance (fire, insect, pathogen, or harvest) or carbon sequestration (i.e., growth).
Quality Assessment
The 2005 MISR-derived AGB map for the entire southwestern U.S. was spatially consistent with the 2005 Ice, Cloud, and land Elevation (ICESat)/Geoscience Laser Altimeter System (GLAS) AGB map trained with USFS Forest Inventory Analysis (FIA) data (Harris et al. 2016). For the mapped areas (11,019,944 cells), this yielded an R2 of 0.90 and an RMSE of 37 Mg ha-1. These error values were derived using results that only excluded instances with missing data or RMSE values ≥0.02; it did not impose the more stringent criteria developed for QA in this distribution that would have excluded estimates contaminated by snow.
AGB trajectories were reasonably stable through time for undisturbed locations, and areas of forest loss from fire and beetle disturbance matched historical data in published sources (Berner et al., 2017a, 2019; Walters et al., 2011). Trajectory estimates that represented important excursions from the expected range most often resulted from snow cover (depressing the AGB estimate), although unreasonably large estimates also appeared. Therefore, QA files were created to allow users to impose criteria of varying stringency.
QA Criteria
The file MISR_qa_codes_20002021.tif provides QA codes for each AGB estimate for the time period 2000–2021, with bands 1–22 corresponding to each year in the 22 year period (Table 3). The bidirectional reflectance distribution function (BRDF) model-fitting root mean square error (RMSE) value was used as one of the criteria to determine if the AGB estimates were reasonable. Since all estimates depend on the model fit to the NBCD 2000 data, if the AGB estimate for 2000 (i.e., AGB2000) had a BRDF model-fitting RMSE≥0.008 or was missing, the corresponding cell in all QA layers (i.e., for the entire time period) was assigned the value "0", even though some yearly AGB estimates might appear reasonable. If an AGB estimate is available for a given year, the corresponding QA layer was assigned the value "1"; if no AGB estimate is available, it was assigned the value "2". If an AGB estimate for a given year had a BRDF model-fitting RMSE≥0.008, the QA layer was assigned the value "3". Lastly, if a cell's AGB estimate for a given year was greater than AGB2000+100, the QA layer was assigned the value "4". This is unlikely for most locations as the annual AGB growth rate is generally less than 5 Mg ha-1 yr-1 for dry locations (Berner et al., 2017b) but it is possible for wetter ones, or sequoia (Sillett et al., 2019).
The file MISR_qa_passed.tif provides the number of AGB estimates across the 22 year period that passed all criteria (Table 4). The MISR AGB predictions will be invalid for locations where data for the year 2000 are missing (i.e., the beige areas over land in Fig. 2) and this is propagated through the predictions for all years; however, these locations do not include forested lands.
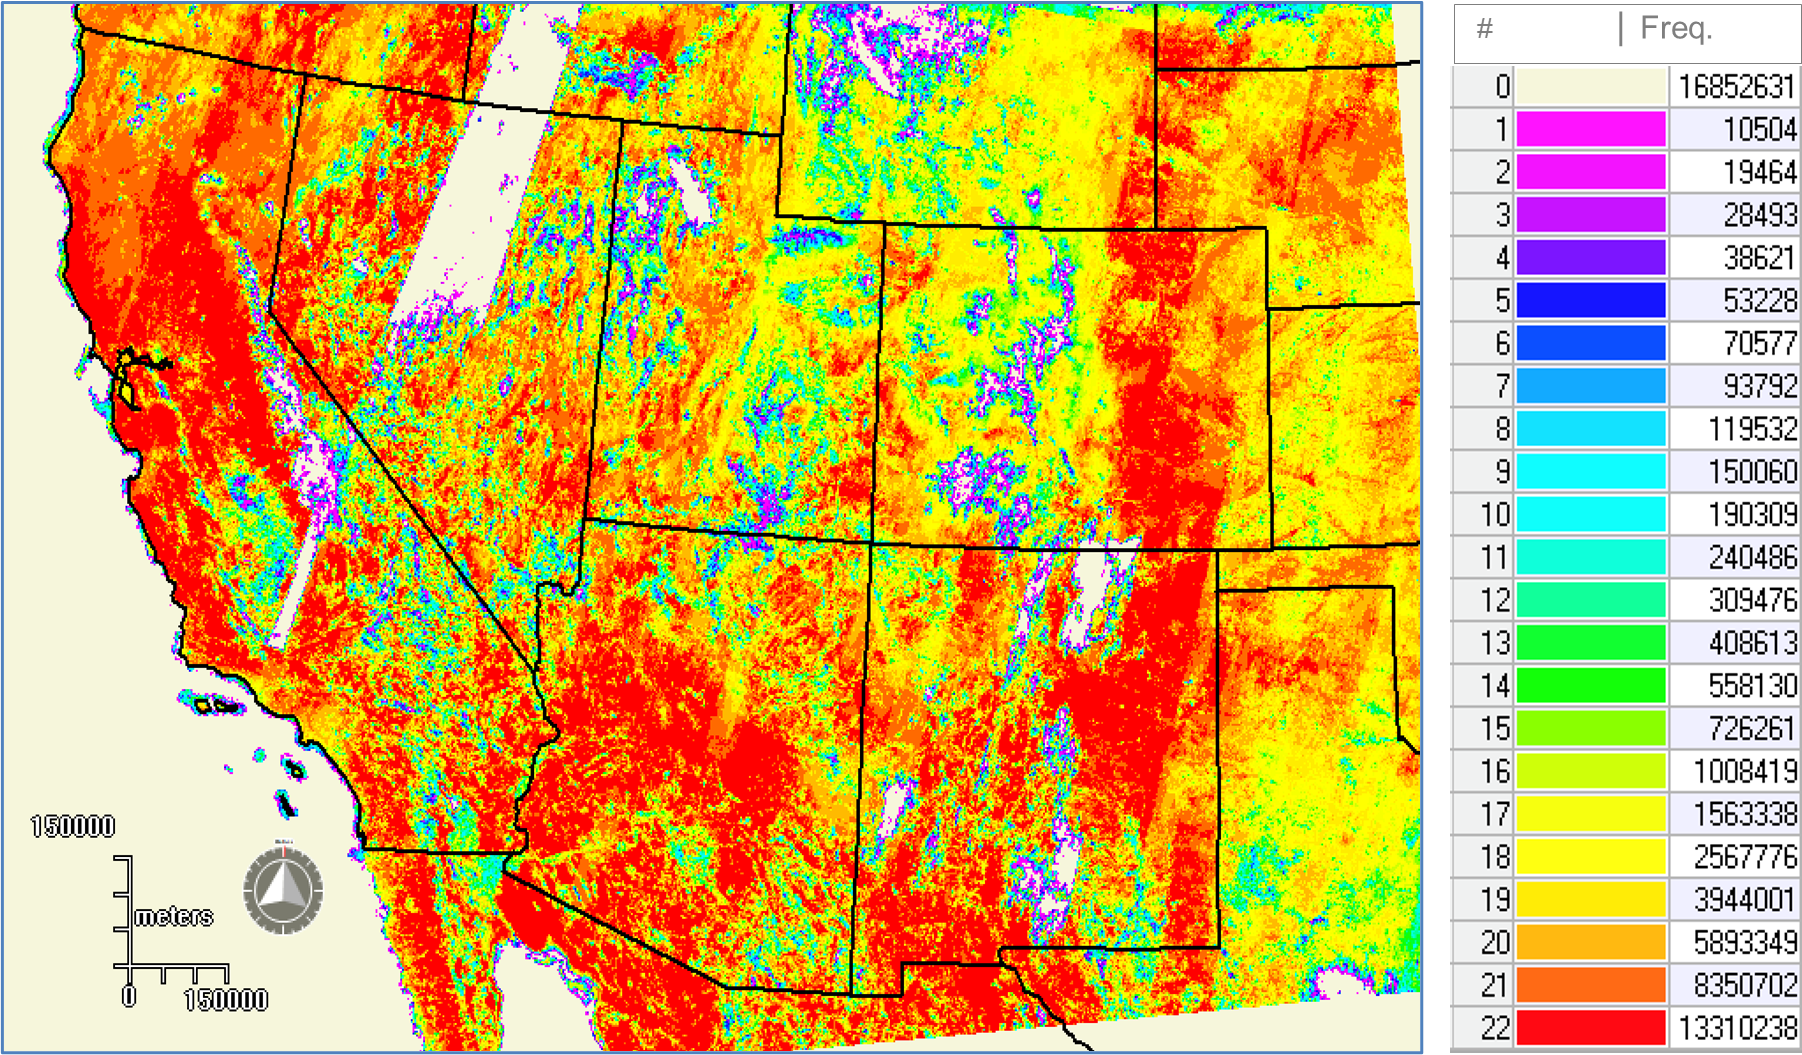
Figure 2. Number of AGB estimates in the 2000–2021 time period that passed all QA criteria. Source: MISR_qa_passed.tif
Data Acquisition, Materials, and Methods
Overview
This dataset provides forest AGB (Mg ha-1) for the southwestern U.S. annually for the period 2000–2021. The extent of the study area was approximately 3,035,346 km2 and includes upland forest, desert grassland with significant woody shrub encroachment, and riparian woodlands.
The primary data were collected using the Jet Propulsion Laboratory Multiangle Imaging Spectro-Radiometer (MISR) and obtained using the MISR Order and Customization Tool hosted at the NASA Langley Atmospheric Science Data Center (available at https://l0dup05.larc.nasa.gov/MISR/cgi-bin/MISR/main.cgi). MISR is flown on NASA's Terra satellite and views the sunlit Earth simultaneously at nine widely spaced angles, providing well-calibrated spectral radiance data in four spectral bands centered on 446 nm, 558 nm, 672 nm, and 866 nm (blue, green, red, and near-infrared, respectively). Atmospheric aerosol loading estimates from MISR allowed the retrieval of high-quality, 275 m surface bidirectional reflectance factors (BRF)s for all bands at nadir and in all nine cameras in the red band. The change in red band reflectance in MISR’s different views depends strongly on the physical structure of forest canopies as well as leaf optical properties and those of the substrate. Thus, a multi-angle approach (Chopping et al., 2020; 2022) exploits the relationship between forest AGB and a suite of red band reflectance values simulated at different viewing angles with respect to the direction of illumination.
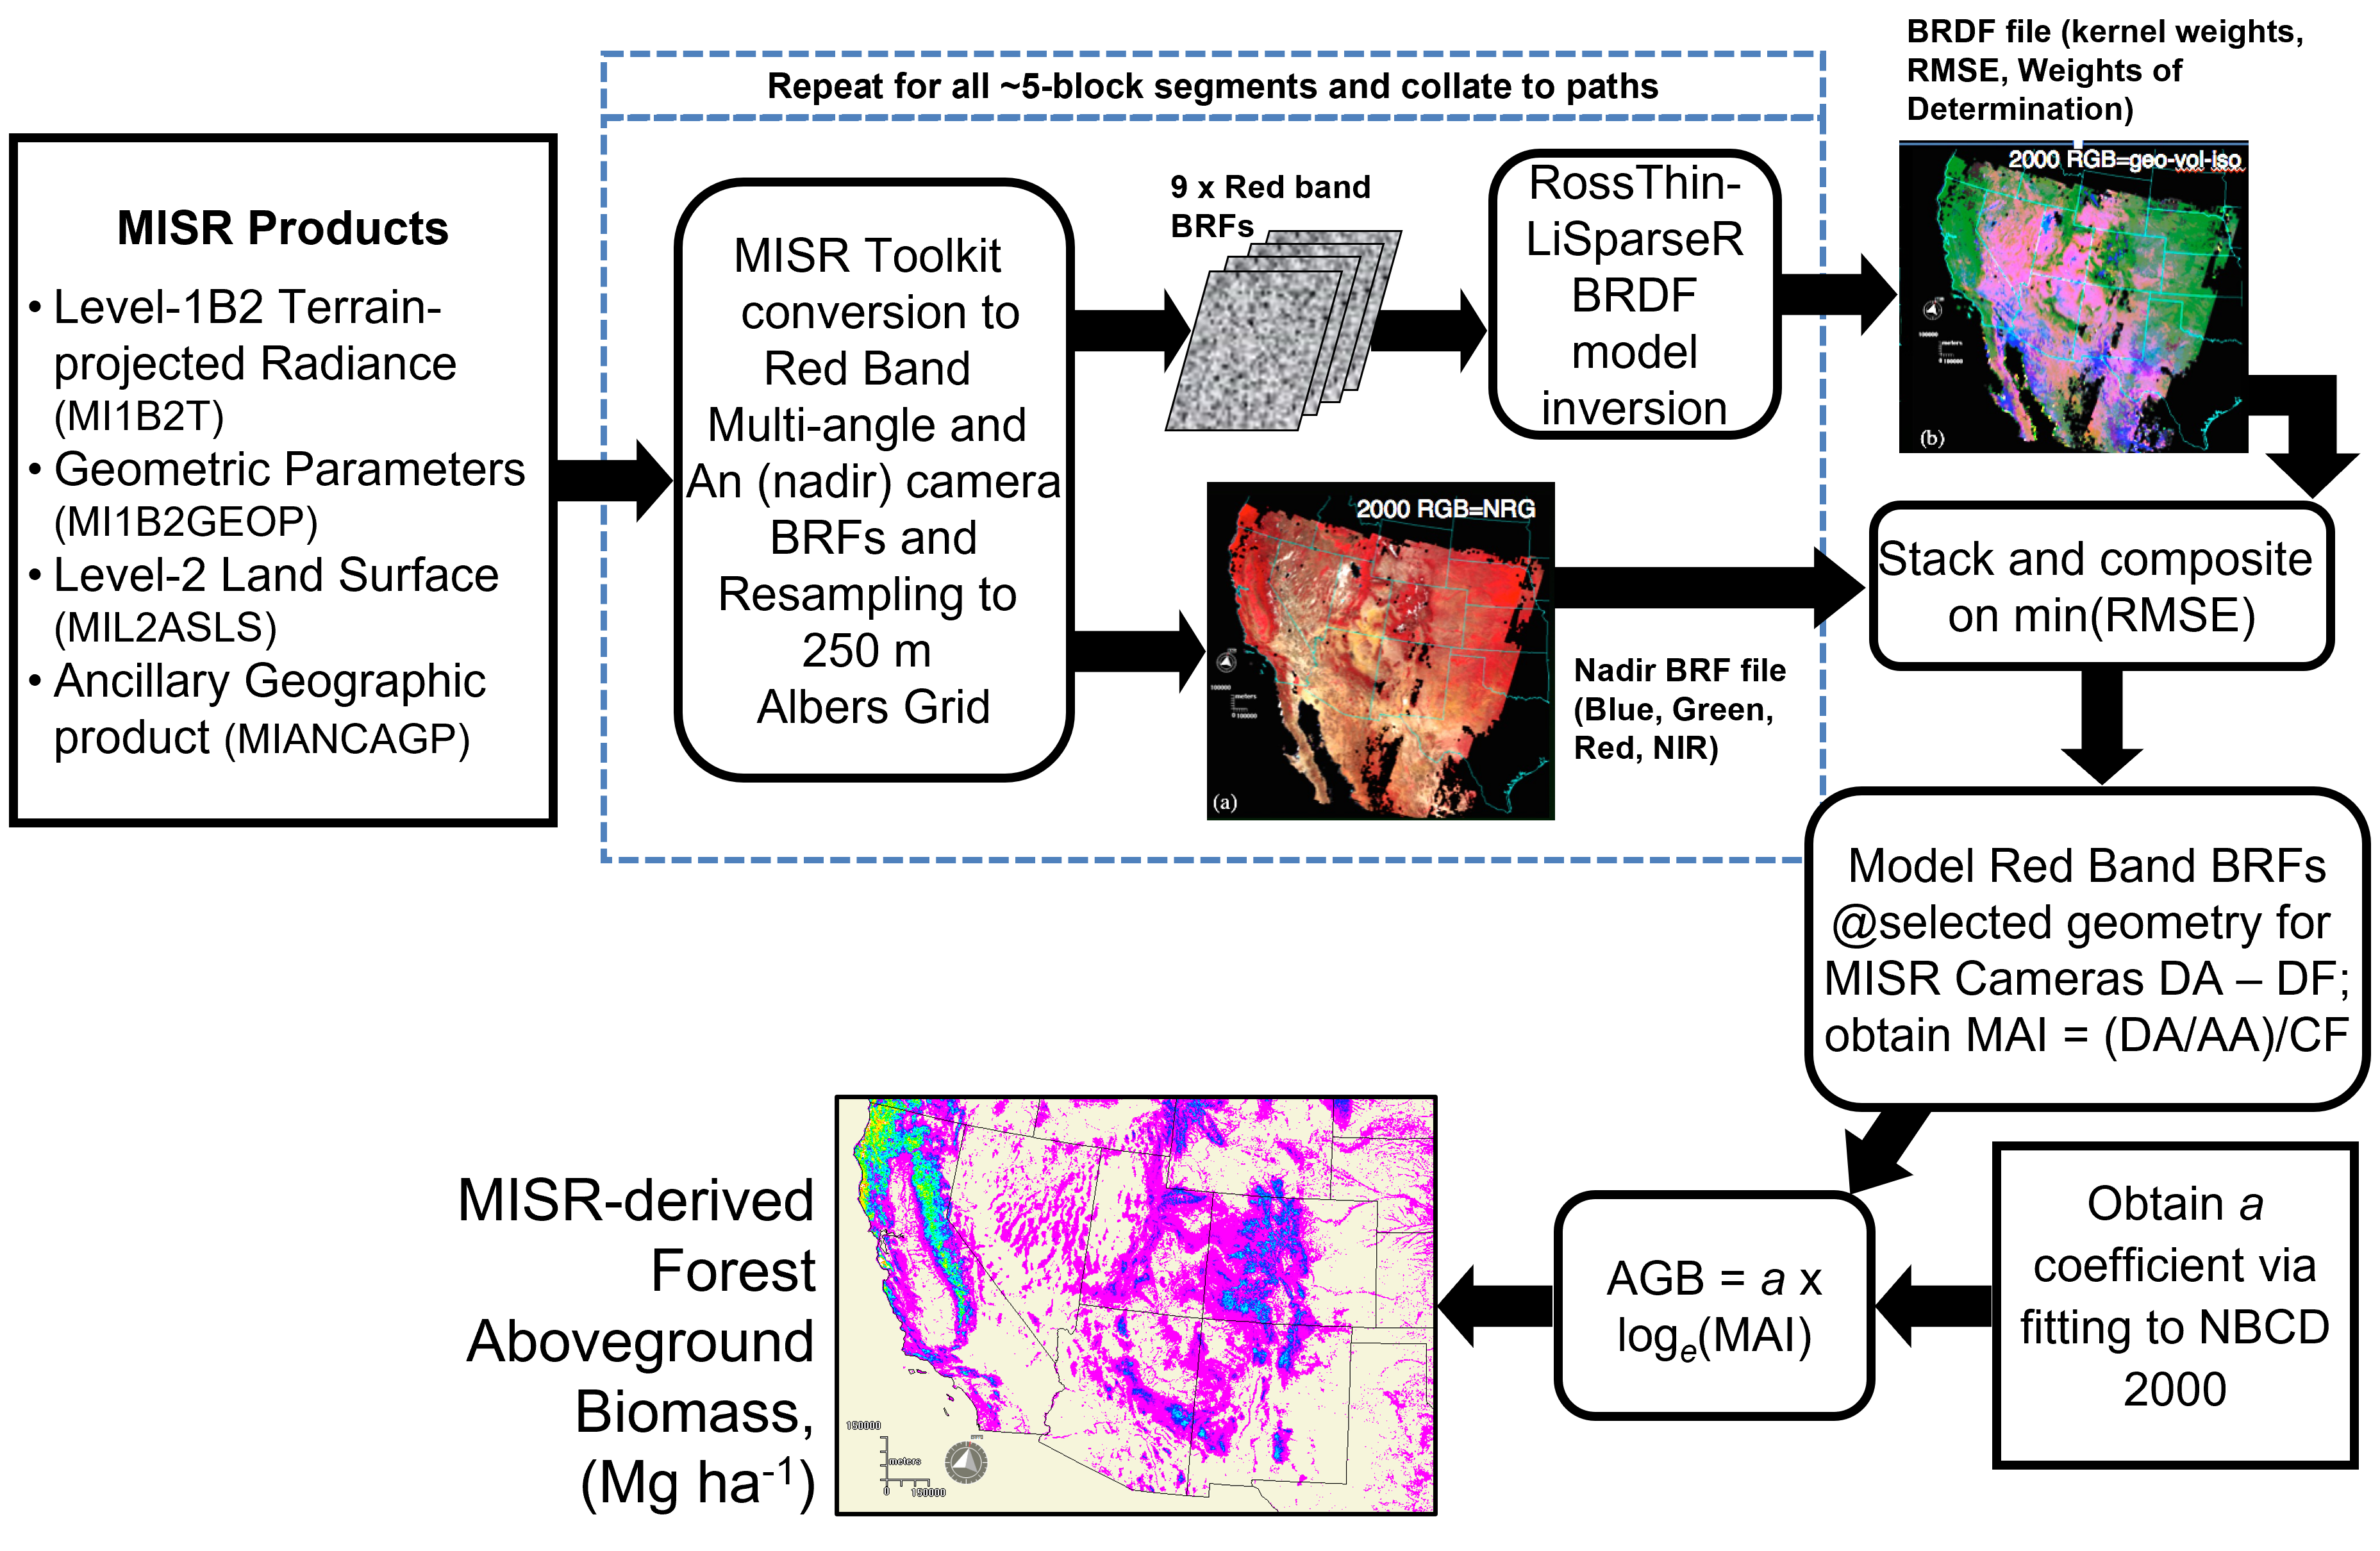
Figure 3. MISR and AGB input data (square boxes with bold outline) and operations performed (rounded boxes) to produce AGB maps using the multi-angle index approach. Source: Chopping et al. (2022)
MISR Data Preparation
BRF Calculation and Resampling
MISR Toolkit routines were used to project 275 m MISR surface BRFs on an Albers Equal Area (Conic) grid centered on intervals of 250 m. The input MISR products include the MISR Level-1B2 Terrain-projected Radiance product (MI1B2T; Jovanovic et al., 2012), the MISR Level-1B2 Geometric Parameters product (MI1B2GEOP; Jovanovic et al., 2012), the MISR Level-2 Land Surface product (MIL2ASLS, surface BRFs at 1.1 km; Jovanovic et al., 2012), and the Ancillary Geographic product (MIANCAGP; Jovanovic et al., 2012). The BRFs were obtained in these routines by performing a linear regression of the red band 1.1 km MISR surface BRFs against the red band 1.1 km MISR Level-2 Land Surface product BRFs (Garay et al., 2018). The data extraction and processing were performed in sets of up to seven blocks. Temporal compositing was performed on the stacked path data, using the minimum BRDF model-fitting RMSE values as the criterion to select, for each location, the observation least likely to be contaminated with clouds.
BRDF Model Inversion & Compositing
The RossThin-LiSparse-Reciprocal BRDF model was adjusted against all available red band BRFs acquired May 15 through June 15 of each year for the period 2000–2015. The model’s isotropic (iso), geometric (geo), and volume scattering (vol) kernel weights were obtained by adjustment against MISR red band BRFs in all available cameras, with the objective the minimization of the absolute RMSE (i.e., the error on BRDF model fitting). The BRDF model outputs were composited using min(RMSE) as the compositing criterion since high RMSE are reliably obtained for cloud, snow, water, and barren surfaces.
Creation of Modeled MISR Data
To estimate forest AGB using multiangle red band BRF ratios, observations from all nine MISR cameras are required but not always available owing to cloud or topographic obscuration. Therefore, forward modeling was performed for all locations in the composited data using the RossThin-LiSparse-Reciprocal BRDF model and the retrieved kernel weights. The optimal geometry for this application was found to be the MISR camera view zenith angles but in the solar principal plane.
AGB Prediction with a Multi-Angle Index
Modeled BRFs for a representative forested landscape in the vicinity of Mount Lindsey, Colorado, allowed the derivation of a multi-angle index demonstrate a loge relationship with AGB. The approach used the year 2000 National Biomass and Carbon Dataset (NBCD) AGB estimates (hereafter, NBCD_AGB2000), and the selected model was described by the equation y=89.157*ln(x)-210.75, which yielded a predicted AGB of R2=0.91 (n=19) and RMSE of 15.4 Mg ha-1.
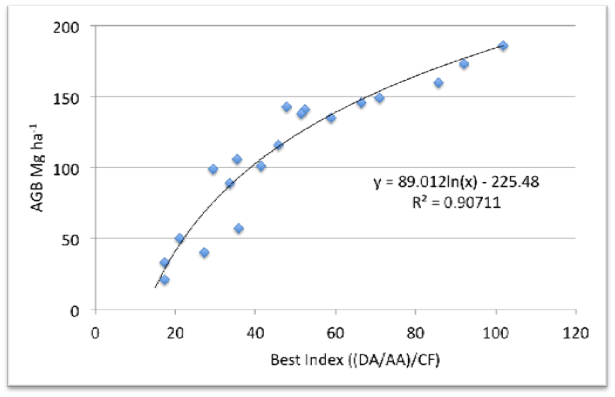
Figure 4. Multi-angle index relationship to NBCD_AGB2000 estimates for the Mount Lindsey area, Colorado, excluding rocky sites. The index was obtained using MISR BRFs modeled in the solar principal plane. The corresponding R2 values for MISR spectral-nadir metrics were 0.07, 0.32, and 0.37 for near-infrared band BRFs, NDVI, and red band BRFs, respectively.
Enabling Region-Wide Mapping
To map AGB across the southwestern U.S. while accounting for variations in forest type, soils, and topography.
A simplified single coefficient model for MISR-predicted AGB was fitted to the NBCD_AGB2000 by adjusting the coefficient using numerical methods (i.e., minimizing the root of the average of squared differences with the year 2000 MISR-derived and NBCD_AGB2000 across all data). The resultant model was reduced to:
modeled AGB = a x loge(MAI),
where a is a fitted coefficient and MAI is a multi-angle index derived as:
MAI = (DABRF/AABRF)/CFBRF,
where DABRF, AABRF, and CFBRF are red band BRFs derived at the viewing and illumination angles of these three MISR cameras and predicted using the RossThin-LiSparse-Reciprocal BRDF model that was adjusted against all available MISR red band BRFs. The resulting index was used to predict AGB for all locations and all years, 2000–2015. Missing data and estimates greater than 1,000 Mg ha-1 are indicated with a value of -1 (see Table 2). Note that the 2021 MISR data are from the FIRSTLOOK product (Garay et al., 2018), which used the prior year's snow/ice mask and cloud screening thresholds.
Data Access
These data are available through the Oak Ridge National Laboratory (ORNL) Distributed Active Archive Center (DAAC).
Forest Aboveground Biomass for the Southwestern U.S. from MISR, 2000-2021
Contact for Data Center Access Information:
- E-mail: uso@daac.ornl.gov
- Telephone: +1 (865) 241-3952
References
Berner, L.T., B.E. Law, and T.W. Hudiburg. 2017a. Water availability limits tree productivity, carbon stocks, and carbon residence time in mature forests across the western US. Biogeosciences 14:365–378. https://doi.org/10.5194/bg-14-365-2017
Berner, L.T., Law, B.E., Meddens, A.J.H., and Hicke, J.A. 2017b. Tree mortality from fires, bark beetles, and timber harvest during a hot and dry decade in the western United States (2003–2012), Environmental Research Letters 12(6). https://doi.org/10.1088/1748-9326/aa6f94
Berner, L.T., B.E. Law, A.J. Meddens, and J.A. Hicke. 2019. Tree Mortality from Fires and Bark Beetles at 1-km Resolution, Western USA, 2003-2012. ORNL DAAC, Oak Ridge, Tennessee, USA. https://doi.org/10.3334/ORNLDAAC/1512
Chopping, M., Z. Wang, M. Bull, C. Schaaf, M.A. Bull, and R. Duchesne. 2020. Forest aboveground biomass in the Southwestern U.S. from a MISR multi-angle index, 2000–2015, AGU Fall Meeting 2020. Session GC004: Immense Pressures and High Expectations: Managing Forest Ecosystems for Multiple Benefits Under Human Activities, Climate Change, and Disturbance II Posters.
Chopping, M., Z. Wang, M. Bull, C. Schaaf, M.A. Bull, and R. Duchesne. 2022. Forest aboveground biomass in the Southwestern U.S. from a MISR multi-angle index, 2000–2015. Remote Sensing of Environment 274C. https://doi.org/10.1016/j.rse.2009.05.017
Garay, M.J., M.A. Bull, A.M. Nastan, M.L. Witek, F.C. Seidel, D.J. Diner, R.A. Kahn, J.A. Limbacher, and O.V. Kalashnikova. 2018. Data Product Specification for the MISR Level 2 Aerosol Product. Jet Propulsion Laboratory, California Institute of Technology. JPL D-100649. https://asdc.larc.nasa.gov/documents/misr/DPS_AEROSOL_V023.20180125.pdf
Hagen, S., N. Harris, S.S. Saatchi, T. Pearson, C.W. Woodall, S. Ganguly, G.M. Domke, B.H. Braswell, B.F. Walters, J.C. Jenkins, S. Brown, W.A. Salas, A. Fore, Y. Yu, R.R. Nemani, C. Ipsan, and K.R. Brown. 2016. CMS: Forest Carbon Stocks, Emissions, and Net Flux for the Conterminous US: 2005-2010. ORNL DAAC, Oak Ridge, Tennessee, USA. https://doi.org/10.3334/ORNLDAAC/1313
Harris, N.L., S.C. Hagen, S.S. Saatchi, T.R. H. Pearson, C.W. Woodall, G.M. Domke, B.H. Braswell, B.F. Walters, S. Brown, W. Salas, A. Fore, and Y. Yu. 2016. Attribution of net carbon change by disturbance type across forest lands of the conterminous United States. Carbon Balance and Management 11. https://doi.org/10.1186/s13021-016-0066-5
Jovanovic, V., K. Miller, B. Rheingans, and C. Moroney. 2012. MISR Science Data Product Guide. Jet Propulsion Laboratory, California Institute of Technology. JPL D-73355. https://asdc.larc.nasa.gov/documents/misr/guide/MISR_Science_Data_Product_Guide.pdf
Kellndorfer, J., W. Walker, K. Kirsch, G. Fiske, J. Bishop, L. Lapoint, M. Hoppus, and J. Westfall. 2013. NACP Aboveground Biomass and Carbon Baseline Data, V.2 (NBCD 2000), U.S.A., 2000. ORNL DAAC, Oak Ridge, Tennessee, USA. https://doi.org/10.3334/ORNLDAAC/1161
Sillett, S.C., R. Van Pelt, A.L. Carroll, J. Campbell-Spickler, and M.E. Antoine. 2019. Structure and dynamics of forests dominated by Sequoiadendron giganteum. Forest Ecology and Management 448:218–239. https://doi.org/10.1016/j.foreco.2019.05.064
Walters, S.P., N.J. Schneider, and J.D. Guthrie. 2011. Geospatial Multi-Agency Coordination (GeoMAC) wildland fire perimeters, 2008. U.S. Geological Survey Data Series 612:6 pp.https://pubs.usgs.gov/ds/612
Xu, Q., A. Man, M.M. Fredrickson, Z. Hou, J. Pitkanen, B. Wing, C. Ramirez, B. Li, and J. Greenberg. 2018a. LiDAR-Derived Aboveground Biomass and Uncertainty for California Forests, 2005-2014. ORNL DAAC, Oak Ridge, Tennessee, USA. https://doi.org/10.3334/ORNLDAAC/1537
Xu, Q., A. Man, M. Fredrickson, Z. Hou, J. Pitkänen, B. Wing, C. Ramirez, B. Li, and J.A. Greenberg. 2018b. Quantification of uncertainty in aboveground biomass estimates derived from small-footprint airborne LiDAR. Remote Sensing of Environment 216:514–528. https://doi.org/10.1016/j.rse.2018.07.022