Documentation Revision Date: 2022-05-05
Dataset Version: 2
Summary
These data expand the temporal range of greenhouse gas measurements provided in the first version of the dataset and include two additional cities.
There are 550 data files included in this dataset: 275 files in netCDF (*.nc) and 275 files in text (*.txt) formats. Also included are three companion files: scripts to load the data from netCDF files.
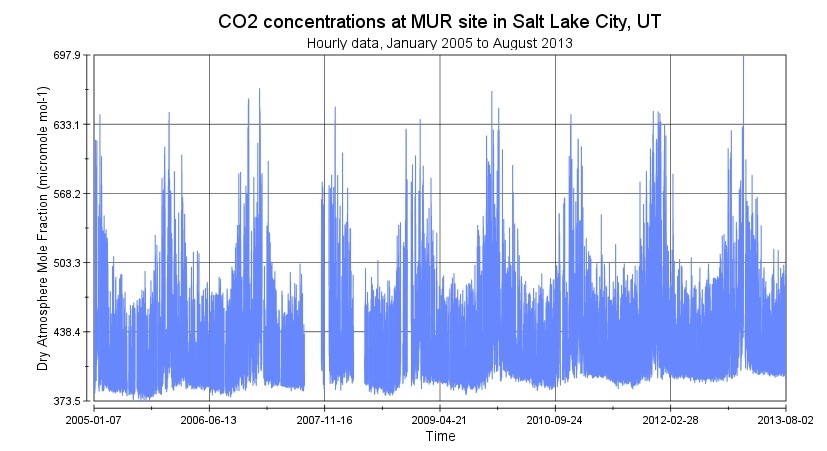
Figure 1. Carbon dioxide concentrations at the MUR site in Salt Lake City, Utah, show a pronounced seasonal pattern of higher CO2 in the winter months. Source: salt_lake_city_co2_MUR_6m_1_hour_R0_2020-11-17.nc
Citation
Mitchell, L.E., J.C. Lin, L.R. Hutyra, D.R. Bowling, R.C. Cohen, K.J. Davis, A. Guha, A. Karion, R.F. Keeling, J.J. Kim, N.L. Miles, C.E. Miller, S. Newman, S. Prinzivalli, A. Rice, S.J. Richardson, M. Sargent, K.R. Verhulst, F. Vogel, R.F. Weiss, J. Whetstone, and S.C. Wofsy. 2021. NACP: Urban Greenhouse Gases across the CO2 Urban Synthesis and Analysis Network, V2. ORNL DAAC, Oak Ridge, Tennessee, USA. https://doi.org/10.3334/ORNLDAAC/1916
Table of Contents
- Dataset Overview
- Data Characteristics
- Application and Derivation
- Quality Assessment
- Data Acquisition, Materials, and Methods
- Data Access
- References
- Dataset Revisions
Dataset Overview
This dataset provides hourly urban greenhouse gas measurements for cities in the CO2 Urban Synthesis and Analysis (CO2-USA) Data Synthesis Network for 2000 to 2019. Measurements include carbon dioxide (CO2), methane (CH4), and carbon monoxide (CO) concentrations measured at hourly intervals at multiple sites within the U.S. cities of Boston, Indianapolis, Los Angeles, Portland, Salt Lake City, San Francisco, and Washington DC/Baltimore, and Toronto, Canada.
These data expand the temporal range of greenhouse gas measurements provided in the first version of the dataset and include two additional cities.
Project: North American Carbon Program
The North American Carbon Program (NACP) is a multidisciplinary research program designed to improve understanding of North America's carbon sources, sinks, and stocks. The central objective is to measure and understand the sources and sinks of Carbon Dioxide (CO2), Methane (CH4), and Carbon Monoxide (CO) in North America and adjacent oceans. The NACP is supported by a number of different federal agencies.
Related Publication
Mitchell, L.E., J.C. Lin, L.R. Hutyra, D.R. Bowling, R.C. Cohen, K.J. Davis, A. Guha, A. Karion, R.F. Keeling, J.J. Kim, N.L. Miles, C.E. Miller, S. Newman, S. Prinzivalli, A. Rice, S.J. Richardson, M. Sargent, K.R. Verhulst, F. Vogel, R.F. Weiss, J. Whetstone, and S.C. Wofsy. 2021. A multi-city urban atmospheric greenhouse gas measurement data synthesis. Submitted to Nature Scientific Data.
Related Datasets
Mitchell, L., J.C. Lin, L.R. Hutyra, M. Sargent, S.C. Wofsy, N.L. Miles, S.J. Richardson, K.R. Verhulst, R.M. Duren, A. Rice, R.C. Cohen, A. Shusterman, S. Newman, and A. Guha. 2019. NACP: Urban Greenhouse Gases across the CO2 Urban Synthesis and Analysis Network. ORNL DAAC, Oak Ridge, Tennessee, USA. https://doi.org/10.3334/ORNLDAAC/1743
- Version 1 of this dataset. Now superseded and available only upon request.
Acknowledgments
This work was funded by the North American Carbon Program (NACP) under the NOAA Climate Program Office's Atmospheric Chemistry, Carbon Cycle, and Climate program (grant NA17OAR4310084).
Data Characteristics
Spatial Coverage: U.S.: Boston, Massachusetts; Indianapolis, Indiana; Los Angeles, California; Portland, Oregon; Salt Lake City, Utah; San Francisco, California; and Washington, D.C./Baltimore, Maryland; Canada: Toronto, Ontario.
Spatial Resolution: Point locations
Temporal Coverage: 2000-01-01 to 2019-12-31; sites operated for different time periods
Temporal Resolution: Hourly
Study Area: Latitude and longitude are given in decimal degrees.
| Site | Westernmost Longitude | Easternmost Longitude | Northernmost Longitude | Southernmost Latitude |
|---|---|---|---|---|
| Full Extent | -123.0726 | -70.4972 | 45.769 | 32.865 |
Data File Information
There are 550 data files included in this dataset: 275 files in netCDF (*.nc) and 275 files in text (*.txt) formats. A separate data file is available for each site and each of three chemical species. When available, there is a separate data file for the “background” measurements of each chemical species. The “background” time series comes from the published literature, and users are encouraged to read the relevant publication to understand how the time series was created and should be used. The text files are identical to the netCDF files, except that metadata are included as comments in the text files.
Also included are three companion files: scripts to load the data from netCDF files in Python (co2usa_load_netCDF.py), MatLab (co2usa_load_netCDF.m) and R (co2usa_load_netCDF.R) programming languages.
The data files are named <city>_<species>_<site>_<height>_<timeres>_R#_YYYY-MM-DD.ext, where
- <city> is the sampled city (Table 2),
- <species> is the chemical species ("ch4", "co", or "co2"),
- <site> is the abbreviation for the specific sampling location,
- <height> is the height of the measurement in meters,
- <timeres> is "1_hour", the temporal resolution,
- for "background" files, this element is "background_1_hour" and there is no <site> or <height>,
- R# is the revision number,
- YYYY-MM-DD is the date of data file creation, and
- EXT is the file extension ("nc" or "txt").
Data File Details
Missing data are indicated by -9999.
Table 1. Bounding coordinates for each city. All latitudes and longitudes are given in decimal degrees. There were two sampling networks in San Francisco.
| City | Number of Sites | Westernmost Longitude | Easternmost Longitude | Northernmost Latitude | Southernmost Latitude |
|---|---|---|---|---|---|
| Boston | 8 | -72.171 | -70.498 | 43.709 | 41.350 |
| Indianapolis | 14 | -86.740 | -85.745 | 40.041 | 39.580 |
| Los Angeles | 12 | -118.604 | -117.257 | 34.609 | 32.867 |
| Portland | 3 | -122.772 | -122.603 | 45.769 | 45.497 |
| Salt Lake City | 7 | -112.070 | -111.837 | 40.794 | 40.481 |
| San Francisco (BAAQMD) | 4 | -123.073 | -121.600 | 38.319 | 37.079 |
| San Francisco (BEACON) | 65 | -122.503 | -121.493 | 38.568 | 37.617 |
| Toronto | 4 | -80.558 | -79.389 | 44.231 | 42.635 |
| Washington/Baltimore | 13 | -77.530 | -76.043 | 39.577 | 38.446 |
Table 2. Variable names and descriptions.
| Variable | Units | Description |
|---|---|---|
| ch4 | co | co2 | ch4, co: nmol mol-1 co2: μmol mol-1 |
average of the greenhouse gas (ch4, co, or co2) mole fraction measurements during each 1 hour time period |
| elevation | m | elevation above sea level at the station location |
| inlet_height | m | height of the sample inlet above ground level |
| lat | degrees north | latitude of sample location |
| lon | degrees east | longitude of sample location |
| n | count | number of measurements in the hour |
| std_dev | ch4, co: nmol mol-1 co2: μmol mol-1 |
standard deviation of the greenhouse gas mole fraction measurements in the hour |
| time | seconds | sample time in number of seconds since 1970-01-01 00:00:00 in UTC; time denotes the end of the 1-hour sample period |
| time_string | character | sample date/time in ISO 8601 format (UTC) |
| uncertainty | ch4, co: nmol mol-1 co2: μmol mol-1 |
measurement uncertainty determined by the data provider |
The following information can also be found within each of the data files:
- Title of the dataset
- Summary
- Keywords
- References
- Date created
- Fair use data policy
- Data provider name, affiliation, contact information, and email
- Compilation originator name, affiliation, contact information, and email
- Temporal resolution of the data
- Data start and stop dates
- Instruments used in the data collection
- Calibration scale of the chemical species
Application and Derivation
Cities have emerged as leaders in U.S. efforts to reduce greenhouse gas (GHG) emissions, but the scientific knowledge to quantitatively track emissions and assess the efficacy of mitigation is lacking. As the global population increasingly resides in urban regions, scientific knowledge about how much, where, and why a particular city emits carbon becomes increasingly important. These cooperative data products are made freely available to the public and scientific community to advance the study of urban carbon cycling and associated air pollutants.
Urban GHG measurements are commonly compared to 'background' values, the mole fraction of GHG in the air flowing into the city. The difference between the observed and the background mole fractions measures how fluxes within the city altered the atmospheric composition of the urban airshed. Background values from the published literature are provided for Boston (CO2, CH4) Indianapolis (CO2, CH4, CO), and Salt Lake City (CO2) in data files with ‘background’ in the filename. The background data are different from the other measurements in the dataset; refer to the references attribute in the file header for information about how the background dataset was constructed.
Quality Assessment
Several approaches were used to validate greenhouse gas measurements in each city. At a minimum, the research teams in every city calibrated their measurements with working calibration standards in the form of high-pressure gas cylinders that have known mole fractions and are tied to World Meteorological Organization calibration standards. Calibration frequency varied across cities and sites from hourly to daily intervals, with the timing being dependent on several factors that could impact instrument drift (e.g., whether or not the instrument is in a temperature-controlled setting).
The BEACO2N network in San Francisco used a modified approach with their low-cost sensor network design (Shusterman et al. 2016). That network had a dedicated site with typical calibrations and then used a whole-network calibration approach to correct for site-specific instrument drift. In addition to regular calibrations, some cities have conducted "round-robin" calibration tests where one or more calibration cylinders were used to test instruments at sites across a city, or between laboratories in different cities.
Measurement uncertainties, as determined by the data providers, are provided in the “uncertainty” variable of the data files.
Data Acquisition, Materials, and Methods
CO2-USA Network
The CO2 Urban Synthesis and Analysis (CO2-USA) network was established to build a collaborative network of urban carbon cycle researchers to facilitate data sharing, create analysis frameworks to enable cross-city synthesis analyses, and enable new collaborations tackling objectives that are difficult to address in isolation (Fig. 2). One of the principal objectives of the CO2-USA project was to develop a harmonized synthesis dataset of atmospheric dry-air mole fraction urban greenhouse gas (GHG) measurements that is readily usable, traceable to international calibration standards, and accessible to a large community: researchers, urban stakeholders, and the public. This collaborative network aims to exchange information on community standards and common measurements, facilitate data sharing, and create analysis frameworks and cross-city syntheses to catalyze a new generation of researchers and enable new collaborations tackling important objectives that are difficult to address in isolation.
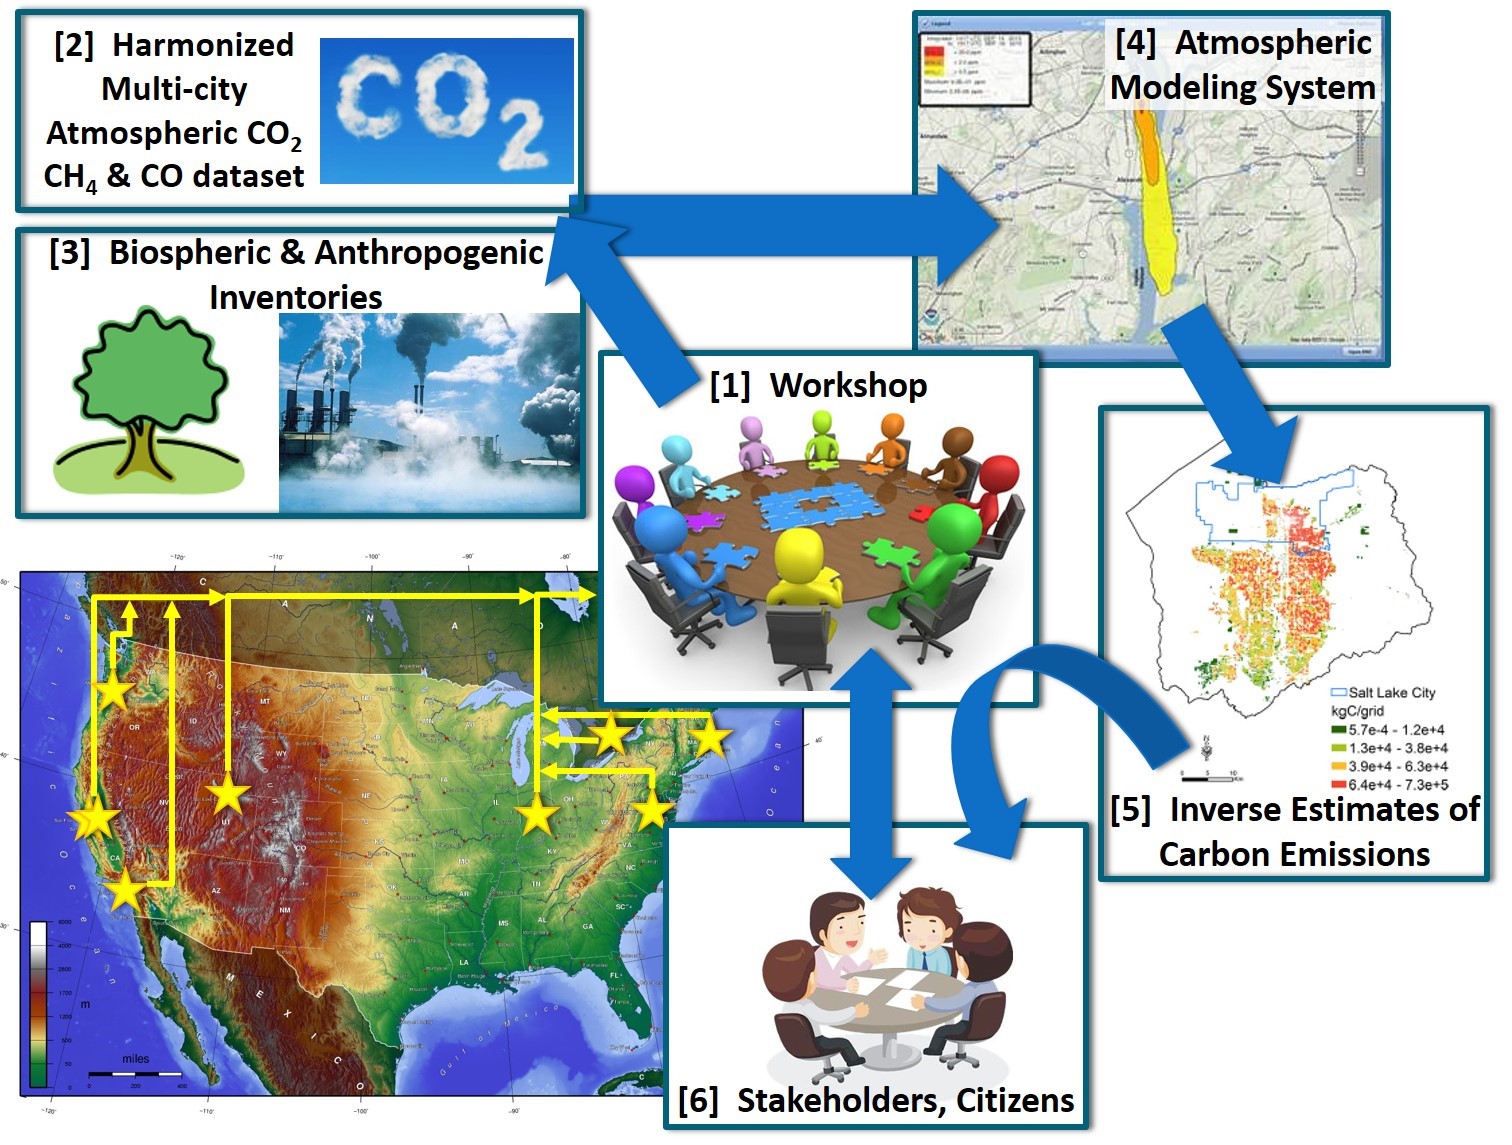
Figure 2. Schematic of the CO2-USA project showing the eight cities currently in the CO2-USA network (there are two measurement networks in San Francisco).
Specifically, the CO2-USA synthesis effort seeks to:
- Quantify & understand similarities/differences in CO2 and CH4 fluxes across cities;
- Develop harmonized CO2 and CH4 mixing ratio datasets that are readily useable, traceable, and accessible by the research community and the public;
- Construct an atmospheric modeling system that is scalable and transferable between cities;
- Compare & understand similarities/differences between anthropogenic emission inventories;
- Improve estimates of biospheric fluxes across cities;
- Foster a community of urban carbon cycle researchers and generate collaborative studies;
- Engage stakeholders to link them with data, syntheses, and insights into urban emissions.
More information about the CO2-USA project can be found on the project webpage.
Data Collection & Compilation
Urban GHG monitoring projects are underway in many cities, including Los Angeles (Feng et al., 2016; Verhulst et al., 2016), Indianapolis (Lauvaux et al., 2016), Salt Lake City (McKain et al., 2012; Bares et al., 2019), Paris (Staufer et al., 2016), Washington, DC (Mueller et al., 2017), and Boston (McKain et al., 2015; Sargent et al., 2018; Karion et al., 2020). These observational networks provide an opportunity for top-down assessments of GHG emissions using high-precision atmospheric measurements that are highly comparable both within the network and between networks and offer long-term stability.
Data providers collected GHG dry-air mole fraction measurements including CO2, CH4, and CO using a variety of instrumentation, experimental setups, and site configurations. All measurements were made using spectroscopy-based instrumentation. Each of these instruments also measures water vapor to correct for the spectroscopic absorption and dilution of water vapor. Each reports the mole fraction of the target GHG species on a dry-air mole fraction basis. Experimental setups varied across cities and sites within cities, but most sites had a gas analyzer, calibration tanks containing reference gas mixtures, a data logger, and tubing to an external inlet.
The temporal frequency of the native measurements varied across cities, so data providers calculated and reported hourly averages using the "floored hour." For example, data from 08:00 to 08:59 were averaged and reported as the hour of 08:00 UTC. In addition, the standard deviation and number of measurements within the hour were reported where possible.
Code used to compile and work with this data product is maintained on the GitHub repository https://github.com/uataq/co2usa_data_synthesis. The repository also includes scripts to load the data from the netCDF files have been written in the Python, R and Matlab programming languages (which have been included as companion files to this dataset). A Python script for loading the data and making plots is available.
Data Access
These data are available through the Oak Ridge National Laboratory (ORNL) Distributed Active Archive Center (DAAC).
NACP: Urban Greenhouse Gases across the CO2 Urban Synthesis and Analysis Network, V2
Contact for Data Center Access Information:
- E-mail: uso@daac.ornl.gov
- Telephone: +1 (865) 241-3952
References
Bares, R., Mitchell, L., Fasoli, B., Bowling, D.R., Catharine, D., Garcia, M., Eng, B., Ehleringer, J. and Lin, J.C., 2019. The Utah urban carbon dioxide (UUCON) and Uintah Basin greenhouse gas networks: instrumentation, data, and measurement uncertainty. Earth System Science Data 11:1291-1308. https://doi.org/10.5194/essd-11-1291-2019
Feng, S., T. Lauvaux, S. Newman, P. Rao, R. Ahmadov, A. Deng, L.I. Díaz-Isaac, R.M. Duren, M.L. Fischer, C. Gerbig, K.R. Gurney, J. Huang, S. Jeong, Z. Li, C.E. Miller, D. O'Keeffe, R. Patarasuk, S.P. Sander, Y. Song, K.W. Wong, and Y.L. Yung. 2016. Los Angeles megacity: a high-resolution land–atmosphere modelling system for urban CO2 emissions. Atmospheric Chemistry and Physics 16:9019–9045. https://doi.org/10.5194/acp-16-9019-2016
Karion, A., Callahan, W., Stock, M., Prinzivalli, S., Verhulst, K.R., Kim, J., Salameh, P.K., Lopez-Coto, I. and Whetstone, J., 2020. Greenhouse gas observations from the Northeast Corridor tower network. Earth System Science Data 12:699-717. https://doi.org/10.5194/essd-12-699-2020
Lauvaux, T., N.L. Miles, A. Deng, S.J. Richardson, M.O. Cambaliza, K.J. Davis, B. Gaudet, K.R. Gurney, J. Huang, D. O'Keefe, Y. Song, A. Karion, T. Oda, R. Patarasuk, I. Razlivanov, D. Sarmiento, P. Shepson, C. Sweeney, J. Turnbull, and K. Wu. 2016. High-resolution atmospheric inversion of urban CO2 emissions during the dormant season of the Indianapolis Flux Experiment (INFLUX). J Geophysical Research Atmospheres 121:5213-5236. https://doi.org/10.1002/2015JD024473
McKain, K., A. Down, S.M. Raciti, J. Budney, L.R. Hutyra, C. Floerchinger, S.C. Herndon, T. Nehrkorn, M.S. Zahniser, R.B. Jackson, N. Phillips, and S.C. Wofsy. 2015. Methane emissions from natural gas infrastructure and use in the urban region of Boston, Massachusetts. Proc Natl Acad Sci USA 112:1941-1946. https://doi.org/10.1073/pnas.1416261112
McKain, K., S.C. Wofsy, T.Nehrkorn, J. Eluszkiewicz, J.R. Ehleringer, and B.B. Stephens. 2012. Assessment of ground-based atmospheric observations for verification of greenhouse gas emissions from an urban region. Proc Natl Acad Sci USA 109:8423-8428. https://doi.org/10.1073/pnas.1116645109
Mitchell, L., J.C. Lin, L.R. Hutyra, M. Sargent, S.C. Wofsy, N.L. Miles, S.J. Richardson, K.R. Verhulst, R.M. Duren, A. Rice, R.C. Cohen, A. Shusterman, S. Newman, and A. Guha. 2019. NACP: Urban Greenhouse Gases across the CO2 Urban Synthesis and Analysis Network. ORNL DAAC, Oak Ridge, Tennessee, USA. https://doi.org/10.3334/ORNLDAAC/1743
Mueller, K., V. Yadav, I. Lopez-Coto, A. Karion, S. Gourdji, C. Martin, and J. Whetstone. 2018. Siting background towers to characterize incoming air for urban greenhouse gas estimation: A case study in the Washington, DC/Baltimore area. J Geophysical Research Atmospheres 123:2910-2926. https://doi.org/10.1002/2017JD027364
Sargent, M., Y. Barrera, T. Nehrkorn, L.R. Hutyra, C.K. Gately, T. Jones, K. McKain, C. Sweeney, J. Hegarty, B. Hardiman, and S.C. Wofsy. 2018. Anthropogenic and biogenic CO2 fluxes in the Boston urban region. Proc Natl Acad Sci USA 115:7491-7496. https://doi.org/10.1073/pnas.1803715115
Shusterman, A.A., V.E. Teige, A.J. Turner, C. Newman, J. Kim, and R.C. Cohen. 2016. The BErkeley Atmospheric CO2 Observation Network: initial evaluation. Atmospheric Chemistry and Physics 16:13449-13463. https://doi.org/10.5194/acp-16-13449-2016
Staufer, J., G. Broquet, F.-M. Bréon, V. Puygrenier, F. Chevallier, I. Xueref-Rémy, E. Dieudonné, M. Lopez, M. Schmidt, M. Ramonet, O. Perrussel, C. Lac, L. Wu, and P. Ciais. 2016. The first 1-year-long estimate of the Paris region fossil fuel CO2 emissions based on atmospheric inversion. Atmospheric Chemistry and Physics 16:14703-14726. https://doi.org/10.5194/acp-16-14703-2016
Verhulst, K.R., A. Karion, J. Kim, P.K. Salameh, R.F. Keeling, S. Newman, J. Miller, C. Sloop, T. Pongetti, P. Rao, C. Wong, F.M. Hopkins, V. Yadav, R.F. Weiss, R.M. Duren, and C.E. Miller. 2017. Carbon dioxide and methane measurements from the Los Angeles Megacity Carbon Project – Part 1: calibration, urban enhancements, and uncertainty estimates. Atmospheric Chemistry and Physics 17:8313–8341. https://doi.org/10.5194/acp-17-8313-2017
Dataset Revisions
| Version | Dataset Title and Description | Published |
|---|---|---|
| 1 |
NACP: Urban Greenhouse Gases across the CO2 Urban Synthesis and Analysis Network |
2019-10-31 |
| 2 |
NACP: Urban Greenhouse Gases across the CO2 Urban Synthesis and Analysis Network, V2 |
2021-11-30 |