Documentation Revision Date: 2023-03-24
Dataset Version: 1
Summary
This dataset was produced as part of the North American Carbon Program (NACP). NACP is a multidisciplinary research program designed to improve understanding of North America's carbon sources, sinks, and stocks. The central objective is to measure and understand the sources and sinks of Carbon Dioxide (CO2), Methane (CH4), and Carbon Monoxide (CO) in North America and adjacent oceans. The NACP is supported by a number of different federal agencies.
This dataset includes 30 data files in Cloud Optimized GeoTIFF (*.tif) format.
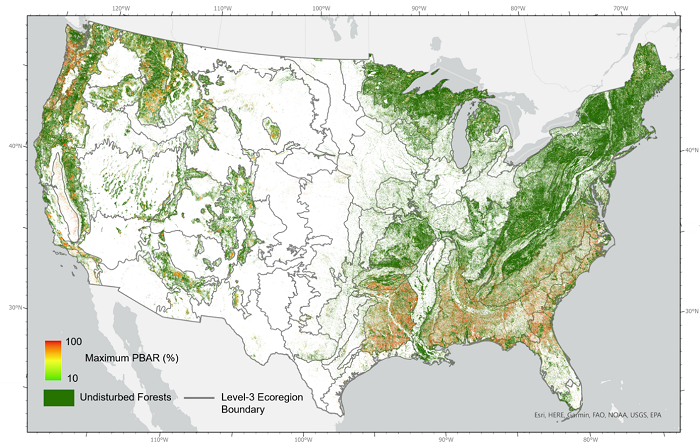
Figure 1. Forest disturbance intensity 1986 - 2015. This time-integrated map represents the percentage of basal area removal (PBAR) value, regardless of the disturbance year, for pixel locations where only one disturbance event was detected. The maximum PBAR is shown for locations that were disturbed multiple times.
Citation
Lu, J., C. Huang, X. Tao, and K. Schleeweis. 2023. NACP NAFD Project: Forest Disturbance Intensity for CONUS from Landsat, 1986-2015. ORNL DAAC, Oak Ridge, Tennessee, USA. https://doi.org/10.3334/ORNLDAAC/2059
Table of Contents
- Dataset Overview
- Data Characteristics
- Application and Derivation
- Quality Assessment
- Data Acquisition, Materials, and Methods
- Data Access
- References
Dataset Overview
This dataset contains estimates of forest disturbance intensity for the conterminous United States from 1986 to 2015. It quantifies the severity/intensity of forest disturbances at 30 m resolution using time series Landsat observations and the vegetation change tracker algorithm. For each disturbance event mapped at a pixel location, the percentage of basal area removal (PBAR) after the disturbance event was estimated based on spectral changes derived from Landsat data and Random Forest models calibrated using field measurements collected by the US Forest Service Forest Inventory and Analysis (FIA) Program. This dataset complements and extends the North American Forest Dynamics-NASA Earth eXchange (NAFD-NEX) US Forest Disturbance History dataset and the NAFD-ATT Forest Canopy Cover Loss dataset from 1986-2010 to 1986-2015. Data are provided in Cloud Optimized GeoTIFF (*.tif) format.
Project: NACP
The North American Carbon Program (NACP) is a multidisciplinary research program designed to improve understanding of North America's carbon sources, sinks, and stocks. The central objective is to measure and understand the sources and sinks of Carbon Dioxide (CO2), Methane (CH4), and Carbon Monoxide (CO) in North America and adjacent oceans. The NACP is supported by a number of different federal agencies.
Related Publication:
Lu, J., C. Huang, X. Tao, W Gong and K Schleeweis. 2022. Annual forest disturbance intensity mapped using Landsat time series and field inventory data for the conterminous United States (1986–2015). Remote Sensing of Environment 275:113003. https://doi.org/10.1016/j.rse.2022.113003.
Related Data:
Schleeweis, K., G.G. Moisen, C. Toney, T.A. Schroeder, C. Huang, E.A. Freeman, S.N. Goward, and J.L. Dungan. 2020. NAFD-ATT Forest Canopy Cover Loss from Landsat, CONUS, 1986-2010. ORNL DAAC, Oak Ridge, Tennessee, USA. https://doi.org/10.3334/ORNLDAAC/1799.
- This dataset predicts the causes of forest loss across the conterminous United States between 1986 and 2010
Goward, S.N., C. Huang, F. Zhao, K. Schleeweis, K. Rishmawi, M. Lindsey, J.L. Dungan, and A. Michaelis. 2015. NACP NAFD Project: Forest Disturbance History from Landsat, 1986-2010. ORNL DAAC, Oak Ridge, Tennessee, USA. https://doi.org/10.3334/ORNLDAAC/1290.
- The dataset displays Landsat-derived forest cover and disturbance across the conterminous United States between 1986 and 2010.
Acknowledgments:
Building on the NAFD (North American Forest Dynamics) research, a core project of the North American Carbon Program (NACP), this study was made possible by NASA’s Carbon Cycle Science and Land Cover and Land Use Change Programs (grants NNX14AM39G, NNX14AD89G, and NNX15AE79G). Additional support was provided by the Department of Geographical Sciences of the University of Maryland and the Laboratory of Environmental Model and Data Optima (EMDO). A large portion of the data processing was performed using the NASA Earth eXchange (NEX) system, which was facilitated by Jennifer Dungan, Andrew Michaelis and their colleagues at NASA Ames Research Center. Use of FIA plot location data was made possible through a Material Transfer Agreement (MTA) established under the leadership of Justin Holgerson and Elizabeth Burrill of the US Forest Service.
Data Characteristics
Spatial Coverage: Conterminous United States
Spatial Resolution: 30 m
Temporal Coverage: 1986-01-01 to 2015-12-31
Temporal Resolution: Annual
Study Areas: Latitude and longitude are given in decimal degrees.
| Site | Westernmost Longitude | Easternmost Longitude | Northernmost Latitude | Southernmost Latitude |
|---|---|---|---|---|
| Conterminous United States | -122.90 | -65.30 | 51.60 | 22.80 |
Data File Information
This dataset includes 30 data files in Cloud Optimized GeoTIFF (*.tif) format. Files contain estimates of forest disturbance intensity for each year from 1986 and 2015. Disturbance intensity is measured by percent basal area removal (PBAR) of forest cover within each pixel. PBAR values range from 0 -10,000, corresponding to a percent with two decimal places (i.e. a value of 1234 is equal to 12.34%).
File names are structured as distb_inten_30m_YYYY.tif, where YYYY indicates the year.
Data File Details
Projection: NAD 1983 Contiguous USA Albers, EPSG 5070
Missing data value: -32,767
Cell size: 30 m x 30 m; Number of rows: 96,777; Number of columns: 153,811
Application and Derivation
The dataset provides the first set of wall-to-wall data products quantifying the percentage of basal area removal (PBAR) resulting from forest disturbances for the conterminous United States over three decades. With an annual time step and 30-m spatial resolution, this dataset complements the NAFD-NEX Forest Disturbance History (Goward et al., 2015) and the NAFD-ATT Forest Canopy Cover Loss (Schleeweis et al., 2020) datasets by extending the NAFD disturbance records from 1986-2010 to 1986-2015. These data provide previously unavailable information on forest disturbances – disturbance severity/intensity, which is critical for understanding the impact of forest disturbances on carbon cycle and a wide range of ecological, hydrological, and biogeochemical processes. The temporal dynamics of disturbance intensity revealed by these map products may shed light on how forest disturbance regimes and management practices varied across CONUS and over the three decades spanning from 1986 to 2015.
Quality Assessment
The performance of Random Forest models derived for estimating disturbance intensity was evaluated through 10-fold cross validations and measured by the coefficient of determination (R2) and Root Mean Square Error (RMSE). While results derived this way likely will be different from those derived using a design-based accuracy assessment method, they should provide a reasonably realistic assessment of the derived data products, because during cross validation, the test plots were not used in model calibration and had little or no spatial autocorrelation with the training plots. The model used to generate the final products had an R2 of 0.65 and RMSE of 16.2%.
Comprehensive assessments conducted by visually examining the derived map products against high resolution Google Earth imagery showed the high quality of these products. In each of the four FIA regions, assessment included 40 randomly selected locations that had low to medium disturbance intensity values (PBAR < 80%) and 40 locations with high values (PBAR ≥ 80%). At each location, the pre- and post-disturbance Google Earth images were visually examined to determine the disturbance intensity qualitatively (low-medium or high). In the four FIA regions, the percentage of locations that had low-medium PBAR values and also had low-medium disturbance intensity according to the Google Earth imagery ranged from 82.5% to 97.5%; for those that had high PBAR values and high disturbance intensity according to the Google Earth imagery, the percentages ranged from 87.5% to 95%.
Data Acquisition, Materials, and Methods
The algorithm used generally follows the approach developed by Tao et al. (2019), which was used to generate pixel-level forest disturbance intensity estimates for North and South Carolina. The approach was applied to the entire CONUS to produce national estimates.
The approach consists of four steps (Figure 2). The first determined the disturbance year and calculated change of spectral indices from Landsat time series. The second derived reference disturbance intensity from repeat measurements on field inventory plots. The reference data were then used to train the Random Forest algorithm to establish the relationship between the spectral changes and basal area change. Finally, the model was applied to Landsat images covering the entire CONUS to produce annual wall-to-wall disturbance estimates.
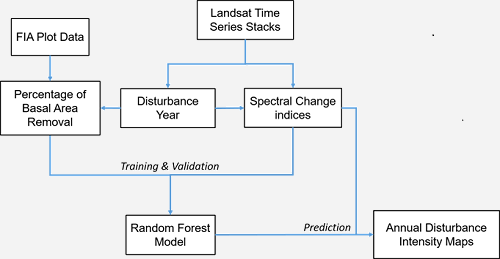
Figure 2. Key steps of the disturbance intensity framework
Disturbance estimates used in this study were derived from Landsat data using the vegetation change tracker (VCT) algorithm (Huang et al., 2010). For each disturbance detected, 10 magnitude measures, including 5 delta variables and 5 normalized ratio variables, were calculated using several spectral bands and indices to represent the spectral change of the pre- and post-disturbance events.
Reference data on disturbance intensity was derived from repeat measurements at the same FIA plots on different dates. A total of 3,554 FIA plots were used. Given the 5- to 10-year intervals between FIA measurements, however, changes in total basal area between two dates cannot be attributed solely to disturbance events. Growth of surviving trees and new trees between the two dates also contribute to an increase in basal area of a plot. Therefore, a simple difference of total basal area between two measures would include the growth, often resulting in an underestimation of the basal area change caused by disturbance events. To eliminate the effect of tree growth, each tree record was tracked by its sequence number through time. Only trees recorded in the prior inventory and absent from the next inventory are assumed to be affected or removed by disturbances between the two inventories (Figure 3). The difference between basal areas of these trees, as measured in first inventory, were then used to calculate the percentage of basal area removal (PBAR) as a measure of disturbance intensity.
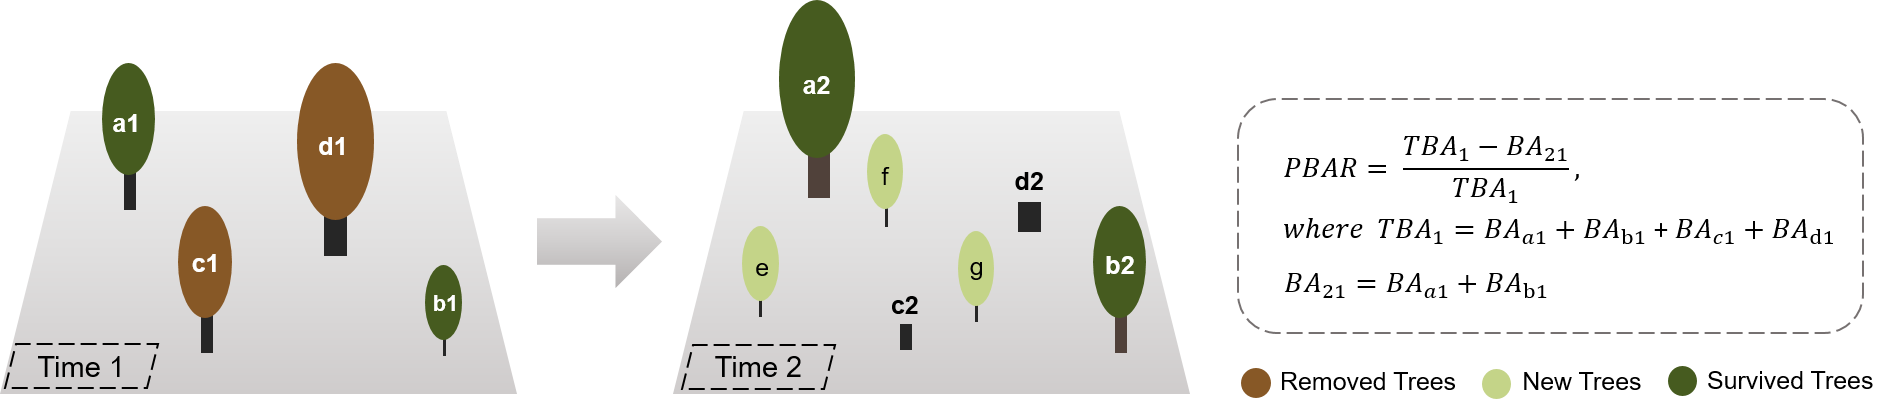
Figure 3. An illustration of forest change between two inventory times showing basal area loss due to disturbance (trees c and d), gain from growth (trees a and b), and establishment of new trees (trees e, f, and g). In tree labels, the letter denotes which tree it is, and the number denotes the time of inventory (e.g., a1 means tree a measured at time 1). The basal area change caused by the disturbance event would be underestimated by a simple difference between the two inventories.
Calculation of PBAR: PBAR = (TBA1 – BA21) / TBA1
where TBA1 is the total basal area of all live trees at the first time of inventory, and BA21 is the total basal area of trees alive at both inventory 1 and the subsequent inventory 2. Therefore, the numerator represents the basal area of trees lost between the two inventories. PBAR ranges from zero to one, with zero indicating no basal area removed, and one indicating one-hundred percent basal area removed. In this study, PBAR measures the loss of basal area from all possible causes, not differentiating disturbance types.
The relationship between reference disturbance intensity and spectral indices change was then established by a Random Forest model. The model was then used to produce wall-to-wall annual disturbance intensity maps.
See Lu et al. (2022) for further details.
Data Access
These data are available through the Oak Ridge National Laboratory (ORNL) Distributed Active Archive Center (DAAC).
NACP NAFD Project: Forest Disturbance Intensity for CONUS from Landsat, 1986-2015
Contact for Data Center Access Information:
- E-mail: uso@daac.ornl.gov
- Telephone: +1 (865) 241-3952
References
Goward, S.N., C. Huang, F. Zhao, K. Schleeweis, K. Rishmawi, M. Lindsey, J.L. Dungan, and A. Michaelis. 2015. NACP NAFD Project: Forest Disturbance History from Landsat, 1986-2010. ORNL DAAC, Oak Ridge, Tennessee, USA. https://doi.org/10.3334/ORNLDAAC/1290.
Huang, C., S.N. Goward, J.G. Masek, N. Thomas, Z. Zhu, and J.E. Vogelmann. 2010. An automated approach for reconstructing recent forest disturbance history using dense Landsat time series stacks. Remote Sensing of Environment 114:183–198. https://doi.org/10.1016/j.rse.2009.08.017.
Lu, J., C. Huang, X. Tao, W Gong and K Schleeweis. 2022. Annual forest disturbance intensity mapped using Landsat time series and field inventory data for the conterminous United States (1986–2015). Remote Sensing of Environment 275:113003. https://doi.org/10.1016/j.rse.2022.113003.
Schleeweis, K., G.G. Moisen, C. Toney, T.A. Schroeder, C. Huang, E.A. Freeman, S.N. Goward, and J.L. Dungan. 2020. NAFD-ATT Forest Canopy Cover Loss from Landsat, CONUS, 1986-2010. ORNL DAAC, Oak Ridge, Tennessee, USA. https://doi.org/10.3334/ORNLDAAC/1799.
Tao, X., C. Huang, F. Zhao, K. Schleeweis, J. Masek, & S. Liang. 2019. Mapping forest disturbance intensity in North and South Carolina using annual Landsat observations and field inventory data. Remote Sensing of Environment 221:351–362. https://doi.org/10.1016/j.rse.2018.11.029.