Documentation Revision Date: 2026-02-05
Dataset Version: 1
Summary
There are three files in GeoPackage format.
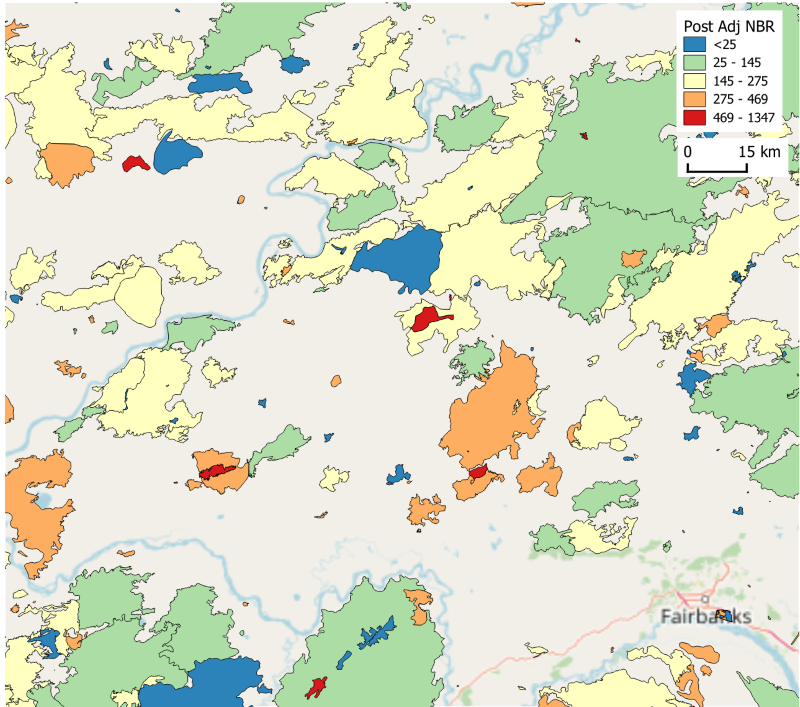
Figure 1. Portion of fire boundaries for North America (1986 to 2020) showing a region northwest of Fairbanks, Alaska. Polygon colors depict the post fire normalized burn ratio (NBR) after adding an adjustment value and scaled by 1000. Source: north_america_nbr_attributed_fires.gpkg
Citation
Graham, J.A., N.H.F. French, C. Cook, M. Billmire, and Q. Zhuang. 2026. Circumpolar Fire Polygons with NBR, dNBR, RdNBR Metrics and Ecoregions, 1986-2020. ORNL DAAC, Oak Ridge, Tennessee, USA. https://doi.org/10.3334/ORNLDAAC/2477
Table of Contents
- Dataset Overview
- Data Characteristics
- Application and Derivation
- Quality Assessment
- Data Acquisition, Materials, and Methods
- Data Access
- References
Dataset Overview
This dataset contains polygons of retrievable fire boundaries across the circumpolar region attributed with pre-fire and post-fire normalized burn ratio (NBR), differenced normalized burn ratio (dNBR), relative differenced normalized burn ratio (RdNBR), and terrestrial ecoregions. The dataset is separated into three regions: North America, Europe, and Asia; each saved in an appropriate projection and with the years of data available from that region. Historical fire perimeters were available from 1986 to 2020 for North America. Fires from Europe and Asia were available from 2003 to 2016. Polygon geometries were simplified and processed to represent each fire with a single polygon. Google Earth Engine was used to calculate the mean pre-fire and post-fire NBR both within the polygon and in a buffer around the fire. The buffer values were used to adjust NBR values to account for differences in reflectance between image acquisition dates not related to the fire.
Project: North American Carbon Program (NACP)
The North American Carbon Program (NACP) is a multidisciplinary research program designed to improve understanding of North America's carbon sources, sinks, and stocks. The central objective is to measure and understand the sources and sinks of Carbon Dioxide (CO2), Methane (CH4), and Carbon Monoxide (CO) in North America and adjacent oceans. The NACP is supported by a number of different federal agencies.
Related Publications
Xu, Y., Q. Zhuang, B. Zhao, M. Billmire, C. Cook, J. Graham, N.H. French, and R. Prinn. 2024. Impacts of wildfires on boreal forest ecosystem carbon dynamics from 1986 to 2020. Environmental Research Letters 19:064023. https://doi.org/10.1088/1748-9326/ad489a
Xu, Y., Q. Zhuang, B. Zhao, M. Billmire, C. Cook, J. Graham, N.H. French, and R. Prinn. 2025. OCO-2 constrained land carbon fluxes with local ensemble transform Kalman filter over circumpolar regions for 2015-2016. Ecosphere (In Review).
Acknowledgements
This work was supported by NASA's Carbon Cycle Science project (grant 80NSSC21K1710).
Data Characteristics
Spatial Coverage: Circumpolar north of 45 degrees N and eastern Canada south to the U.S. border
Spatial Resolution: 2 ha
Temporal Coverage: 1986-01-01 to 2020-12-31
Temporal Resolution: Annual
Study Area: Latitude and longitude are in decimal degrees and represent the bounding boxes in EPSG:4326.
| Study Area | Westernmost Longitude | Easternmost Longitude | Northernmost Latitude | Southernmost Latitude |
|---|---|---|---|---|
| Asiaa,b | 8.5394 | -170.2084 | 84.0575 | 37.6864 |
| Europeb | -32.7017 | 80.4008 | 76.7326 | 37.1585 |
| North Americaa | 179.7794 | -25.7442 | 84.0695 | 33.6975 |
aThis study area extends across the International Date Line (longitude 180).
bAll fire polygons in Asia and Europe are north of latitude 45 N.
Data File Information
There are three files in GeoPackage format that hold vector polygon features outlining fire events:
asia_nbr_attributed_fires.gpkg, europe_nbr_attributed_fires.gpkg, and north_america_nbr_attributed_fires.gpkg.
GeoPackage characteristics:
- Projected coordinate systems:
asia_nbr_attributed_fires.gpkg - WGS 1984 Albers for Northern Asia (ESRI:102025)
europe_nbr_attributed_fires.gpkg - ED 1950 Albers Europe (ESRI:102013)
north_america_nbr_attributed_fires.gpkg - NAD 1983 Albers North America (ESRI:102008) - Map units: meters
- Spatial resolution: polygon features with minimum of 2 ha
- Data type: Int64, Float64 or string (varies among attribute fields)
- Missing data values: -9999 for numeric attributes and "_na" for text attributes
- Scale factor: 1000 for all "nbr" attributes (Table 1)
Table 1. Polygon attributes in GeoPackage files.
| Attribute | Units | Description |
|---|---|---|
| year | YYYY | Year of the fire for the represented polygon |
| join_id | - | A unique ID carried over from the source files used to link the Google Earth Engine (GEE) attributions back with the geometry |
| area_ha | ha | The area of the fire polygon in hectares |
| perim_pre_nbr | 1 | The median calculated pre-fire normalized burn ratio (NBR) value for the polygon following the severity attribution methods |
| buff_pre_nbr | 1 | The median calculated pre-fire NBR value for the buffer around the fire polygon following the severity attribution methods |
| perim_post_nbr | 1 | The median calculated post-fire NBR value for the polygon following the severity attribution methods |
| buff_post_nbr | 1 | The median calculated post-fire NBR for the buffer around the fire polygon following the severity attribution methods |
| pre_post_adj | 1 | The value used to adjust for image differences not related to the fire. The difference between the pre-fire and post-fire NBR values in the buffered regions. |
| post_adj_nbr | 1 | The post-fire NBR after adding the adjustment value |
| dnbr_no_adj | 1 | Calculated differenced normalized burn ratio (dNBR) when ignoring the adjustment value |
| dnbr_adj | 1 | Calculated dNBR when implementing the adjustment value |
| rdnbr_no_adj | 1 | Calculated relative differenced normalized burn ratio (RdNBR) when ignoring the adjustment value |
| rdnbr_adj | 1 | Calculated RdNBR when implementing the adjustment value |
| is_imputed | - | A zero or one indicating if the resultant dNBR or RdNBR was an imputed value (1) due to missing pre-fire or post-fire NBR or calculated from the attribution methods |
| eco_code | - | The first two characters (letters) are the realm containing the ecoregion. The second two characters are the biome, and the last two characters are the ecoregion number. |
| eco_name | - | Ecoregion name (Olson et al., 2001) |
| eco_num | - | A unique number for each ecoregion within each biome nested within each realm. |
| wwf_realm | - | Acronym for each realm |
| wwf_realm2 | - | Name of each realm |
| wwf_mhtnum | - | Unique code for each biome |
| wwf_mhtnam | - | Name of each biomde |
| realmm_mht | - | Code combining realm as first to characters (letters) and biome code (numeric) |
| size_grp | - | Fire size group of each fire polygon: Very Small (0-50 ha), Small (50-100 ha), Medium (100-1,000 ha), Large (1,000-10,000 ha), and Very Large (>10,000 ha) |
Application and Derivation
This dataset is intended to be used to analyze broad-scale fire trends across time, space, and ecoregion.
Quality Assessment
Fire detection total area captured in this dataset was compared to the Arctic Boreal Burned Area (ABBA) product developed by Loboda et al (2024). The ABBA product provides annual cumulative end of season burned area in circumpolar boreal forests and tundra for the years 2002-2022. The algorithm used to develop this dataset was developed specifically for accurately detecting and mapping burned areas in boreal high northern latitude regions (HNL). The ABBA maps 40% more burned area than the MODIS or FireCCI fire products for the Arctic & boreal regions of interest.
The total mapped burned areas in this dataset were compared to total burned area provided by ABBA for all boreal (B) regions (defined here as all boreal systems >50 degrees latitude), all of Europe (E), all of Asia (A), and all of North America (NA) for each year where these datasets overlapped (2002-2020 for NA, 2003-2016 for E and A and B). For these available time intervals, the burned area product contains 175% of the burned area for all circumpolar boreal regions >50 degrees latitude (2.4 vs. 1.4 million km2, respectively), 7100% of the burned area for Europe >50 degrees latitude (45.0 vs. 0.6 million km2, respectively), 203% of the burned area for Asia >50 degrees latitude (2.0 vs. 0.99 million km2, respectively), and 103% of the total burned area for North America >50 degrees latitude (0.54 vs 0.53 million km2, respectively).
Deviations between these two burn products were determined to be largely due to the inclusion (this dataset) or exclusion (ABBA) of small agriculture-related fires and fires outside the boreal zone in the burned area products, respectively. This difference is revealed through the spatial context of these mapped fires including, for instance, how the vast preponderance of these fires in this dataset in each region are between 50 and 60 degrees latitude (tending to be more hospitable and arable), how the fires recorded tend to be very small (<10 ha in size), and how the total burn areas are much more similar to one another for regions identified as 'forested' in the IGBP land cover classification compared to regions not identified as 'forested'. The authors of the ABBA product have confirmed that they sought to avoid inclusion of small fires related to agriculture, removing these fires from their burned area product but also solely looking at fires in the boreal region. This product sought to map all fires >50 degrees latitude, leading to the inclusion of many fires not within the boreal zone and fires related to agriculture, especially in Europe.
Additional analyses were performed after observing that many fires show a 'negative' dNBR value. A negative dNBR value indicates enhanced regrowth of the burn area, and the analysis sought to review why so many fires showed this signal. These negative dNBR values were typically associated with small agriculture fires, and the negative dNBR value was frequently related to the pre-post buffer ring normalization value applied to the fire. Small fires showed the widest distribution for this buffer value, likely due to patterns emerging in seasonal composites due to agricultural practices (enhanced regrowth or alternatively harvesting from growing crops in regions adjacent to the fire detection).
Data Acquisition, Materials, and Methods
Fire Perimeter Data Sources and Preprocessing
Historical fire perimeters were attempted to be retrieved from 1986 to 2020. Due to data availability, this date range was only readily achievable from North America (Canada, Alaska, and contiguous USA), and fires from Eurasia were available from 2003 to 2016. The fire perimeters were gathered from these data sources:
- Alaska: Alaska Interagency Coordination Center (AICC; https://fire.ak.blm.gov), Alaska Fire Service (https://www.blm.gov/programs/fire-and-aviation/regional-info/alaska-fire-service)
- United States: USGS Combined wildland fire datasets (Welty and Jeffries, 2021)
- Canada: Canadian National Fire Database (CNFDB)
- Eurasia: GFED Global Fire Atlas (Andela et al., 2019).
Prior to uploading to Google Earth Engine (GEE) the perimeters were pre-processed to make them suitable for GEE; each fire perimeter was given a fire severity metric. Reasons for pre-processing include: invalid geometries, duplicated unique fire IDs, same year adjacent or overlapping fires with different fire IDs, prohibitively complex geometries, artificial holes within perimeters, extremely small polygons, and other various artifacts.
Due to differences in how the perimeter geometry was derived, Alaska and Canada fires were pre-processed differently than the Eurasian perimeters. The Alaskan, contiguous US, and Canadian perimeters were created through a combination of methods over the period of interest, with older fires (pre-Landsat) requiring field data and aerial imagery, and more recent fires satellite derived. As reported by the US Bureau of Land Management (BLM), from 1987 to 2015 emphasis was placed on mapping wildfires larger than 100 acres. From 2016 forward, fires over 10 acres were confidently mapped with delineations ranging in quality from hand sketched perimeters drawn using topographic maps to heads-up interpretation of fine scale satellite imagery (e.g., Sentinel-2 imagery, 10 meter resolution).
In general, Alaska and Canada fire perimeter creation involved a mix of digitization of data from field surveys, aerial surveys, and both hand-digitized and automated retrievals from satellite imagery, varying by location and changes in available data sources. It was apparent from the Canada fire perimeter datasets that Canada uses some automated fire extraction (e.g., the Multi-Acquisition Fire Mapping System (MAFiMS)), and this process has been used on all datasets back to at least 1986 (the period of interest in this study) to capture fires in more remote areas (e.g., the Northwest Territories) that may not have been originally documented the year that the fire occurred. Alaska did not appear to use automated tools to delineate fire perimeters, instead creating initial fire events that it then manually digitizes using image interpretation of Landsat, VIIRS, or Sentinel-2 imagery (in more recent years).
As reported by Welty and Jeffries (2020), the contiguous USA historic fire dataset was derived by merging and dissolving 12 different original wildfire datasets to create the most comprehensive wildfire dataset available.
The Eurasian 2003-2016 fire perimeters, extracted from Andela et al. (2019), were derived from the Global Fire Atlas algorithm with day of burn information collected from the MODIS MCD64A1 500m burned area product (Giglio et al., 2021). This algorithm and dataset tracks day-to-day changes in individual fires using MODIS, providing information like fire ignition location, size, duration, expansion and speed, and ultimately the fire perimeter. Global fire shapefiles are then made available for the whole world yearly, and at time of writing data were available for years 2003-2016.
Due to the number of polygons in the Eurasian dataset, the dataset was split into a Europe and an Asian dataset to speed processing. Preprocessing for all regions started with using the repair geometry tool in QGIS (version 3) to fix invalid geometries. The remaining processing used Python 3 with the geopandas library. Prior to processing, each dataset was projected into its respective Albers Equal Area Conic projection, North America (ESRI: 102008), Europe (ESRI: 102013), and Asia North (ESRI: 102025).
Preprocessing steps for the North American dataset were as follows: do a series of sequential dissolves, first by the unique fire ID variable, and second by the year of fire variable, to fix issues regarding fire ID uniquity; then simplify the geometry to within 60 meters to speed future processes. Preprocessing steps for the Eurasian datasets were as follows: for each year add a 10-m buffer to perimeters connect unique perimeters that were touching; dissolve the features to join the perimeters; and explode disjoint perimeters back to unique polygons. Lastly, only fires greater than 2 ha were included.
Fire Perimeter Severity Attribution
After preprocessing, each dataset (NA, Europe, Asia) consists of a polygon geometry, and attributes of: a unique ID, year of fire, and fire size in ha. GEE code was developed to calculate a pre-fire and post-fire NBR value from within each perimeter, and from within a 300-m buffer ring offset 1.5 km from the perimeter. Data are sourced from Landsat 4-8 collections using median pixel values after applying a cloud, cloud shadow, snow, and water mask. Pre-fire data used the median pixel values from the image collection from June 15 to September 15 of the year before the fire and two years before the fire. Post-fire data used the median pixel values from the image collection June 15 to September 15 of the year following the fire. The median pixel values from within the perimeter and buffer ring were averaged to create a prefire NBR and postfire NBR for each perimeter and buffer ring. These values were exported from GEE along with each unique fire ID. Methods in the GEE code for masking and pooling the Landsat 4-8 data were sourced from Holsinger et al. (2021).
Calculation of adjusted dNBR and RdNBR
The normalized burn ratio (NBR) was calculated as (NIR - SWIR) / (NIR + SWIR). All NBR-related metrics were scaled by 1000.
The values in the buffer ring are used to correct for differences between the imagery not related to the fire (eg, phenology, plant health), as this land area is assumed to not have burned. One caveat is that in some areas that had nearby fires within the same year, there may be some overlap between the buffer ring and another fire perimeter; however, these cases are uncommon. The amount that the post-fire NBR differs due to imagery differences is calculated as the prefire NBR minus the post-fire NBR within the buffers. This value is then added to the post-fire NBR value within the perimeter. Adjusted dNBR is then calculated within perimeter as pre-fire NBR minus the adjusted post-fire NBR value. Adjusted RdNBR is calculated as the adjusted dNBR divided by (the square root of the absolute value of (pre-fire NBR / 1000)).
Ecoregion, fire size group attribution, and missing value imputation
Each fire polygon was joined with the WWF Terrestrial Ecoregions of the World product (Olson et al., 2001). In cases where a fire perimeter spanned multiple ecoregions, the ecoregion comprising the most area was used. Due to the coarse nature of the ecoregion product, some perimeters did not intersect an ecoregion and were not attributed with an ecoregion. Although rare, the majority of these cases were along coasts or on islands away from the mainland. An additional field (size_grp) was populated by categorizing the fire size into five groups: Very Small (0-50 ha), Small (50-100 ha), Medium (100-1,000 ha), Large (1,000-10,000 ha), and Very Large (>10,000 ha).
Unadjusted dNBR and RdNBR could not be calculated in cases where median NBR values for either the pre-fire, post-fire, or buffer polygons were not able to be computed in GEE. To impute missing values data, a hierarchical approach was adopted. The first level of imputation used the mean values from fires within the same year, size grouping, and ecoregion. Where those criteria were unable to develop a mean value (no other fires in the same region, year, and size group), the greater WWF Realm was used instead of the more narrow ecoregion. Any still missing values were then imputed using the mean of the year and size group. If a value was imputed for a fire perimeter, it is recorded in the is_imputed field in the geopackage.
Data Access
These data are available through the Oak Ridge National Laboratory (ORNL) Distributed Active Archive Center (DAAC).
Circumpolar Fire Polygons with NBR, dNBR, RdNBR Metrics and Ecoregions, 1986-2020
Contact for Data Center Access Information:
- E-mail: uso@daac.ornl.gov
- Telephone: +1 (865) 241-3952
References
Andela, N., D.C. Morton, L. Giglio, and J.T. Randerson. 2019. Global Fire Atlas with Characteristics of Individual Fires, 2003-2016. ORNL DAAC, Oak Ridge, Tennessee, USA. https://doi.org/10.3334/ORNLDAAC/1642
Loboda, T.V., J. Hall, D. Chen, A. Hoffman-Hall, V. Shevade, F. Argueta, and X. Liang. 2024. Arctic Boreal Burned Area (ABBA) Product, Circumpolar Boreal Forests and Tundra, Version 2. PANGAEA. https://doi.org/10.1594/PANGAEA.965193
Giglio, L., C. Justice, L. Boschetti, and D. Roy. 2021. MODIS/Terra+Aqua Burned Area Monthly L3 Global 500m SIN Grid V061. NASA Land Processes DAAC, Sioux Falls, South Dakota, USA. https://doi.org/10.5067/MODIS/MCD64A1.061
Holsinger, L.M., S.A. Parks, L.B. Saperstein, R.A. Loehman, E. Whitman, J. Barnes, and M. Parisien. 2021. Improved fire severity mapping in the North American boreal forest using a hybrid composite method. Remote Sensing in Ecology and Conservation 8:222–235. https://doi.org/10.1002/rse2.238
Olson, D.M., E. Dinerstein, E.D. Wikramanayake, N.D. Burgess, G.V.N. Powell, E.C. Underwood, J.A. D'Amico, I. Itoua, H.E. Strand, J. C. Morrison, C.J. Loucks, T.F. Allnutt, T. H. Ricketts, Y. Kura, J.F. Lamoreux, W. W. Wettengel, P. Hedao, and K.R. Kassem. 2001. Terrestrial ecoregions of the world: a new map of life on Earth. Bioscience 51:933-938. https://doi.org/10.1641/0006-3568(2001)051[0933:TEOTWA]2.0.CO;2
Parks, S.A., L.M. Holsinger, M.A. Voss, R.A. Loehman, and N.P. Robinson. 2018. Mean composite fire severity metrics computed with Google Earth Engine offer improved accuracy and expanded mapping potential. Remote Sensing 10:879. https://doi.org/10.3390/rs10060879
Welty, J.L., and M.I. Jeffries. 2020. Combined wildfire datasets for the United States and certain territories, 1878-2019. U.S. Geological Survey. https://doi.org/10.5066/P9Z2VVRT
Xu, Y., Q. Zhuang, B. Zhao, M. Billmire, C. Cook, J. Graham, N.H. French, and R. Prinn. 2024. Impacts of wildfires on boreal forest ecosystem carbon dynamics from 1986 to 2020. Environmental Research Letters 19:064023. https://doi.org/10.1088/1748-9326/ad489a
Xu, Y., Q. Zhuang, B. Zhao, M. Billmire, C. Cook, J. Graham, N.H. French, and R. Prinn. 2025. OCO-2 constrained land carbon fluxes with local ensemble transform Kalman filter over circumpolar regions for 2015-2016. Ecosphere (In Review).