Documentation Revision Date: 2021-03-23
Dataset Version: 1.0
Summary
The locations of 1,727 dairy farms in California were determined by inspection of Google Earth satellite imagery. Enteric emissions at
each dairy were derived from the number of cattle, dry matter intake, neutral detergent fiber in the diet, and milkfat at the dairy.
Estimates of herd numbers and demographic categories came from three sources, the Regional Water Quality Control Board, San
Joaquin Valley Air Pollution Control Board, and the US Department of Agriculture National Agricultural Statistics Survey. Manure
management emissions were estimated by applying equations of the California Air Resources Board to the facility level with data from
the San Joaquin Valley Air Pollution Control District permits, local animal management data, and regional differences in manure
management.
There are 3 files in GeoTIFF (*.tif) format.
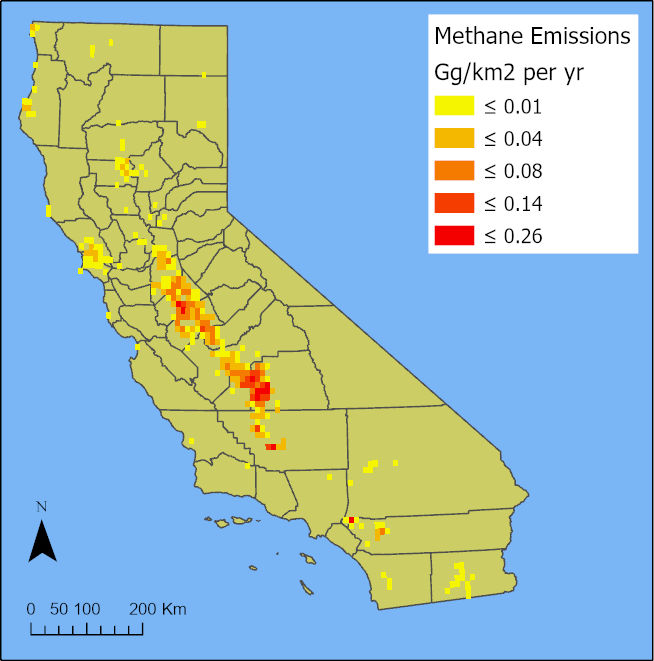
Figure 1. Total annual methane emissions in 2019 from dairy farms in California. These values represent the sum of emissions from enteric fermentation and manure management practices. Units are Gg per square kilometer per year. Source: total_CH4_CA_2019.tif
Citation
Marklein, A.R., D. Meyer, M.L. Fischer, S. Jeong, T. Rafiq, M. Carr, and F.M. Hopkins. 2020. Methane Emissions from Dairy Sources (Vista-CA), State of California, USA, 2019. ORNL DAAC, Oak Ridge, Tennessee, USA. https://doi.org/10.3334/ORNLDAAC/1814
Table of Contents
- Dataset Overview
- Data Characteristics
- Application and Derivation
- Quality Assessment
- Data Acquisition, Materials, and Methods
- Data Access
- References
- Dataset Revisions
Dataset Overview
This dataset provides estimates of methane (CH4) emissions from dairies in California at a resolution of 0.1 degrees (~ 10 km x 10 km) for the year 2019. The mapped sources of dairy CH4 emissions are enteric fermentation and manure management reported in gigagrams per year (Gg/yr). The sum of the two sources is also provided. These data are in the succession of Vista California (Vista-CA) spatial datasets that have identified and classified potential methane source emitters in California and were created utilizing an assortment of publicly available data sources from local, state, and federal agencies. This dataset can serve as a planning tool for mitigation, a prior for atmospheric observation-based emissions estimates, attribution of emissions to a specific facility, and to validate CH4 emissions reductions from management changes.
The locations of 1,727 dairy farms in California were determined by inspection of Google Earth satellite imagery. Enteric emissions at
each dairy were derived from the number of cattle, dry matter intake, neutral detergent fiber in the diet, and milkfat at the dairy.
Estimates of herd numbers and demographic categories came from three sources, the Regional Water Quality Control Board, San
Joaquin Valley Air Pollution Control Board, and the US Department of Agriculture National Agricultural Statistics Survey. Manure
management emissions were estimated by applying equations of the California Air Resources Board to the facility level with data from
the San Joaquin Valley Air Pollution Control District permits, local animal management data, and regional differences in manure
management.
Project: North American Carbon Program
The North American Carbon Program (NACP) is a multidisciplinary research program designed to improve understanding of North America's carbon sources, sinks, and stocks. The central objective is to measure and understand the sources and sinks of Carbon Dioxide (CO2), Methane (CH4), and Carbon Monoxide (CO) in North America and adjacent oceans. The NACP is supported by a number of different federal agencies.
Related Publication:
Marklein, A. R., Meyer, D., Fischer, M. L., Jeong, S., Rafiq, T., Carr, M., and Hopkins, F. M. 2020. Facility scale inventory of dairy methane emissions in California: Implications for mitigation. Earth System Science Data, in press. https://doi.org/10.5194/essd-2020-133
Related Datasets:
Carranza, V., T. Rafiq, I. Frausto-Vicencio, F. Hopkins, K.R. Verhulst, P. Rao, R.M. Duren, and C.E. Miller. 2018. Sources of Methane Emissions (Vista-LA), South Coast Air Basin, California, USA. ORNL DAAC, Oak Ridge, Tennessee, USA. https://doi.org/10.3334/ORNLDAAC/1525
Hopkins, F.M., T. Rafiq, and R.M. Duren. 2019. Sources of Methane Emissions (Vista-CA), State of California, USA. ORNL DAAC, Oak Ridge, Tennessee, USA. https://doi.org/10.3334/ORNLDAAC/1726
Thorpe, A.K., B.D. Bue, D.R. Thompson, and R.M. Duren. 2019. Methane Plumes Derived from AVIRIS-NG over Point Sources across California, 2016-2017. ORNL DAAC, Oak Ridge, Tennessee, USA. https://doi.org/10.3334/ORNLDAAC/1727
Acknowledgments:
This work was supported by the University of California Office of the President (grant LFR-18-548581) and NASA’s Advancing Collaborative Connections for Earth System Science (ACCESS) Methane Source Finder (grant 15-ACCESS15-0034). The authors acknowledge the dairy farmers who provided information to the permits and reports, as well as the San Joaquin Valley and Santa Ana Air Quality Control Boards, California Integrated Water Quality System, and Regional Water Quality Control Boards.
Data Characteristics
Spatial Coverage: California, USA
Spatial Resolution: 0.1 degree (10 km)
Temporal Coverage: 2019-01-01 to 2019-12-31
Temporal Resolution: One-time annual estimate
Study Area: Latitude and longitude are given in decimal degrees.
| Site | Northernmost Latitude | Southernmost Latitude | Easternmost Longitude | Westernmost Longitude |
|---|---|---|---|---|
| California | 42.25 | 32.25 | -114.15 | -124.45 |
Data File Information
There are 3 files in GeoTIFF (*.tiff) format (Table 1).
Table 1. File names and descriptions.
| File Names | Units | Description |
|---|---|---|
| enteric_CH4_CA_2019.tif | Gg/yr | enteric fermentation methane (CH4) emissions (in gigagrams per year) from dairy farms in California |
| manure_CH4_CA_2019.tif | Gg/yr | manure management methane (CH4) emissions (in gigagrams per year) from dairy farms in California |
| total_CH4_CA_2019.tif | Gg/yr | the sum of manure management and enteric fermentation methane (CH4) emissions (in gigagrams per year) from dairy farms in California |
Data File Details
For all files:
The data type is Float64.
Missing values are represented by -9999.
Each file contains 95 rows and 103 columns.
The projection used is "WGS 84" (EPSG:4326).
Application and Derivation
Dairies emit roughly half of total CH4 emissions in California, generating CH4 from enteric fermentation by ruminant gut microbes and
anaerobic decomposition of manure. Representation of these emission processes is essential for the management and mitigation of
CH4 emissions and is typically done using standardized emission factors applied at large spatial scales (e.g., state-level). However,
CH4-emitting activities and management decisions vary across facilities, and current inventories do not have a sufficiently high spatial
resolution to capture changes at this scale. In addition to serving as a planning tool for mitigation, this dataset is useful as a prior for
atmospheric observation-based emissions estimates, attribution of emissions to a specific facility, and to validate CH4 emissions
reductions from management changes.
Quality Assessment
To estimate facility-scale uncertainty for enteric fermentation emissions, the standard error in dry matter intake, neutral detergent
fiber, milkfat was calculated. The facility-scale uncertainty in manure management emissions was estimated by propagating
uncertainty in terms of the number of cows, the fraction of time on concrete, volatile solids production, the methane conversion factor
(MCF), and the fraction of material used as bedding. The standard error of each variable was determined through the emissions
calculations equations, assuming the errors were uncorrelated.
Data Acquisition, Materials, and Methods
Vista-California
Vista-CA spatial datasets identify and classify potential methane source emitters in California. Vista-CA spatial datasets were created utilizing an assortment of publicly available data sources ranging from local, state, and federal agencies. See Marklein et al. (2020) for more details.
Methane Emissions from Dairies
This data set provides spatial data products with enteric fermentation and manure methane emissions from dairies in California.
Dairies emit roughly half of total methane (CH4) emissions in California, generating CH4 from both enteric fermentation by ruminant
gut microbes and anaerobic decomposition of manure. Representation of these emission processes is essential for management and
mitigation of CH4 emissions and is typically done using standardized emission factors applied at large spatial scales (e.g., state-level). However, CH4-emitting activities and management decisions vary across facilities, and current inventories do not have sufficiently high spatial resolution to capture changes at this scale. To create this data set, we disaggregate the California Air Resources Board (CARB) inventory to the facility level by 1) developing a spatially-explicit map of dairy locations, 2) applying facility-level information from regulatory permit data and county-level animal inventories to estimate herd sizes; and 3) estimating enteric and manure CH4 emissions from dairy facilities based on manure management from permit data and regional norms.
Data Sources
Google Earth satellite imagery was used to determine the locations of 1,727 dairy farms in California, by identifying metal-topped
shelters alongside manure lagoons and corrals (Duren et al., 2019).
Data from three sources were used to estimate herd numbers and demographic categories at each dairy. First, the Regional Water
Quality Control Board reports provided the number of milk cows, dry cows, heifers, and calves for dairies in the Central Valley and
Southern California for the year 2005 (RWQCB, 2013). Second, San Joaquin Valley Air Pollution Control Board permits include the
maximum number of cattle in each class at a given facility, based on facility housing in 2011, rather than the number of animals
(SJVAPCD, 2004). Third, the 2017 US Department of Agriculture (USDA) National Agricultural Statistics Survey (NASS) provided the
number of farms and the number of cows in different dairy size classes in each county (USDA NASS, 2017).
Estimates of enteric fermentation CH4 emissions were based on calculations by Appuhamy et al. (2019). Enteric emissions included the number of cattle, dry matter intake, neutral detergent fiber in the diet, and milk fat. Manure management emissions were estimated using equations by the California Air Resources Board to the facility level (CARB, 2014), data from the San Joaquin Valley Air Pollution Control District permits (SJVAPCD, 2004), animal management data (Meyer, 2019), and regional differences in manure management.
Processing
Results were aggregated to a resolution of 0.1 degrees to protect the identity and characteristics of dairy farms. Dairy locations are available in Carranza et al. (2018b) (for SCAB) and Hopkins et al. (2019) (state-wide). For more information, refer to Marklein et al. (2020).
Uncertainty Analysis:
Total uncertainty in CH4 emissions at the facility scale is 14.4%; 84.1% of the uncertainty is due to uncertainty in manure emissions, while 15.9% of the uncertainty is due to enteric emissions. We report the statewide uncertainty in enteric emissions to be 20%. The facility-level standard errors for enteric fermentation we calculated are 35.6%, and is most sensitive to dry matter intake, followed by the number of animals. We report the statewide uncertainty in manure emissions to be 30%. The facility-level standard errors for manure emissions we calculated is 55.4%, and is most sensitive to the lagoon methane conversion factor, followed by the number of animals, and the fraction of manure allocated to bedding.
Data Access
These data are available through the Oak Ridge National Laboratory (ORNL) Distributed Active Archive Center (DAAC).
Methane Emissions from Dairy Sources (Vista-CA), State of California, USA, 2019
Contact for Data Center Access Information:
- E-mail: uso@daac.ornl.gov
- Telephone: +1 (865) 241-3952
References
Appuhamy, Ranga, and E. Kebreab. 2018. Characterizing California-specific Cattle Feed Rations and Improve Modeling of Enteric Fermentation for California's Greenhouse Gas Inventory. California Environmental Protection Agency, Air Resources Board, Research Division. https://ww2.arb.ca.gov/sites/default/files/classic//research/apr/past/16rd001.pdf
CARB. 2014. California’s 2000-2012 Greenhouse Gas Emissions Inventory Technical Support Document, 2014 Edition. California Air Resources Board, Air Quality Planning and Science Division. https://ww3.arb.ca.gov/cc/inventory/pubs/reports/2000_2012/ghg_inventory_00-12_technical_support_document.pdf
Carranza, V., T. Rafiq, I. Frausto-Vicencio, F. Hopkins, K.R. Verhulst, P. Rao, R.M. Duren, and C.E. Miller. 2018a. Vista-LA: Mapping methane-emitting infrastructure in the Los Angeles megacity. Earth System Science Data, 10(1):653-676, https://doi.org/10.5194/essd-10-653-2018.
Carranza, V., T. Rafiq, I. Frausto-Vicencio, F. Hopkins, K.R. Verhulst, P. Rao, R.M. Duren, and C.E. Miller. 2018b. Sources of Methane Emissions (Vista-LA), South Coast Air Basin, California, USA. ORNL DAAC, Oak Ridge, Tennessee, USA. https://doi.org/10.3334/ORNLDAAC/1525
Duren, R.M., A.K. Thorpe, K.T. Foster, T. Rafiq, F.M. Hopkins, V. Yadav, B.D. Bue, D.R. Thompson, S. Conley, N.K. Colombi, C. Frankenberg, I.B. McCubbin, M.L. Eastwood, M. Falk, J.D. Herner, B.E. Croes, R.O. Green, and C.E. Miller. 2019. California’s methane super-emitters. Nature 575:180-184. https://doi.org/10.1038/s41586-019-1720-3
Hopkins, F.M., T. Rafiq, and R.M. Duren. 2019. Sources of Methane Emissions (Vista-CA), State of California, USA. ORNL DAAC, Oak Ridge, Tennessee, USA. https://doi.org/10.3334/ORNLDAAC/1726
Marklein, A.R., D. Meyer, M.L. Fischer, S. Jeong, T. Rafiq, M. Carr, and F.M. Hopkins. 2020 Facility scale inventory of dairy methane emissions in California: Implications for mitigation. Earth System Science Data, in press. https://doi.org/10.5194/essd-2020-133
Meyer, D, J. Heguy, B. Karle, and P. Robinson. 2019. Characterize Physical and Chemical Properties of Manure in California Dairy Systems to Improve Greenhouse Gas Emission Estimates. California Environmental Protection Agency, Air Resources Board. https://ww2.arb.ca.gov/sites/default/files/classic//research/apr/past/16rd002.pdf
RWQCB. 2013. Reissued Waste Discharge Requirements General Order for Existing Milk Cow Dairies (Reissued Dairy General Order). Confined Animal Facilities - Dairy Program Regulations and Requirements, Order R5-2013-0122. Regional Water Quality Control Board, Central Valley. https://www.waterboards.ca.gov/centralvalley/board_decisions/adopted_orders/general_orders/r5-2013-0122.pdf
SJVAPCD. 2004. Best Available Control Technology (BACT) Dairy Operations. San Joaquin Valley Air Pollution Control Board. https://www.valleyair.org/farmpermits/updates/draft_dairy_bact.pdf
USDA NASS. 2017. Census of Agriculture. United States Department of Agriculture National Agricultural Statistics Service. https://www.nass.usda.gov/Publications/AgCensus/2017/index.php
Dataset Revisions