Documentation Revision Date: 2025-03-26
Dataset Version: 1
Summary
This dataset holds 17 files in netCDF version 4 format.
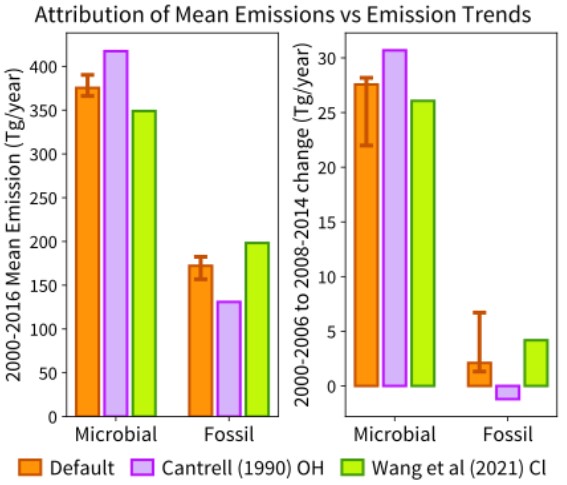
Figure 1. Methane emissions estimates and trends for microbial and fossil fuel sources. The left panel shows estimates of mean methane emissions from this study as orange bars. Purple and green bars show alternative estimates from atmospheric chemistry from Cantrell (1990) and Wang et al. (2021); these estimates are outside of the error bars for mean estimates from this study. The right panel shows trends in emissions before and after 2007. The majority contribution to trends came from microbial sources.
Citation
Basu, S., X. Lan, S.E. Michel, E. Dlugokencky, and S. Schwietzke. 2025. TM5-4DVAR Global Monthly Source-disaggregated Methane Emissions, 1999-2016. ORNL DAAC, Oak Ridge, Tennessee, USA. https://doi.org/10.3334/ORNLDAAC/2411
Table of Contents
- Dataset Overview
- Data Characteristics
- Application and Derivation
- Quality Assessment
- Data Acquisition, Materials, and Methods
- Data Access
- References
Dataset Overview
This dataset holds estimates of methane emissions derived from a dual tracer inversion of atmospheric measurements of CH4 mole fractions and δ13CH4 isotopic values. The measurements were assimilated in the TM5-4DVAR source-sink inversion system to estimate methane emissions from fossil fuel, microbial, and pyrogenic sources. These estimates include monthly means of methane emissions from each source and all three sources combined at 1-degree longitude x 1-degree latitude spatial resolution globally and monthly totals across all global grid cells from each source and all three sources combined from 1999 to 2016.
Project: North American Carbon Program
The North American Carbon Program (NACP) is a multidisciplinary research program designed to improve understanding of North America's carbon sources, sinks, and stocks. The central objective is to measure and understand the sources and sinks of Carbon Dioxide (CO2), Methane (CH4), and Carbon Monoxide (CO) in North America and adjacent oceans. The NACP is supported by a number of different federal agencies.
Related Publications
Basu, S., X. Lan, E. Dlugokencky, S. Michel, S. Schwietzke, J.B. Miller, L. Bruhwiler, Y. Oh, P.P. Tans, F. Apadula, L.V. Gatti, A. Jordan, J. Necki, M. Sasakawa, S. Morimoto, T. Di Iorio, H. Lee, J. Arduini, and G. Manca. 2022. Estimating emissions of methane consistent with atmospheric measurements of methane and δ13C of methane. Atmospheric Chemistry and Physics 22:15351–15377. https://doi.org/10.5194/acp-22-15351-2022
Lan, X., S. Basu, S. Schwietzke, L.M. P. Bruhwiler, E.J. Dlugokencky, S.E. Michel, O.A. Sherwood, P.P. Tans, K. Thoning, G. Etiope, Q. Zhuang, L. Liu, Y. Oh, J.B. Miller, G. Pétron, B.H. Vaughn, and M. Crippa. 2021. Improved constraints on global methane emissions and sinks using δ13C-CH4. Global Biogeochemical Cycles 35:e2021GB007000. https://doi.org/10.1029/2021GB007000
Acknowledgements
This research was supported by NASA's Carbon Cycle and Ecosystem program (grant NNX17AK20G).
Data Characteristics
Spatial Coverage: Global
Spatial Resolution: 1 degree x 1 degree
Temporal Coverage: 1999-01 to 2016-12
Temporal Resolution: Monthly
Study Area: Latitude and longitude are given in decimal degrees.
| Site | Westernmost Longitude | Easternmost Longitude | Northernmost Latitude | Southernmost Latitude |
|---|---|---|---|---|
| Global | -180 | 180 | 90 | -90 |
Data File Information
This dataset holds 17 files in netCDF format. Each file contains three gridded variables, “fossil”, “microbial”, and “pyrogenic”, that contains methane emissions estimates from those three source types. Also provided is “total”, or the sum of the three sources, which represents all methane emissions. For debugging purposes, the global total monthly emissions from each of these four gridded variables are provided in “_global_sum” variables, and the surface area of the grid used to perform this calculation is provided in the “surface_area” variable (Table 1).
The files are named TM5_4DVAR_global_methane_emis_<YYYY>.nc, where <YYYY> is the year from 1999 to 2016.
Table 1. Variables in the netCDF files.
| Variable | Units | Description |
|---|---|---|
| fossil | g m-2 y-1 | Monthly mean methane emissions from fossil sources for each 1-degree grid cell |
| fossil_global_sum | Tg | Monthly global sum of methane emissions from fossil sources |
| microbial | g m-2 y-1 | Monthly mean methane emissions from microbial activity for each 1-degree grid cell |
| microbial_global_sum | Tg | Monthly global sum of methane emissions from microbial activity |
| pyrogenic | g m-2 y-1 | Monthly mean methane emissions from pyrogenic sources for each 1-degree grid cell |
| pyrogenic_global_sum | Tg | Monthly global sum of methane emissions from pyrogenic sources |
| total | g m-2 y-1 | Monthly mean methane emissions from fossil, microbial, and pyrogenic sources for each 1-degree grid cell |
| total_global_sum | Tg | Monthly global sum of methane emissions from fossil, microbial, and pyrogenic sources |
| latitude | degrees north | Latitude center of grid cell |
| longitude | degrees east | Longitude center of grid cell |
| surface_area | m2 | Area of each 1-degree grid cell |
| time | d | Middle day of each monthly time step in "days since 1999-01-01" |
| time_bnds | d | Beginning and ending day of each monthly time step in "days since 1999-01-01" |
Application and Derivation
Traditional CH4-only atmospheric inversions are unlikely to estimate emissions consistent with atmospheric δ13C data, and assimilating δ¹³C data is necessary to derive emissions consistent with both measurements. This framework attributes approximately 85% of the post-2007 growth in atmospheric methane to microbial sources, with about half of that coming from the tropics between 23.5° N and 23.5° S. This result contradicts the attribution of the recent growth in the methane budget of the Global Carbon Project (GCP). The GCP attribution is only consistent with a top-down estimate in the absence of δ13C data. At global and continental scales, δ13C data can separate microbial from fossil methane emissions much better than CH4 data alone, and at finer scales, this ability is limited by the current δ¹³C measurement coverage.
The largest uncertainty in using δ¹³C data to separate different methane source types came from knowledge of atmospheric chemistry, specifically the distribution of tropospheric chlorine and the isotopic discrimination of the methane sink.
Quality Assessment
The uncertainty of surface emission estimates is a combination of random and systematic uncertainties. Random uncertainties are associated with components of the inversion system whose errors are assumed to be zero on average. Systematic uncertainties are associated with aspects of the inversion system that are assumed to be fixed and perfectly known in principle but might in fact be biased in practice. In this inversion system, such aspects include, but are not limited to, atmospheric transport and chemistry, isotope source signatures, and the wetland inundation maps used to construct the prior wetland emissions. Because the posterior covariance estimate does not include systematic errors, the impact of such errors was explored by performing inversions with different realizations of potentially biased inputs in the sensitivity tests, including tropospheric chlorine, OH fractionation, δ13C source signatures, extent of wetland inundation, and initial δ13C gradients. See Basu et al. (2022) for details of this uncertainty analysis.
Data Acquisition, Materials, and Methods
In order to estimate source-specific methane emissions, measurements of methane and δ¹³C of methane were assimilated using an atmospheric inversion framework based on TM5-4DVAR (Meirink et al., 2008). Global emission estimates from this framework are provided for 1999 to 2016. The analysis used a newly constructed, multi-agency database of CH4 and δ13C measurements.
See Basu et al. (2022) for methods used to generate these estimates.
Data Access
These data are available through the Oak Ridge National Laboratory (ORNL) Distributed Active Archive Center (DAAC).
TM5-4DVAR Global Monthly Source-disaggregated Methane Emissions, 1999-2016
Contact for Data Center Access Information:
- E-mail: uso@daac.ornl.gov
- Telephone: +1 (865) 241-3952
References
Basu, S., X. Lan, E. Dlugokencky, S. Michel, S. Schwietzke, J.B. Miller, L. Bruhwiler, Y. Oh, P.P. Tans, F. Apadula, L.V. Gatti, A. Jordan, J. Necki, M. Sasakawa, S. Morimoto, T. Di Iorio, H. Lee, J. Arduini, and G. Manca. 2022. Estimating emissions of methane consistent with atmospheric measurements of methane and δ13C of methane. Atmospheric Chemistry and Physics 22:15351–15377. https://doi.org/10.5194/acp-22-15351-2022
Dlugokencky, E., S. Michel, X. Lan, and S. Basu, NOAA Global Monitoring Laboratory, and University Of Colorado Institute Of Arctic And Alpine Research (INSTAAR). 2021. Database of methane (CH4) abundance and its stable carbon isotope (d13CH4) composition from atmospheric measurements. NOAA GML. https://doi.org/10.15138/64w0-0g71
Lan, X., S. Basu, S. Schwietzke, L.M. P. Bruhwiler, E.J. Dlugokencky, S.E. Michel, O.A. Sherwood, P.P. Tans, K. Thoning, G. Etiope, Q. Zhuang, L. Liu, Y. Oh, J.B. Miller, G. Pétron, B.H. Vaughn, and M. Crippa. 2021. Improved constraints on global methane emissions and sinks using δ13C-CH4. Global Biogeochemical Cycles 35:e2021GB007000. https://doi.org/10.1029/2021GB007000
Meirink, J.F., P. Bergamaschi, and M.C. Krol. 2008. Four dimensional variational data assimilation for inverse modelling of atmospheric methane emissions: method and comparison with synthesis inversion. Atmospheric Chemistry and Physics 8:6341–6353.
https://doi.org/10.5194/acp-8-6341-2008