Documentation Revision Date: 2021-12-06
Dataset Version: 1
Summary
There are 925 data files in NetCDF version 4 (*.nc4) format included in this dataset.
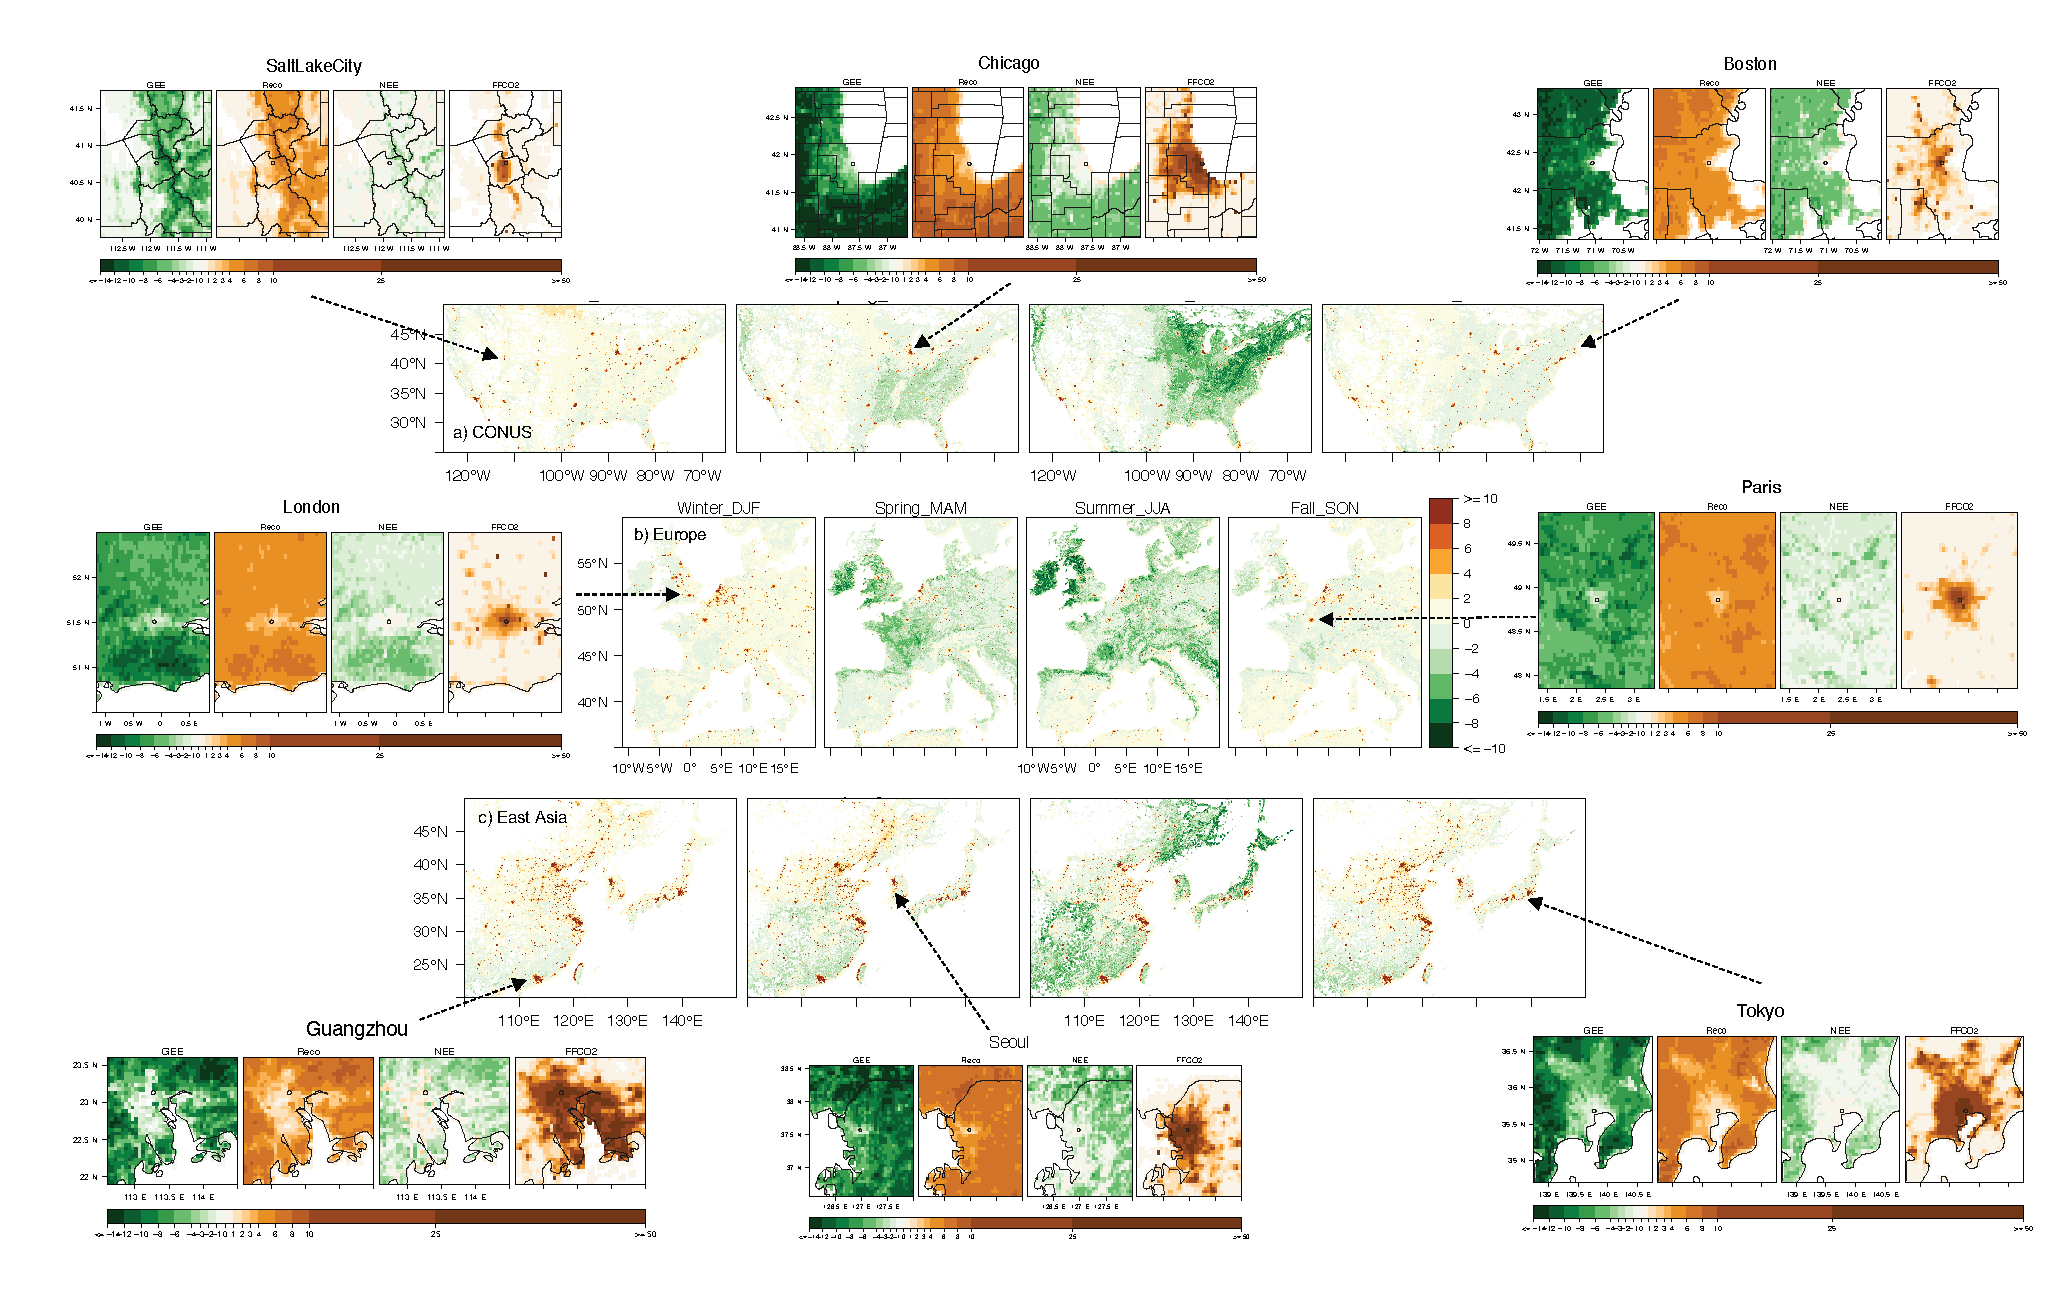
Figure 1. The sums of seasonal mean SMUrF-based NEE and ODIAC-based FFCO2 (micromoles m-2 s-1) for CONUS (a), western Europe (b), and East Asia (c) at 0.05 degrees for 2018 are plotted as centered panels. Maps of city-wide GEE, Reco, NEE, and FFCO2 over JJA 2018 are provided around the centered panels. Source: Wu et al., 2021
Citation
Wu, D., and J.C. Lin. 2021. Urban Biogenic CO2 fluxes: GPP, Reco and NEE Estimates from SMUrF, 2010-2019. ORNL DAAC, Oak Ridge, Tennessee, USA. https://doi.org/10.3334/ORNLDAAC/1899
Table of Contents
- Dataset Overview
- Data Characteristics
- Application and Derivation
- Quality Assessment
- Data Acquisition, Materials, and Methods
- Data Access
- References
Dataset Overview
This dataset contains estimates of biogenic CO2 flux components at 0.05 degree resolution from the Solar-Induced Fluorescence (SIF) for Modeling Urban biogenic Fluxes (SMUrF) model. Estimates were produced for the following regions and periods: eastern and western CONUS (2010–2019), western Europe (2010–2014 and 2017–2018), eastern Asia, eastern China, eastern Australia, South America, and Central Africa (2017–2018). Modeled CO2 flux components include gross primary production (GPP), ecosystem respiration (Reco), and net ecosystem exchange (NEE). Four-day means of GPP are estimated from solar-induced fluorescence (SIF) and biome-specific GPP-SIF relationships. Daily estimates of Reco are included. In addition, GPP and Reco were downscaled to hourly estimates and used to generate hourly NEE. Uncertainties for 4-day GPP and daily Reco estimates are provided. The input data streams included 500 m MODIS-based annual land cover classification, 0.05 degree spatiotemporally contiguous SIF, above-ground biomass (AGB) from GlobBiomass, eddy-covariance (EC) flux measurements, and gridded products of air and soil temperatures.
Project: North American Carbon Program
The North American Carbon Program (NACP) is a multidisciplinary research program designed to improve understanding of North America's carbon sources, sinks, and stocks. The central objective is to measure and understand the sources and sinks of Carbon Dioxide (CO2), Methane (CH4), and Carbon Monoxide (CO) in North America and adjacent oceans. The NACP is supported by a number of different federal agencies.
Related Publication
Wu, D., J.C. Lin, H.F. Duarte, V. Yadav, N.C. Parazoo, T. Oda, and E.A. Kort. 2021. A model for urban biogenic CO2 fluxes: Solar-Induced Fluorescence for Modeling Urban biogenic Fluxes (SMUrF v1). Geoscientific Model Development 14:3633–3661. https://doi.org/10.5194/gmd-14-3633-2021
Acknowledgments
This work is based upon work supported by the National Aeronautics and Space Administration (grant 80NSSC19K0196).
Data Characteristics
Spatial Coverage: eastern and western CONUS, western Europe, eastern China, eastern Australia, eastern Asia, South America, and central Africa
Spatial Resolution: 0.05 degree
Temporal Coverage: 2010-01-01 to 2019-12-31
Temporal Resolution: 4-day mean GPP, 4-day mean SIF, daily mean Reco, and hourly mean GPP, Reco, and NEE fluxes
Site Boundaries: Latitude and longitude are given in decimal degrees.
| Site | Westernmost Longitude | Easternmost Longitude | Northernmost Latitude | Southernmost Latitude |
|---|---|---|---|---|
| Entire Extent | -125 | 155 | 60 | -40 |
Data File Information
There are 925 data files in NetCDF version 4 (*.nc4) format included in this dataset that provide 4-day means of gross primary production (GPP) and uncertainty with associated SIF measurements, daily estimates of ecosystem respiration (Reco) with uncertainty, and downscaled hourly mean net ecosystem exchange (NEE), GPP, and Reco.
Table 1. File names and descriptions. <yyyy> and <yyyymm> represent the year and year and month of the data file, respectively. See Table 2 for a description of each <region>.
| File Name | Description |
|---|---|
| fourday_mean_SIF_GPP_uncert_<region>_<yyyy>.nc4 (e.g., fourday_mean_SIF_GPP_uncert_easternChina_2018.nc4) | 4-day mean SIF and GPP uncertainties for each region, for each available year |
|
daily_mean_Reco_uncert_<region>_<yyyymm>.nc4 |
Daily mean Reco uncertainties for each region, for each month of each available year |
| hrly_mean_GPP_Reco_NEE_<region>_<yyyymm>.nc4 (e.g., hrly_mean_GPP_Reco_NEE_westernCONUS_201602.nc4) |
Hourly mean GPP, Reco, and NEE for each region, for each month for each available year |
Data File Details
The no-data value is -999.
Table 2. Years of data available for each region.
| Region | Year |
|---|---|
| central Africa, eastern Asia, eastern Australia, eastern China, and South America | 2017, 2018 |
| eastern CONUS, western CONUS | 2010–2019 |
| western Europe | 2010–2014, 2017, 2018 |
Table 3. Variables included in all data files.
| Variables | Dimension and Unit | Description |
|---|---|---|
| lon | degree_east | Longitude at cell center |
| lat | degree_north | Latitude at cell center |
| time | seconds since 1970-01-01 00:00:00Z | UTC time |
Table 4. Variables in files named fourday_mean_SIF_GPP_uncert_<region>_<yyyy>.nc4.
| Variable | Units/format | Description |
|---|---|---|
| SIF_mean | mW m−2 nm−1 sr−1 | 4-day mean clear-sky CSIF from Zhang et al. (2018) |
| GPP_mean | µmol m-2 s-1 | 4-day mean Gross Primary Production (best estimates) based on clear-sky CSIF and GPP- SIF slopes aggregated from 500 m |
| GPP_sd | µmol m-2 s-1 | 1-sigma uncertainty of the 4-day mean Gross Primary Productions (based on model-FLUXNET comparisons) |
Table 5. Variables in files named daily_mean_Reco_uncert_<region>_<yyyymm>.nc4.
| Variable | Units/format | Description |
|---|---|---|
| Reco_mean | µmol m-2 s-1 | Daily mean Ecosystem Respiration (best estimates) based on pretrained biome-specific neural network models and ERA5-based temperature fields |
| Reco_sd | µmol m-2 s-1 | 1-sigma uncertainty of Daily Mean Ecosystem Respiration (based on model-FLUXNET comparisons) |
Table 6. Variables in files named hrly_mean_GPP_Reco_NEE_<region>_<yyyymm>.nc4.
| Variable | Units/format | Description |
|---|---|---|
| GPP_mean | µmol m-2 s-1 | Hourly mean Gross Primary Production (best estimates) using hourly downscaling factors based on hourly fields of surface solar radiation downwards from ERA5 reanalysis |
| Reco_mean | µmol m-2 s-1 | Hourly mean Ecosystem Respiration (best estimates) using hourly downscaling factors based on hourly air temperature fields from ERA5 reanalysis |
| NEE_mean | µmol m-2 s-1 | Hourly mean Net Ecosystem Exchanges (best estimates) based on hourly GPP and Reco |
Application and Derivation
When estimating fossil fuel carbon dioxide emissions from observed CO2 concentrations, the accuracy can be hampered by biogenic carbon exchanges during the growing season even for urban areas where strong fossil fuel emissions are found. While biogenic carbon fluxes have been studied extensively across natural vegetation types, biogenic carbon fluxes within an urban area have been challenging to quantify due to limited observations and differences between urban versus rural regions.
Quality Assessment
The grid-level hourly mean NEE fluxes were evaluated against (1) non-gap-filled measurements at 67 eddy-covariance (EC) sites in North America and Europe from FLUXNET during 2010-2014 (r>0.7 for most data-rich biomes); (2) independent observations at two urban vegetation and two crop EC sites over Indianapolis from Aug 2017 to Dec 2018 (r=0.75); and (3) an urban biospheric model based on fine-grained land cover classification within Los Angeles (r=0.83). In addition, error statistics are derived for the modeled 4-day mean GPP and predicted daily mean Reco (testing set), when FLUXNET observations are compared. Those error statistics include correlation coefficient (r), root-mean-square error (RMSE), absolute mean bias, and coefficient of variation (CV). Refer to Wu et al. (2021) for details.
Data Acquisition, Materials, and Methods
Similar to many terrestrial biospheric models, SMUrF estimates gridded GPP, Reco, and NEE (Reco - GPP) fluxes based on biomes. The main required data streams include (1) 500 m MODIS-based annual land cover classification; (2) 0.05 degree spatiotemporally contiguous SIF product; (3) above-ground biomass (AGB) from GlobBiomass; (4) eddy-covariance (EC) flux measurements; and (5) gridded products of air and soil temperatures. Figure 2 provides a summary of the data products used.
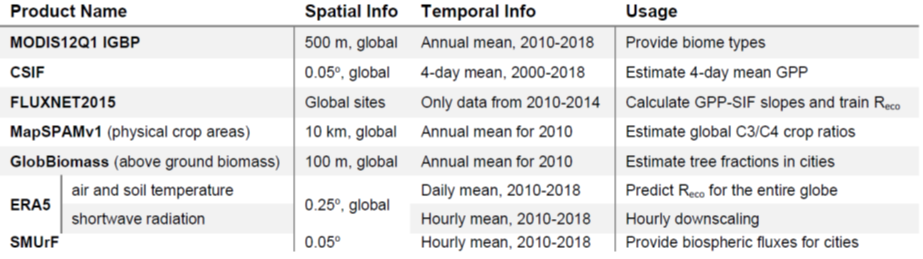
Figure 2. Description of the data products and observations used. Modified from Figure 1 of Wu et al. (2021).
Biomes
The land cover types defined by the International Geosphere-Biosphere Programme (IGBP) from the MODIS product MCD12Q1 were adopted to inform biomes over global lands. The preprocessed version of MCD12Q1 v006 was accessed from Friedl and Sulla-Menashe (2019) with latitude and longitude grids from Application for Extracting and Exploring Analysis Ready Samples (AppEEARS). Twelve biomes include croplands (CRO), closed and open shrublands (CSHR, OSHR), deciduous/evergreen broadleaf/needleleaf forests (DBF, DNF, EBF, ENF), grasslands (GRA), mixed forests (MF), savannas (SAV), woody savannas (WSAV), and permanent wetlands (WET). Unfortunately, MCD12Q1 simply treats the entire urban area as one category (URB), while in reality both grass and trees exist within the MODIS-based URB category. Two special treatments are carried out over urban areas and croplands and are further explained below.
Fluxes
SMUrF first estimates the 4-day mean GPP and daily mean Reco and then performs temporal downscaling to arrive at the hourly NEE fluxes at 0.05 degree (NEE=Reco-GPP). Hourly scaling factors were derived from surface downward shortwave radiation and air temperature from the ECMWF ReAnalysis-5 (ERA5; Copernicus Climate Change Service Information, 2017) using methods similar to Fisher et al. (2016) and Olsen and Randerson (2004).
In general, 4-day mean GPP was calculated using 4-day mean clear-sky SIF from CSIF (Zhang et al., 2018) and estimated biome-specific GPP-SIF slopes (α). The daily mean Reco was predicted based on ERA5-based air and soil temperatures (Tair and Tsoil) as well as the modeled GPP fluxes via neural network technique.
4-Day Mean GPP Estimates
A spatiotemporally Contiguous SIF (CSIF; Zhang et al., 2018) product together with GPP fluxes from FLUXNET 2015 (Pastorello et al., 2017) were used to calculate biome-specific GPP-CSIF slopes. Over 80 global EC tower sites with screened data points (quality flag<3) from 2010 to 2014 were chosen to represent various biomes. CSIF offers a global 4-day mean SIF at the grid spacing of 0.05 degrees during 2000–2018 using the NN approach (Zhang et al., 2018). α values are then assigned to each 500 m grid cell with various biome types and aggregated to 0.05 degrees to match the spatial resolution of the CSIF product. The 4-day mean GPP fluxes are calculated as the product of clear-sky CSIF and biome-weighted mean α values.
Two special treatments were performed for urban areas and croplands
1) The areal estimates of 42 crop species from the Spatial Production Allocation Model (MapSPAM 2010V1.1; You et al., 2014) were adopted to estimate the relative C3:C4 fractions. Four of the selected 13 cropland FLUXNET sites are associated with higher C4 fractions (>50%) than the rest (<10%). Assuming a linear relationship between GPP and SIF, two different α values were obtained for C3 and C4 crops based on the aforementioned EC sites with higher or lower C4 fractions. Eventually, the α values over croplands are calculated using the MapSPAM-based C3:C4 fractions and the individual α values.
2) Since MCD12Q1 treats the entire urban areas as one category, an algorithm was developed to approximate vegetation types and fractions within cities. An empirical relationship between the 100 m AGB from GlobBiomass (Santoro et al., 2018) and the tree cover fraction (ftree=tree/vegetated) from a high-resolution NAIP-based land cover classification over Los Angeles (Coleman et al., 2020) was derived. The nonlinear AGB-ftree relation is applied to approximate the tree fractions over global cities. The AGB-based tree fractions yield more trees than the tree fraction derived from the MOD44B product over Los Angeles.
The relative non-tree vegetated fractions (fnon-tree=1-ftree) is simply split into half grass and half shrub. The relative tree fractions are further divided into five specific tree types (i.e., DBF, DNF, EBF, ENF, MF). Due to insufficient reported data on urban tree species, the share of each tree type in cities is approximated as a function of latitude based on climatology (e.g., high fractions of ENF over high-latitudes, EBF over tropical lands, and DBF plus MF over the mid-latitudes).
Finally, each 500 m urban grid cell is linked to a weighted mean α value according to the predicted tree/grass fractions and their associated α values. To account for the potential negative bias of ~14.5% in CSIF over cities (Zhang et al., 2018), we scaled up the urban α values by 1.145.
Refer to Wu et al. (2021) for additional information.
Data Access
These data are available through the Oak Ridge National Laboratory (ORNL) Distributed Active Archive Center (DAAC).
Urban Biogenic CO2 fluxes: GPP, Reco and NEE Estimates from SMUrF, 2010-2019
Contact for Data Center Access Information:
- E-mail: uso@daac.ornl.gov
- Telephone: +1 (865) 241-3952
References
Coleman, R.W., N. Stavros, V. Yadav, and N. Parazoo. 2020. A simplified framework for high-resolution urban vegetation classification with optical imagery in the Los Angeles Megacity. Remote Sensing 12:2399. https://doi.org/10.3390/rs12152399
Copernicus Climate Change Service (C3S). 2017. ERA5: Fifth generation of ECMWF atmospheric reanalyses of the global climate. Copernicus Climate Change Service Climate Data Store (CDS). https://cds.climate.copernicus.eu/cdsapp, https://doi.org/10.24381/cds.bd0915c6. Accessed 2020-04-14.
Fisher, J.B., M. Sikka, D.N. Huntzinger, C. Schwalm, and J. Liu. 2016. Technical note: 3-hourly temporal downscaling of monthly global terrestrial biosphere model net ecosystem exchange. Biogeosciences 13:4271–4277. https://doi.org/10.5194/bg-13-4271-2016
Friedl, M., and D. Sulla-Menashe. 2019. MCD12Q1 MODIS/Terra+Aqua Land Cover Type Yearly L3 Global 500m SIN Grid V006. NASA EOSDIS Land Processes DAAC. https://doi.org/10.5067/MODIS/MCD12Q1.006
Olsen, S.C. and J.T. Randerson. 2004. Differences between surface and column atmospheric CO2 and implications for carbon cycle research. Journal of Geophysical Research 109. https://doi.org/10.1029/2003JD003968
Pastorello, G., D. Papale, H. Chu, C. Trotta, D. Agarwal, E. Canfora, D. Baldocchi, and M. Torn. 2017. A New Data Set to Keep a Sharper Eye on Land-Air Exchanges. Eos. https://doi.org/10.1029/2017eo071597
Santoro, M. 2018. GlobBiomass - global datasets of forest biomass. PANGAEA - Data Publisher for Earth & Environmental Science. https://doi.org/10.1594/PANGAEA.894711
Wu, D., J.C. Lin, H.F. Duarte, V. Yadav, N.C. Parazoo, T. Oda, and E.A. Kort. 2021. A model for urban biogenic CO2 fluxes: Solar-Induced Fluorescence for Modeling Urban biogenic Fluxes (SMUrF v1). Geoscientific Model Development 14:3633–3661. https://doi.org/10.5194/gmd-14-3633-2021
You, L., S. Wood, U. Wood-Sichra, and W. Wu. 2014. Generating global crop distribution maps: From census to grid. Agricultural Systems 127:53–60. https://doi.org/10.1016/j.agsy.2014.01.002
Zhang, Y., J. Joiner, S.H. Alemohammad, S. Zhou, and P. Gentine. 2018. A global spatially Continuous Solar Induced Fluorescence (CSIF) dataset using neural networks. https://doi.org/10.5194/bg-2018-255