Get Data
Revision date: June 14, 2013
Summary:
This model product contains the source codes for version 1 of the individual-based forest ecosystem biogeochemistry model LINKAGES and two subsequent versions as well as example input and output data. LINKAGES predicts long-term structure and dynamics of forest ecosystems as constrained by nitrogen availability, climate, and soil moisture. Model simulations compare favorably to field data from different geographic areas worldwide.
LINKAGES, written in FORTRAN and provided in ASCII format, simulates birth, growth, and death of all trees greater than 1.43-cm dbh. Litter fall and decomposition are also simulated. Sunlight is the driving variable. Growing season degree days, soil water availability, and actual evapotranspiration (AET) are calculated from precipitation, temperature, soil field moisture capacity, and wilting point. Decomposition and soil N availability are calculated from organic matter quantity and carbon chemistry, evapotranspiration, and degree of canopy closure. Light availability to each tree is a function of leaf biomass of taller trees. Degree days and availabilities of light and water constrain species reproduction. These variables plus soil N constrain tree growth and carbon accumulation in biomass. Tree death probability increases with age and slow growth. Leaf, root, and woody litter are returned to the soil at the end of each year to decay the following year.
Climatic and forest data for eastern North America and New South Wales are provided as example model inputs. Modelers may use their own site data within any version of LINKAGES. Example model output is also provided.
There are four compressed *.zip files and three companion files within this data set.
Data Citation:
Cite this data model as follows:
Post, W.M., and J. Pastor. 2013. LINKAGES: An Individual-based Forest Ecosystem Biogeochemistry Model. ORNL DAAC, Oak Ridge, Tennessee, USA. < a href="http://dx.doi.org/10.3334/ORNLDAAC/1166"> http://dx.doi.org/10.3334/ORNLDAAC/1166
Model Product Description:
The original LINKAGES model (v 1.0; Pastor and Post, 1985), written in FORTRAN and provided in this model product in ASCII text format, was developed from gap models known as JABOWA [Botkin et al. (1972) as revised by Solomon et al. (1984)] and FORET (Shugart and West, 1980) that simulate changes over time in size and species of individual trees as influenced by competition for light and soil moisture and as determined by prevailing temperature. In LINKAGES, the decomposition subroutine has been modified to include three classes of organic matter such that the influence of each species extends farther into the decay process. The output subroutine has been modified to give biomass for up to 10 species specified in input. A complete description of LINKAGES is given in Pastor and Post (1985; 1986) and is summarized herein.
LINKAGES simulates ecosystem carbon and nitrogen storage and cycling by considering the interactions between physiological processes that determine individual tree growth, demographic processes that determine tree-population dynamics, microbial processes that determine nitrogen availability, and environmental processes that determine water availability. LINKAGES differs from other gap models in that it includes explicit decomposition, mineralization, and soil moisture sub-routines, allowing water and nutrient cycles to interact with species composition. It differs from other forest carbon models in that it simulates the growth of individual trees and therefore allows for analysis of interspecies composition and competition and for the assessment of the impacts of different disturbance options such as timber harvesting. Furthermore, individual tree growth in LINKAGES is determined by the single factor most restrictive to each tree among several potential constraints including light, soil moisture, soil nitrogen, and temperature as influenced by prevailing environmental conditions and other trees in the model stand. Pastor and Post (1988) earlier demonstrated that it was important to include both soil moisture and nitrogen availability. In addition, LINKAGES can model climate change effects on the forest ecosystem, even those forests with high tree species diversity.
The original LINKAGES model (v 1.0) has more two recent versions: LINKAGES v 2.2 (Wullschleger et al., 2003) and LINKAGES_RothC (Ranatunga et al., 2008). The modifications are described herein. The source codes for the three model versions are provided in this data product.
Climate data and literature-derived parameters for 72 upland tree species of eastern North America are provided as example input data for LINKAGES v 1.0. Climate and forest data from Walker Branch Watershed, Tennessee, are provided as example input data for LINKAGES v 2.2. Climate and forest data from Kendall State Forest, New South Wales, are provided as example input data for LINKAGES_RothC. Model users may use site input data tailored to their geographic location, climate, and forest type(s).
Example model output data are provided from the execution of LINKAGES v 2.2 based on input data from Walker Branch Watershed, Tennessee.
LINKAGES model simulation results compare favorably to independent data on species composition, biomass, net primary productivity, soil organic matter, and nitrogen availability in many different geographic areas of the world. Applications have demonstrated the model's utility in understanding how climate change can affect forest composition and structure (see references in Dale et al., 2010).
Spatial & Temporal Scales
The original version of LINKAGES simulates, on a yearly cycle, the establishment, growth, and mortality of all trees in a 1/12 ha plot (0.083 ha), which corresponds to the average gap size created by a dominant tree in eastern North American forests (Shugart and West, 1979). The plot size was increased in LINKAGES_RothC to 1 ha.
Unless otherwise noted, all biomass, carbon, and nitrogen pools are in Mg/ha, and flows are in Mg/ha/yr.
Data Format
The source code for all three LINKAGES model versions is written in FORTRAN. The files are ASCII Text.
Model Products
There are three compressed *.zip files provided within this data set :
linkages_v1-0.zip,
linkages_v2-2.zip, and
linkages_rothc.zip.
File Contents
LINKAGES Version 1.0 is provided in the file linkages_v1-0.zip. When expanded (unzipped), it contains two files described below:
| FILE NAME | DESCRIPTION and UNITS |
|---|---|
| LINKAGES.DAT | Standard input file for execution of LINKAGES v 1.0 (from an eastern North American forest -82.5 W 49.40 N). See the following three tables below for input data descriptions. |
| linkages.f | Source code for LINKAGES v 1.0, written in FORTRAN |
Section 3.2 in Pastor and Post (1985) describes how the subroutine INPUT reads run control parameters, soil retention data, climate data, individual species data required to calculate tree growth in relation to environmental conditions, and parameters needed to calculate decay of various litter types. The next three tables define the parameters in the input data file.
Parameter Definitions for Model Input (in the file LINKAGES.DAT from linkages_v1-0.zip)
| PARAMETER ABBREVIATION | PARAMETER DESCRIPTION | UNITS |
|---|---|---|
| KLAST | Number of days to simulate | Numeric [NMAX and NWRITE (counters in OUTPUT) are calculated from these] |
| NYEAR | Number of years simulated per plot | |
| KPRINT | Print interval in years for output to be sent to tape, printer, etc. | |
| IOPLAT | Number of break points in the climate arrays | Numeric |
| X array | Years in which the break points occur and between which linear interpolations will be made simulating climatic change during intervening years | Numeric |
| PLAT | Plot latitude | Decimal degrees |
| PLONG | Plot longitude | |
| BGS | Days of the year the growing season begins | Numeric |
| EGS | Days of the year the growing season ends | |
| FC | Field-moisture capacity | cm |
| DRY | Wilting point | |
| 1see Notes below | Mean monthly temperatures | degrees Celsius |
| Standard deviations for mean monthly temperatures | ||
| Mean monthly precipitation inputs | cm | |
| Standard deviations for mean monthly precipitation inputs | ||
| NSPEC | Number of species | Numeric |
| BMSPEC | List of species targeted for output to a special file for postprocessing | Numeric |
Notes: 1The next 8 lines of data in linkages_v1.dat, each with 12 columns, are monthly temperature and precipitation data and their standard deviations in the row order listed above with 2 rows for each parameter. The climatic data were compiled and averaged from weather data collected on or near Walker Branch Watershed in eastern Tennessee. The climatic data are read into arrays TSAV (temperature means by month in degrees C), VTSAV (temperature standard deviations by month in degree C), RSAV (rainfall means by month in cm), and VRSAV (rainfall standard deviations by month in cm), respectively, and are used to determine growing degree days, soil moisture, and annual evapotranspiration. If any of these climatic attributes is to be held constant, two identical lines should be read into the respective array. If climatic change is simulated, as was done by Dale et al. (2009; 2010), each line may contain different data corresponding to different years in X.
Individual Tree Species Parameters (in the file LINKAGES.DAT from linkages_v1-0.zip)
| COLUMN NUMBER | TREE SPECIES PARAMETER ABBREVIATION | PARAMETER DESCRIPTION | UNITS |
|---|---|---|---|
| 1 | AAA | Species name | Text |
| 2 | DMAX | Degree day maximum for each species | Numeric |
| 3 | DMIN | Degree day minimum for each species | |
| 4 | B3 | Growth scaling parameter | Numeric |
| 5 | B2 | ||
| 6 | ITOL | Shade tolerance for each species (there are no values .. column is blank) | N/A |
| 7 | AGEMX | Maximum age of each species | Years |
| 8 | G | Scalar for species maximum diameter increment | cm |
| 9 | SPRTND | Number of sprouts per stump | Numeric |
| 10 | SPRTMN | Minimum diameter for a stump to sprout | cm |
| 11 | SWITCH | Reproduction switches | Text |
| 12 | MPLANT | Maximum seeding in rate per plant (reasonable approximations taken from the literature) | Numeric |
| 13 | NUM | Number of species in sequence (1-72) | Numeric |
| 14 | D3 | Drought tolerance (fraction of growing season) | % |
| 15 | FROST | Minimum January (Northern Hemisphere) temperature tolerated | degrees Celsius |
| 16 | TL | Leaf litter quality class [12 leaf-litter types (1-12) in order of decreasing decay rate and increasing nitrogen-immobolization rate plus root litter, fresh wood, twigs, and well decayed wood. See Table 4 and Appendix B in Pastor and Post (1985)] | Numeric |
| 17...21 | CM1, ... , CM5 | Parameters for nitrogen growth multipliers | Numeric |
| 22 | FWT | Leaf weight per unit crown area | 100g/m2 |
| 23 | SLTA | Parameter to calculate crown area from diameter. SLTA and SLTB convert DBH to crown area (100 m2) | Numeric |
| 24 | SLTB | ||
| 25 | RTST | Root-shoot ratio for each species | Index |
| 26 | FRT | Foliage retention time | Years |
Notes: See Table 1 in Pastor and Post (1985) for variables in COMMON blocks. See Table 4 in Pastor and Post (1985) for leaf litter quality class code definitions and decomposition parameters. See Table 1 in Pastor and Post (1986) for drought, nitrogen, and shade tolerances and leaf litter quality class by species. N/A = Not applicable.
Decomposition Parameters (in the file LINKAGES.DAT from linkages_v1-0.zip)
| PARAMETER ABBREVIATION | PARAMETER DESCRIPTION | UNITS |
|---|---|---|
| NLVAR | Number of litter-decay variables | Numeric |
| NLT | Number of litter types | Numeric |
| FDAT | These 10 columns hold the following information on the 12 leaf litter types, root litter, fresh wood, twigs, and well-decayed wood: 1. The weight of an incoming cohort of litter (initialized to zero); [See Table 4 and Appendix B in Pastor and Post (1985)] |
Numeric |
| NCOHORT | Number of cohorts present in the forest floor in any year (initially one for humus) | Numeric |
| BASESC | Starting humus weight | Mg/ha |
| BASESN | Starting N content |
Notes: NLVAR and NLT are used as counters for reading decomposition parameters into array FDAT.
Example of Input Data (linkages_v1.dat)
| KPRNT= 10 KLAST= 50 NYEAR=500 IPOLAT= 2 0. 500. PLAT=49.40 PLONG= 82.5 BGS=164. EGS=248. FC=38.8 DRY=20.0 -18.2 -15.8 -9.1 0.6 7.8 14.1 16.9 15.3 10.4 5.1 -4.2 -14.1 ... NSPEC= 72 BMSPEC= 10 1 20 27 28 30 55 58 59 60 65 ABIES BALSAMEA 2386. 0560.545254.521200. 68.85 FFTFF 8 1 .165 -25 10 2.79 219.77 .00179 -0.6 1.0 440. .804 .069 1.0 3. ... QUERCUS BOREALIS 3250. 1100.945294.522250. 87.332.12. 40.TFFFF 40 72 .225 -17. 9 2.79 219.77 .00179 -0.6 1.0 440. .904 .095 1.0 1. NLVAR = 10 NLT = 17 0. .0068 .0251 .0183 1. 1. .039 .5217 .336 .90 ... NCOHRT = 1 74. 1.640 18. 0. |
Subroutines (within linkages.f, the code for LINKAGES Version 1.0, from linkages_v1-0.zip)
| SUBROUTINE NAME | SUBROUTINE DESCRIPTION |
|---|---|
| BIRTH | Calculates seedling and sprout birth based on species fecundity, seedbed conditions, susceptibility to browsing, and the degree to which light, soil moisture, and degree days are less than optimum for growth. Soil moisture and degree day multipliers are supplied by subroutine GMULT. A species can have sprouts if at least one tree with diameter between SPRTMN and SPRTMX died last year (KSPRT incremented by 1 in kill). Random numbers used to determine occurrence of browsing, numbers of seedlings and sprouts, and DBH supplied by URAND. |
| DECOMP | Calculates carbon and nitrogen flows through soil. Available N (AVAILN) is used in GMULT to calculate soil nitrogen growth multipliers. AET is fed in from MOIST. This year's leaf, twig, root, and wood litter is fed in from KILL (ARRAY TYL). The simulation starts on bare ground (only humus present. BASESC AND BASESN are starting humus weight and N contents read in input). Three types of soil organic matter are recognized: cohorts either immobilizing or rapidly mineralizing nitrogen and a homogenous humus pool slowly mineralizing N. |
| ERR | This subroutine is a list of errors that may occur in the program. The errors focus on variables used as DO loop counters and which may exceed dimensions of certain arrays. |
| GGNORD | Calculates normally distributed random numbers supplied by URAND. it is called from subroutines TEMPE and MOIST. |
| GMULT | Calculates degree day, soil moisture, and soil nitrogen multipliers used in subroutines BIRTH and GROW BASED on DEGD (supplied by TEMPE), FJ (supplied by MOIST), and AVAILN (supplied by DECOMP), respectively. |
| GROW | Calculates diameter growth for each tree by decreasing maximal growth to the extent that the most limiting resource is less than optimal. |
| INPUT | Reads RUN parameters, latitude, longitude, days of the year the growing season begins and ends, soil field moisture capacity and wilting points, monthly temperature, precipitation, and their stnd dev, species parameters, decomposition parameters, and starting humus weight and N content. |
| KILL | Kills trees by age dependent mortality (only 1% reach maximum age) and age independent mortality (probability of surviving 10 consecutive years of slow growth (see GROW) = 1%). Decisions on whether or not to kill a tree are partly based on random numbers supplied by URAND. KILL also calculates litter amounts, which are decayed in subroutine DECOMP. |
| LININT | Interpolates monthly temperatures, precipitation and their stnd dev for all years bracketed by two years of different climates. These years are supplied in array X. |
| MOIST | Calculates the fraction of the growing season with unfavorable soil moisture for growth (FJ) used in subroutine GMULT to determine soil moisture growth multipliers, and actual evapotranspiration (AET) used in subroutine DECOMP to determine decay rates. The subroutine simulates the method of Thornthwaite and Mather (1957) as modified by Pastor and Post (1984). Temperatures are provided by subroutine TEMPE. Monthly precipitation is calculated the same way as temperatures were in TEMPE. |
| OUTPUT | Calculates and stores species biomass, total above-ground biomass and NPP, total number of stems, and leaf area. It also stores available N, soil C:N, soil O.M., leaf litter, total litter, and AET. Means AND 95% confidence intervals are calculated on all stand level variables at the end of the run. Array ST Contains Student's T for N=1 to greater than or equal to 30. |
| PLOTIN | Initializes variables to start simulation on bare plots. NTREES contains number of trees for each species. DBH contains diameter at breast height for each tree. KSPRT is used to flag trees eligible to sprout. NOGRO is used to flag slowly growing trees. IAGE contains the age of each tree. C contains data on litter cohorts. C(1,1) is humus weight (BASESC is starting value). C(1,2) is humus N content (BASESN is starting value). C(I,5) is "litter type" for humus. NCOHRT is number of litter cohorts present. (If NOCOHRT = 1, only humus is present). TYL contains this year's litter. |
| TEMPE | Calculates growing season degree days (DEGD) based on monthly temperatures normally distributed around a specified mean with a specified stnd dev. The temperatures are supplied by subroutine GGNORD using random number generator URAND and are linearly interpolated between years of different climates by subroutine LININT. |
Notes: See "User's Guide to the Computer Code" in Pastor and Post, 1985 for details about these subroutines. There is also the function URAND which is a Dummy call for transition to calling RANGEN(R) for VAX.
LINKAGES Version 2.2, is provided in the file linkages_v2-2.zip, which expands into two subdirectories, CLIMATE and SRC.
CLIMATE - This subdirectory expands into 4 subdirectories, TEMP, PRECIP, SOLAR, and WIND. Each of these subdirectories extrapolates into 28 lower_case-directory_nameYY.dat files where YY is the year, 1973 through 2000- expressed as two digits (73-00). The data are from Walker Branch Watershed, TN -85 W 36 N. Long-term simulations are accomplished by running the model using repeated cycles of the 28-year climate data set.
Descriptions of file contents and example file names:
| SUBDIRECTORIES/FILE NAMES | DESCRIPTION AND UNITS |
|---|---|
| Subdirectory: Temperature Example data file names: linkages_v2-2/CLIMATE/TEMP/temp98.dat linkages_v2-2/CLIMATE/TEMP/temp99.dat |
DAILY MAXIMUM TEMPERATURE (degrees C), DAILY MINIMUN TEMPERATURE (degrees C) |
| Subdirectory: Precipitation Example data file names: linkages_v2-2/CLIMATE/PRECIP/precip00.dat linkages_v2-2/CLIMATE/PRECIP/precip77.dat |
DAILY MEAN PRECIPITATION AMOUNT (mm) |
| Subdirectory: Solar Radiation Example data file names: linkages_v2-2/CLIMATE/SOLAR/solar98.dat linkages_v2-2/CLIMATE/SOLAR/solar99.dat |
DAILY MEAN INCOMING SOLAR RADIATION (MJ/m2/d) |
| Subdirectory: Wind Example data file names: linkages_v2-2/CLIMATE/WIND/wind00.dat linkages_v2-2/CLIMATE/WIND/wind73.dat |
DAILY MEAN WIND SPEED (m/s) |
SRC: This subdirectory expands into 17 files described in the following two tables below:
| FILE NAME | DESCRIPTION |
|---|---|
| linkages.f | Model source code for LINKAGES v 2.2 |
| evap.f | Daily evapotranspiration (ET) scheme that replaces the monthly description of ET in LINKAGES v 1.0 |
| wbw.csh | The shell script used to run the model and name the output files. |
| soil_hydrology.h | A header file defining the soil layer structure |
| linkages.h | A header file that allocates memory for soil layers and defines variables used in hydrology.c described below |
| linkages_limits.h | A header file that defines a few constants used in linkages.f (the model source code for LINKAGES Version 2.2) |
| hydrology.c | C++ Code for calculating multi-soil layer hydrology |
| wbw_species.dat | Input data. Modified linkages_v1.dat file for use with v 2.2 (see README file for details of changes) |
| soil.dat | Input data file. N (number of soil layers), For each soil layer – thick (thickness of soil layer, cm), theta_fc (soil layer field capacity, cm), theta_wp (soil layer wilting point, cm), rock (>4mm rock, fraction), frac_use (fraction of layer usable, fraction), a_ch (coefficient in psi fuction, unitless), b_ch (coefficient in psi function, unitless). |
| plot73.dat | Input data file. In subroutine plotin, there is code to read and initialize the model with 1973 WBW plot data. nyear (calendar year), nplot (plot number, unitless), nspc (species number), diam (diameter at breast height, cm), slp_tmp (plot slope, %), asp_tmp (plot aspect, degree N). A line with -1 as the plot number indicates the end of data for a plot. |
| README | Text file explaining details associated with LINKAGES Version 2.2 |
Model Output Data included in the subdirectory SRC (from execution of LINKAGES v 2.2 using input data from Walker Branch Watershed, Tennessee):
| OUTPUT FILES | DESCRIPTION |
|---|---|
| total10.out | Year, average number of stems, total biomass (Mg/ha), total basal area (m2/ha), average number of dry days per year (days), average basal area per tree (m2), annual evapotranspiration (cm), total net primary production (Mg/ha/y) |
| summary10.out | Summary output for run – see table headings for details |
| stems10.out | Year, number of stems of selected species averaged over the plots |
| biomass10.out | Year, biomass of selected species averaged over the plots (Mg/ha) |
| basal10.out | Year, basal area of selected species averaged over the plots (m2/ha) |
Subroutines
LINKAGES Version 2.2 has additional input parameters not included in the original LINKAGES model. In subroutine INPUT, the new parameters are nclimat, bareplt, lai_dynm, nphenol, ntparab, and egs2. Please note that the parameters described for LINKAGES Version 1.0 are also included in LINKAGES Version 2.2. The new parameters are defined as follows:
| NEW PARAMETERS IN SUBROUTINE INPUT | DESCRIPTION |
|---|---|
| nclimat | Selects the climate scenario for increasing temperature and decreasing or increasing precipitation. |
| bareplt | Option for starting from a bare plot or initializing the model with WBW plot data. |
| lai_dynm | Allows for using leaf area calculated in LINKAGES in the evapotranspiration equations instead of a constant. |
| nphenol | Option for using a phenology routine to determine the beginning of the growing season (bud break) based on annual temperatures instead of a constant input value. |
| ntparab | Controls how the temperature-response function is used to reduce tree growth. |
| egs2 | Allows for the calculation of fractional dry days toward the end of the growing season since drought does not have as much effect on annual tree growth as earlier in the growing season. |
In addition, there are 7 soil parameters for each soil layer. These soil parameters are:
| SOIL PARAMETERS | DESCRIPTION |
|---|---|
| thick | Thickness of the soil layer |
| theta_fc | Soil layer field capacity |
| theta_wp | Soil layer wilting point |
| rock | % rock in the layer |
| frac_use | Fraction of usable soil |
| a_ch | Coefficient in psi function |
| b_ch | Coefficient in psi function |
In subroutine PLOTIN, there is code to read and initialize the model with 1973 Walker Branch Watershed (WBW) plot data.
In subroutine MET, the daily climatic data for the variables solar radiation, maximum temperature, minimum temperature, wind speed, and precipitation are read for the years 1973-2000. Every 28 years, the files rewind and the climate repeats. Twenty eight years before the end of a simulation, the model uses the data for 1973; so the climate for 2000 is always used the last year of the simulation.
Other than these changes, LINKAGES v 2.2 retains all components of the original LINKAGES v 1.0 model. Neither model accounts for major ecosystem disturbances, such as pest, fire, or disease.
LINKAGES_RothC is provided in the file linkages_rothc.zip. This file expands into 4 files (3 *.f fortran programs in ASCII text file format and 1*.dat which is the input data) described in the table below.
| FILE NAME | DESCRIPTION |
|---|---|
| Gcalculations.f | Fortran code that calculate the maximum diameter increment (Gmax) from field measured data. This is something required for each species in the input file. |
| rotham.f | Implementation of the Rothamsted turnover model as described in Jenkinson (1990), programed by W.M. Post and translated to FORTRAN |
| NSWforests.dat | Input data file for the RothC version of LINKAGES. Contains forest inventory data from Kendall Forest Management Area in New South Wales (NSW) (-31.633 S, 152.85 E) |
| Linkages_KR_210205.f | Source code for LINKAGES_RothC, written in FORTRAN |
Model Input Data. Inventory data used as input to the LINKAGES_RothC model version was used in the investigation into the influence of several harvest management practices on carbon sequestration in Eucalyptus dominated forest stands of eastern Australia (Ranatunga et al., 2008) and were extracted from the Kendall Continuous Forest Inventory (Kendall CFI) database. The Kendall CFI was established in the Kendall Forest Management Area in New South Wales (149.1 E -35.60 S) in 1960 and has been carried out every 5 years since then. The site is a native forest composed of various Eucalyptus species, dominated largely by blackbutt (Eucalyptus pilularis). Other species include tallowood (E. microcorys), Sydney bluegum (E. saligna), turpentine (Syncarpia glomulifera) and bloodwood species (mainly E. intermedia). Forest age is not known, but individual trees can live over 400 years. Mean annual precipitation is approximately 1,400 mm and mean annual temperature is 18.1 degrees C. Details related to Kendall CFI can be found in Muhairwe (1998). NOTE: The standard input data file
The next three tables define the parameters in the input data file
Parameter Definitions for Model Input (in the file NSWforests.dat from linkages_rothc.zip):
| PARAMETER ABBREVIATION | PARAMETER DESCRIPTION | UNITS |
|---|---|---|
| KPRINT | Print interval in years for output to be sent to tape, printer, etc. | Numeric [NMAX and NWRITE (counters in OUTPUT) are calculated from these] |
| KLAST | Number of days to simulate | |
| NYEAR | Number of years simulated per plot | |
| IPOLAT | Number of break points in the climate arrays | Numeric |
| X array | Years in which the break points occur and between which linear interpolations will be made simulating climatic change during intervening years | |
| PLAT | Plot latitude | Decimal degrees |
| PLONG | Plot longitude | |
| BGS | Days of the year the growing season begins | Numeric |
| EGS | Days of the year the growing season ends | |
| FC | Field-moisture capacity (-33kPa) | cm |
| DRY | Wilting point (-1500 kPa) | |
| SW100 | Soil water potential (-100 kPa). Point at which soil moisture deficit begins to restrict the rate of soil organic matter decomposition. | cm |
| MEAN T | Mean monthly temperatures | degrees Celsius |
| STND DEV | Standard deviations for mean monthly temperatures | |
| MEAN PPT | Mean monthly precipitation inputs | cm |
| STND DEV | Standard deviations for mean monthly precipitation inputs | |
| NSPEC | Number of species | Numeric |
| BMSPEC | List of species targeted for output to a special file for postprocessing |
Individual Tree Species Parameters (in the file NSWforests.dat from linkages_rothc.zip)
| COLUMN NUMBER | TREE SPECIES PARAMETER ABBREVIATION (from Ranatunga et al., 2008 and Pastor and Post, 1985) | PARAMETER DESCRIPTION | UNITS |
|---|---|---|---|
| 1 | Species | Species name | Text |
| 2 | Dmax |
Maximum number of growing season degree days for each species |
Numeric |
| 3 | Dmin |
Minimum number of growing season degree days for each species | |
| 4 | B3 | Growth scaling parameter | Numeric |
| 5 | B2 | ||
| 6 | ITOL | Shade tolerance for each species (1 = tolerant; 2 = intolerant) | Numeric |
| 7 | AGEMX | Maximum age of each species | Years |
| 8 | G | Scalar for species maximum diameter increment | cm |
| 9 | N/A | Set to Zero. [In LINKAGES v 1.0 input data file (linkages_vl.dat), these columns pertain to # of sprouts per stump and min diameter for a stump to sprout. There is an extra data column in NSWforests.dat. As such, the layout does not match that of linkages_vl.dat.] | Numeric |
| 10 | N/A | ||
| 11 | N/A | ||
| 12 | SWITCH |
Reproduction switches |
Text |
| 13 |
MPLANT |
Maximum seeding in rate per plant (reasonable approximations taken from the literature) |
Numeric |
| 14 | NUM |
Number of species in sequence (1-72) |
Numeric |
| 15 | D3 | Drought tolerance (fraction of growing season) | % |
| 16 | FROST | Minimum July (Southern Hemisphere) temperature tolerated | degrees Celsius |
| 17 | TL |
Leaf litter quality class [12 leaf-litter types (1-12) in order of decreasing decay rate and increasing nitrogen-immobolization rate plus root litter, fresh wood, twigs, and well decayed wood. See Table 4 and Appendix B in Pastor and Post (1985)] |
Numeric |
| 18..22 |
CM1, ... , CM5 |
Parameters for nitrogen growth multipliers |
Numeric |
| 23 | FWT | Leaf weight per unit crown area | 100g/m2 |
| 24 | SLTA | Parameter to calculate crown area from diameter. SLTA and SLTB convert DBH to crown area (100 m2) | Numeric |
| 25 | SLTB | ||
| 26 | RTST | Root-shoot ratio for each species | Index |
| 27 | FRT | Foliage retention time | Years |
| 28 | T1 | Parameter values for shade tolerance equation | degrees Celsius |
| 29 | T2 | ||
| 30 | T3 | ||
| 31 | β1s | Coefficients for stem (s), bark (k), branch (b) and leaf (f) in the biomass function | Numeric |
| 32 | β1k | ||
| 33 | β1b | ||
| 34 | β1l | ||
| 35 | β2s | ||
| 36 | β2k | ||
| 37 | β2b | ||
| 38 | β2l |
Notes: N/A = Not applicable.
Decomposition Parameters (in the file NSWforests.dat from linkages_rothc.zip)
| PARAMETER ABBREVIATION | PARAMETER DESCRIPTION | UNITS |
|---|---|---|
| NLVAR | Number of litter-decay variables | Numeric |
| NLT | Number of litter types | Numeric |
| Next 17 Rows (FDAT) | These 10 columns hold the following information on the 12 leaf litter types,
root litter, fresh wood, twigs, and well-decayed wood: 1. The weight of an incoming cohort of litter (initialized to zero); 2. Initial percent of nitrogen; 3. Grams of nitrogen immobilized per gram weight loss; 4. Critical percent of nitrogen; 5. Litter type: 1 through 12 are the 12 leaf-litter types in order of decreasing decay rate and increasing nitrogen-immobilization rate and correspond to species parameter TL. Thirteen is root litter. Fourteen and fifteen are fresh wood from trees less than or greater than 10 cm dbh, respectively. Sixteen is twig litter. Seventeen is well-decayed wood not yet humus; 6. Destination when cohort reaches critical percent to nitrogen (1 = humus; 2 = well-decayed wood); 7. Initial percent of lignin; 8 & 9. Lignin decay parameters [see Eq. B-8, Appendix 2, in Pastor and Post (1985)]; and 10. Ash correction factor. [See Table 4 and Appendix B in Pastor and Post (1985)] |
Numeric |
| NCOHORT | Number of cohorts present in the forest floor in any year (initially one for humus) | Numeric |
| BASESC | Starting humus weight | Mg/ha |
| BASESN | Starting N content |
Notes: NLVAR and NLT are used as counters for reading decomposition parameters into array FDAT.
Example of Input Data (in the file NSWforests.dat from linkages_rothc.zip)
| KPRNT= 1 KLAST= 100 NYEAR=1001 IPOLAT= 2 0. 1001. PLAT= -35.60 PLONG=149.1 BGS= 0. EGS=350. FC=34.6 DRY=17.3 SW100=31.0 MEAN T 22.0 22.8 22.5 20.9 18.3 15.3 13.4 12.9 14.1 16.3 18.5 20.4 ... NSPEC= 5 BMSPEC= 5 ... EUCALYPTUS PILULARIS 6138. 3216. .0762 45.75 1 350. 171. 0. 0. 0. FFTFF 200 1 .200 -7 5 2.79 219.77 .00179 -0.6 1.0 500. .804 .069 3.3 3. 10.59 0.062 9.31 -3.031 -3.482 -3.934 -2.729 2.500 2.377 2.650 1.550 ... QUERCUS BOREALIS 3250. 1100.945294.522250. 87.332.12. 40.TFFFF 40 72 .225 -17. 9 2.79 219.77 .00179 -0.6 1.0 440. .904 .095 1.0 1. ... NLVAR = 10 NLT = 17 0. .0068 .0251 .0183 1. 1. .039 .5217 .336 .90 ... NCOHRT = 1 74. 1.640 18. 0. |
Model Output Data. Selected model output data from the execution of LINKAGES Version RothC are provided in Table 1 of Ranatunga et al. (2008). The data represent long-term averages of aboveground biomass, coarse woody biomass, soil carbon, and total carbon for changing intensity and frequency of cutting cycles for three harvesting schemes (quota, integrated, and whole tree).
User-Defined Input Data
Site data can be specified within any version of LINKAGES, but must include the following:
- Latitude for making sun-angle corrections;
- Days of the year the growing season begins and ends (last and first killing frost);
- Monthly mean temperature (degrees C) and precipitation (cm) and their standard deviations;
- Soil field-moisture capacity (cm) and wilting point (cm); and
- Initial soil organic matter and nitrogen contents (Mg/ha).
Run parameters may also be user defined such as number of years, number of plots, and output interval.
Companion Files
There are four companion files with this data set described in the table below.
| COMPANION FILES for LINKAGES Versions | DOWNLOAD LOCATION | DESCRIPTION |
|---|---|---|
| LINKAGES Version 1.0 | http://daac.ornl.gov/daacdata/model_archive/LINKAGES/comp/ORNL_TM-9519.pdf | Additional documentation and user's guide for LINKAGES v 1.0 This is Pastor and Post (1985). |
| LINKAGES Version 2.2 | http://daac.ornl.gov/daacdata/model_archive/LINKAGES/comp/linkages_v2_2.pdf | Additional documentation for LINKAGES v 2.2. Also see ORNL_TM-9519 |
| http://daac.ornl.gov/daacdata/model_archive/LINKAGES/comp/linkages_v2_2_readme.txt | ||
| http://daac.ornl.gov/daacdata/model_archive/LINKAGES/comp/LINKAGES.pdf | LINKAGES guide document (this html document) in .pdf format |
NOTE: For additional information about LINKAGES Version RothC, see Ranatunga et al. (2008).
Model Descriptions
The LINKAGES v 1.0 model was written in FORTRAN by J. Pastor and W.M. Post (Environmental Sciences Division, Oak Ridge National Laboratory, Oak Ridge, Tennessee 37831, USA) to run on the ORNL IBM 3033. The source code for LINKAGES v 1.0 is provided in this model archive product. Full documentation is given in Pastor and Post (1985; 1986). Source codes and documentation for two subsequent modifications of the model are also included in this model archive product: LINKAGES v 2.2 (Wullschleger et al., 2003) and LINKAGES_RothC (Ranatunga et al., 2008).
LINKAGES v 1.0 Main Program
The main program establishes all common blocks, the seeds for the random number generator, and calls subroutines in order of execution. All calculations of biological interest are done in the subroutines. Arrays and variables used throughout the model and passed between subroutines are arranged in common blocks summarized in this documentation file and described in detail in the "User's Guide to the Computer Code" in Pastor and Post (1985). Also see Table 1 in Pastor and Post (1985) for variables, units, and definitions in COMMON blocks.
The basic structure of the model is a set of three subroutines (TEMPE, MOIST, DECOMP) which determine site conditions (degree-days, available soil water, available soil N, respectively) and a set of three demographic subroutines (BIRTH, GROW, KILL) which calculate tree growth and population dynamics. These two sets of subroutines are linked by a subroutine (GMULT) which calculates degree-day, soil moisture, and soil nitrogen growth multipliers. The amount of light available to each tree, an additional site characteristic, is a function of the forest canopy structure and is modeled in both BIRTH and GROW. Subroutines MOIST and DECOMP implement the equations modeling soil water and N availability. Subroutine TEMPE calculates monthly temperatures, which vary stochastically around mean values.
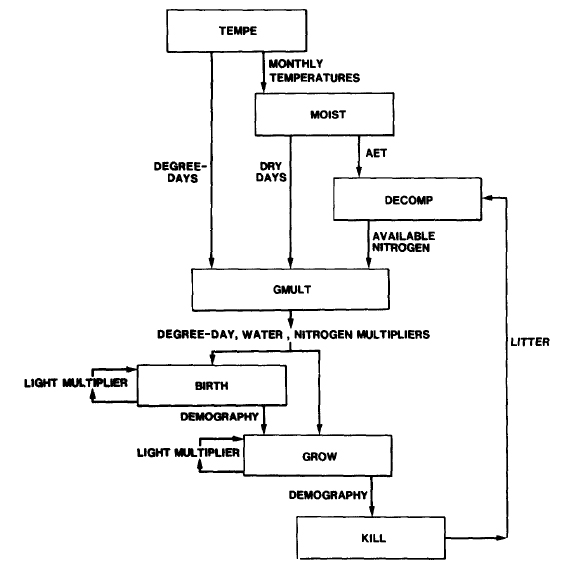
Figure 1. Model flow chart. Rectangles represent subroutines, and arrows indicate important information flows between subroutines. Source: Pastor and Post (1985).
LINKAGES v 2.2
LINKAGES v 2.2 (Wullschleger et al., 2003) is a modification of the original LINKAGES (v 1.0) model that reflects important results from the Throughfall Displacement Experiment (TDE; Hanson and Wullschleger, 2003). These included the following:
1. The monthly description of evapotranspiration (ET) was replaced with a daily scheme in which evaporation from the soil surface and canopy transpiration were treated separately (Shuttleworth and Wallace, 1985; Federer et al,. 1996). A maximum stomatal conductance is specified for the stand, and transpiration is modeled on the basis of the response of stomatal conductance to radiation, temperature, vapor pressure deficit, and extractable soil water. Interception losses are determined for the canopy from leaf area and stem area index (Federer, 1995).
2. The bucket model of soil water extraction in LINKAGES v1.0, which was predicted on the basis of a single soil layer, was replaced with an approach that uses multiple soil layers and a scheme that extracts water for transpiration from each soil layer as modified by the relative distribution of roots within the soil profile. Eighty-one percent of the total root biomass is allocated to the upper 50 cm of soil, another 11% to the layers from 50 to 70 cm, and the remaining 8% to deeper soil profiles (70 to 100 cm).
In addition to these enhancements, several lessons learned from research specifically on the TDE were used to modify the LINKAGES model:
3. The calculation of drought days was weighted according to the time of year that soil water deficits occur. This weighting factor reflects the fact that, although late season droughts are frequently observed on the TDE, they are of little consequence to the growth increment of the species studied on the TDE in comparison to early season droughts. As characterized by Hanson and Weltzin (2000) and Hanson et al. (2001), there is a temporal mismatch between late-season drought and diameter growth. The weighting factor is an attempt to account for this temporal mismatch.
4. Rather than allow seedlings, saplings, and mature trees to have equal access to all soil layers and thus to all extractable soil water, roots are restricted to specific soil layers based on whether plants are designated seedlings, saplings, or mature trees. Seedlings occupy the soil layers from 0 to 50 cm, saplings occupy soil layers from 0 to 70 cm soil layers, and mature trees occupy the entire soil profile. The number of drought days for each size class is estimated separately, and as a result, the LINKAGES v 2.2 model mimicks the differential susceptibility of seedlings, saplings, and mature trees to drought.
Other modifications to LINKAGES were also made. These changes include replacing the parabolic dependency of diameter growth on growing degree days with an asymptotic function for each species that mimicks the lower portion of the temperature-response function but does not impose a growth reduction under higher temperatures (Bugmann and Solomon, 2000). Furthermore, canopy leaf area development is made a function of air temperature, thus allowing for year-to-year variation in stand phenology.
LINKAGES_RothC
LINKAGES v RothC was modified from LINKAGES v 1.0 for an investigation into the influence of harvest management practices on carbon sequestration in Eucalyptus dominated forest stands of eastern Australia (Ranatunga et al., 2008). The original decomposition sub-routines of LINKAGES v 1.0 were modified by adding components of the Rothamsted (RothC) soil organic matter turnover model, hence the name LINKAGES_RothC. This change and other modifications are briefly described below. See details in Ranatunga et al. (2008).
1. Modification to soil carbon dynamics. To improve predictions of soil carbon (SC) sequestration, the single soil compartment in LINKAGES v 1.0 was replaced with the RothC (Jenkinson, 1990). RothC simulates the behavior of soil organic matter by dividing it into five compartments. Each compartment decomposes at a characteristic rate as described by a first-order process, with turnover times ranging from several months to over 1,000 years.
2. Nitrogen modifications. Nitrogen, not a part of RothC formation, is tracked in LINKAGES. When each of soil organic matter pools decomposes, an amount of N is transferred to the available N pool based on the current C/N ratio of the contributing pool.
3. Harvest management practices. LINKAGES v 1.0 was modified to accommodate three harvest regimes, each of which depends on the type of timber required. Harvest requirements are read in the main program and then stems are transferred to the KILL sub-routine in LINKAGES to remove trees from the plot, based on the type of harvest operation being simulated.
4. Plot size and light function. The original version of LINKAGES simulates, on a yearly cycle, the establishment, growth, and mortality of all trees in a 1/12 ha plot (0.083 ha). This small plot size is to capture successional dynamics in the gap created by one large, mature tree (Shugart and West, 1979). To provide for simulation of the different harvesting options, the plot size was increased to 1 ha. While this adjustment may alter the nature of species replacement sequences resulting from gap-phase processes, this is not critical for consideration of managed forests that are subject to larger scale disturbances. This adjustment also had implications for estimation of light penetration at different levels in the canopy. Since eucalypt forests are evergreen and have high specific leaf mass, the light function was changed to accommodate these differences in line with Hall and Hollinger (2000).
5. Biomass function. Biomass equations for wood, stem bark, branch and leaf for the Eucalyptus species in this forest were incorporated.
6. Model parameterization. There are 23 parameters required for each species in the new version of LINKAGES (RothC). The parameters are described in Appendix B of Ranatunga et al. (2008).
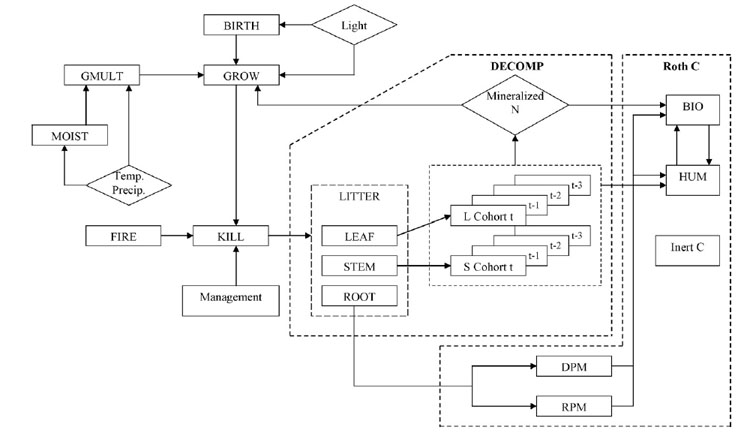
2. Schematic diagram of LINKAGES after incorporating RothC. Source: Ranatunga et al. (2008).
Data Access:
This data is available through the Oak Ridge National Laboratory (ORNL) Distributed Active Archive Center (DAAC).
Data Archive Center:
Contact for Data Center Access Information:
E-mail: uso@daac.ornl.gov
Telephone: +1 (865) 241-3952
References:
Pastor, J., and W.M. Post. 1985. Development of a linked forest productivity-soil process model. Technical Manual ORNL/TM-9519. Environmental Sciences Division, Oak Ridge National Laboratory, Oak Ridge, Tennessee, USA. 167 pp (http://daac.ornl.gov/daacdata/model_archive/LINKAGES/comp/ORNL_TM-9519.pdf).
Pastor, J., and W.M. Post. 1986. Influence of climate, soil moisture, and succession on forest carbon and nitrogen cycles. Biogeochemistry 2: 3-27. doi:10.1007/BF02186962
Ranatunga, K., R.J. Keenan, S.D. Wullschleger, W.M. Post, and M.L. Tharp 2008. Aboveground biomass and soil carbon stocks as influenced by harvest management practices in New South Wales, Australia: Simulations with the forest succession model LINKAGES. Forest Ecology and Management 255: 2407-2415. doi:10.1016/j.foreco.2008.01.002
Wullschleger, S.D., C.A. Gunderson, M.L. Tharp, W.M. Post, and D.C. West. 2003. Simulated patterns of forest succession and productivity as a consequence of altered precipitation. pp. 433-446. In Hanson, P.J., and S.D. Wullschleger (eds.). North American Temperate Deciduous Forest Responses to Changing Precipitation Regimes. Springer-Verlag, New York, NY. 472 pp.
Additional Sources of Information:
Botkin, D.B., F.F. Janak, and J.R. Wallis. 1972. Some ecological consequences of a computer model of forest growth. Journal of Ecology 60: 849-872.doi:10.2307/2258570
Bugmann H.K.M., and A.M. Solomon. 2000. Explaining forest composition and biomass across multiple biogeographical regions. Ecol. Appl. 10: 95-114. doi:10.1890/1051-0761(2000)010[0095:EFCABA]2.0.CO;2
Dale, V.H., K.O. Lannom, M.L. Tharp, D.G. Hodges, and J. Fogel. 2009. Effects of climate change, land-use change, and invasive species on the ecology of the Cumberland Forests. Canadian Journal of Forest Research 39: 467-480. doi:10.1139/X08-172
Dale, V.H., M.L. Tharp, K.O. Lannom, and D.G. Hodges. 2010. Modeling transient response of forests to climate change. Science of the Total Environment 408: 1888-1901. doi:10.1016/j.scitotenv.2009.11.050
Federer, C.A. 1995. BROOK90: a simulation model for evaporation, soil water, and streamflow, Version 3.1. Computer freeware and documentation. USDA Forest Service, Durham, N.H.
Federer, C.A., C. Vörösmarty, and B. Fekete. 1996. Intercomparison of methods for calculating potential evapotranspiration in regional and global water balance models. Water Resour. Res. 32: 2315-2321. doi:10.1029/96WR00801
Hall, G.M.J., and D.Y. Hollinger. 2000. Simulating New Zealand forest dynamics with a generalized temperate forest gap model. Ecol. Appl. 10: 115–130. doi:10.1890/1051-0761(2000)010[0115:SNZFDW]2.0.CO;2
Hanson, P.J., and J.F. Weltzin. 2000. Drought disturbances from climate change: response of United States forests. Sci. Total Environ. 262: 205-220. doi:10.1016/S0048-9697(00)00523-4
Hanson, P.J., and S.D. Wullschleger (eds.). 2003. North American Temperate Deciduous Forest Responses to Changing Precipitation Regimes. Springer-Verlag, New York, NY. 472 pp.
Hanson, P.J., D.E. Todd, and J.S. Amthor. 2001. A six-year study of sapling and large-tree growth and mortality responses to natural and induced variability in precipitation and throughfall. Tree Physiol. 21: 345-358. doi:10.1093/treephys/21.6.345
Jenkinson, D.S. 1990. The turnover of organic carbon and nitrogen in soil. Phil. Trans. R Soc. Lond. B 329: 361–368. doi:10.1098/rstb.1990.0177
Muhairwe, C.K. 1998. Diameter increment models for Upper North East and Lower North East New South Wales. Final report prepared for the FRAMES Technical committee, Forest Resources Branch, State Forests of NSW, Australia.
Pastor, J., and W.M. Post. 1988. Response of northern forests to CO2-induced climatic change: Dependence on soil water and nitrogen availabilities. Nature 334: 55-58. doi:10.1038/334055a0
Pastor, J., and W.M. Post. 1993. Linear regressions do not predict the transient responses of eastern North American forests to CO2-induced climate change. Climatic Change 23: 111-119. doi:10.1007/BF01097332
Pastor, J., R.H. Gardner, V.H. Dale, and W.M. Post. 1988. Successional changes in nitrogen availability as a potential factor contributing to spruce declines in boreal North America. Canadian Journal of Forest Research 17: 1394-1400. doi:10.1139/x87-216
Post, W.M., J. Pastor, A.W. King, and W.R. Emanuel. 1992. Aspects of the interaction between vegetation and soil under global change. Water, Air, and Soil Pollution 64: 345-363. doi:10.1007/BF00477110
Post, W.M., and J. Pastor. 1996. LINKAGES - An individual-based forest ecosystem model. Climatic Change 34: 253-261. doi:10.1007/BF00224636
Shugart, H.H., and D.C. West. 1979. Size and pattern of simulated forest stands. Forest Science 25: 120-122.
Shuttleworth, W.J., and J.S. Wallace. 1985. Evaporation from sparse crops – An energy combination theory. Quart. J. R. Met. Soc. 111: 839-855. doi:10.1002/qj.49711146910
Solomon, A.M., M.L. Tharp, D.C. West, G.E. Taylor, J.M. Webb,and J.M. Trimble. 1984. Responses of unmanaged forests to CO2-induced climatic change: available data, initial tests, and data requirements. DOE/NDD-0053-TR009. U.S. Department of Energy, Washington, D.C.
Wullschleger, S.D., C.A. Gunderson, M.L. Tharp, W.M. Post, and D.C. West. 2003. Simulated patterns of forest succession and productivity as a consequence of altered precipitation. pp. 433-446. In Hanson, P.J., and S.D. Wullschleger (eds.). North American Temperate Deciduous Forest Responses to Changing Precipitation Regimes. Springer-Verlag, New York, NY. 472 pp.