Get Data
Summary:
This model product contains the source code for the Ecosystem Demography Model (ED version 1.0) as well as model input and output data files for the conterminous United States. The ED is a mechanistic ecosystem model built around established sub-models of leaf level physiology, organic matter decomposition, hydrology, and functional biodiversity. It was used herein to estimate ecosystem carbon stocks and fluxes in the conterminous U.S. at 1.0 degree resolution from 1700 to 1990. Output data of carbon stocks and fluxes are stored in NetCDF format.
To produce the U.S. scenario, ED was run from an estimated state of ecosystems in the year 1700 to an estimated state of ecosystems in the year 1990 for each 1 degree by 1 degree grid cell through time using ISLSCP Initiative I climate and soil data and a gridded land-use history reconstruction as inputs (Hurtt et al., 2002). The land-use history was based on several sources including: spatial distribution of potential vegetation in 1700, spatial patterns of cropland from 1700 to 1990, regional estimates of land use and logging from 1700 to 1990, and Forest Inventory and Analysis (FIA) data on the current age distribution of forest stands. The Miami Land Use History Model (Miami-LU), a far simpler empirically-based ecosystem model, was used to track the history of disturbance, land use, fire, and ecosystem recovery. The effects of fire suppression were also included. Atmospheric CO2 concentrations and climatic conditions were held constant throughout the runs to focus on the consequences of land-use and fire-management changes on carbon stocks and fluxes.
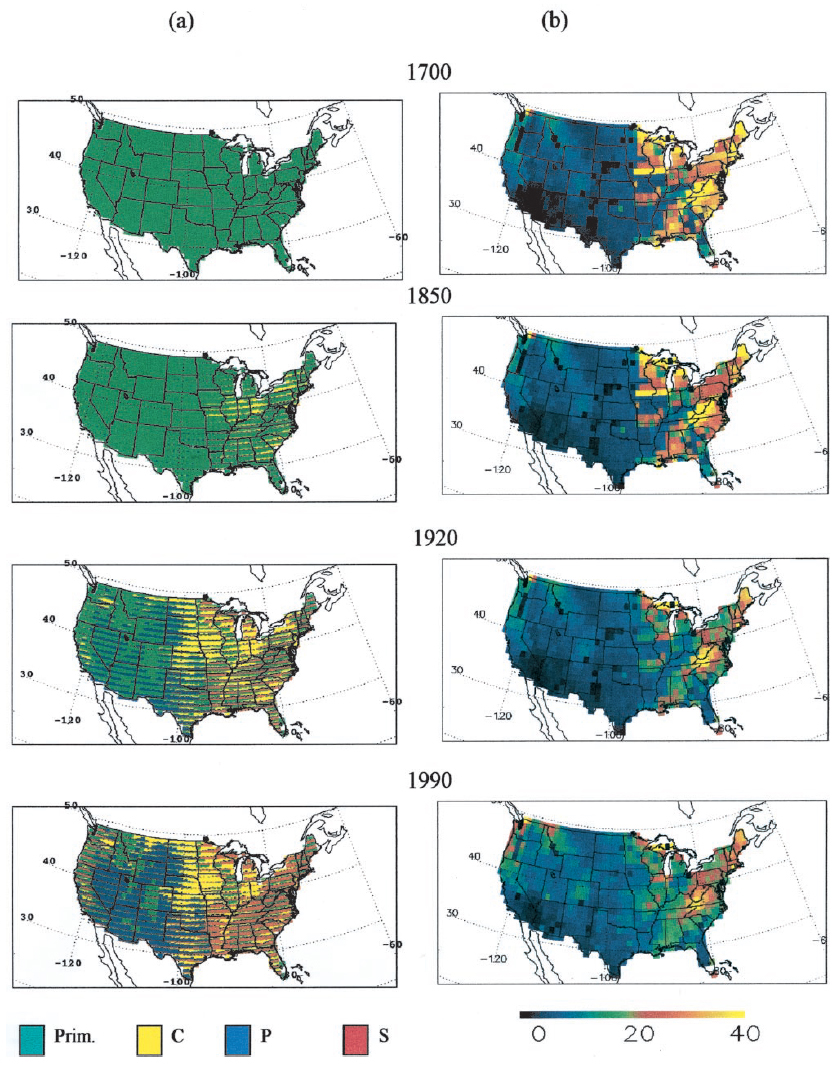
Figure 1. ED tracks patterns of land use and carbon stocks throughout the model simulation. Shown here are estimated patterns of land use (column a) and average total carbon stocks (kg C/m2) (column b) at four times in history: 1700, 1850, 1920, and 1990. In the land-use maps, each 1 x 1 degree grid cell is colored according to the fraction of the grid cell that is estimated to be in each of four land-use classes: primary vegetation (green), secondary vegetation (red), crop (yellow), and pasture (blue). In particular, each grid cell is shown as a stacked bar chart with colors in a fixed order. Spatial patterns of the relative amounts of land use in each of these four classes can be seen on each map. However, subgrid-scale spatial patterns and the impression of bands spanning a series of adjacent cells are the result of consistently applied coloring rules and do not illustrate spatial patterns of land use within grid cells or banded patterns of land use between grid cells.
Data Citation:
Cite this data model as follows:
Hurtt, G.C., S.W. Pacala, P.R. Moorcroft, J. Caspersen, E. Shevliakova, R.A. Houghton, B. Moore III, and J. Fisk. 2013. Ecosystem Demography Model: U.S. Ecosystem Carbon Stocks and Fluxes, 1700-1990. ORNL DAAC, Oak Ridge, Tennessee, USA. http://dx.doi.org/10.3334/ORNLDAAC/1160
Links to Related Data Products:
Ecosystem Demography Model: Scaling Vegetation Dynamics Across South America [http://daac.ornl.gov/cgi-bin/dsviewer.pl?ds_id=1149]
LBA-ECO LC-08 Ecosystem Demography Model Estimated C, NPP, and Biomass for Amazonia [http://daac.ornl.gov/cgi-bin/dsviewer.pl?ds_id=1102]
Model Product Description
Data Set Files:
| Data Files | Description |
|---|---|
| code.zip | The compressed file code.zip, expands to a sub-directory /code/ containing the ED model code files for the conterminous United States, written in C. |
| cvode.zip | This compressed file, cvode.zip, expands to a sub-directory: /cvode/ containing the ED model integration code, written in C. |
| inputs.zip | This compressed file, inputs.zip, expands to the subdirectory /inputs/ which contains the files GRIDAREA.GRD, land_sea.mask, precip.islscp.us, soi_temp.islscp.us, soils.islscp.us, sois.txt, and temp.islscp.us. There are also the subdirectories /lu/ and /mechanism.in/. See Input data section for complete file descriptions. |
| published_output.zip | This compressed file, published_output.zip, expands to a sub-directory: /published_output/ containing one NetCDF (.nc) described below in the published output data section. |
Input Data:
ISLSCP I Initiative Data. For the U.S., the model was run using global data from the International Satellite Land Surface Climatology Project (ISLSCP) Initiative I. These data sets provide modelers with many of the fields required to prescribe boundary conditions and initialize and force a wide range of land-biosphere-atmosphere models. All of the data have been processed to the same spatial resolution (1 deg. x 1 deg.), using the same land/sea mask and processing steps to ensure spatial and temporal continuity of the data. The data sets cover the period 1987-1988 at 1-month time resolution for most of the seasonally varying quantities and at 6-hourly resolution for the near-surface meteorological and radiative forcings. The data for 1987 and 1988 were averaged into a single average year.
| FILE NAMES | VARIABLES | UNITS | SOURCE |
|---|---|---|---|
| precip.islscp.us | Monthly mean precipitation amount (based on gauge measurements) | mm | Global Precipitation Climatology Project/Global Precipitation Climatology Center (GPCP/GPCC) |
| soil_temp.islscp.us | Monthly mean depth soil temperature | Kelvin | European Center for Medium-Range Weather Forecasts (ECMWF) |
| soils.islscp.us | depth = soil depth (estimate of the depth from the soil surface to bedrock or other impermeable layer) | mm | NASA: Webb et al. (1993) |
| texture = soil texture (classification: 1=coarse; 2=medium/coarse; 3=medium; 4=fine/medium; 5=fine; 6=ice; 7=organic; 0=ocean) | Index (0-7) | NASA: Zobler et al. (1986) | |
| Theta_max (matrix potential at saturation) | m | Meeson et al. (1995); Sellers et al. (1995)Note: The ISLSCP data set was specifically designed for large-scale biosphere modeling, providing a consistent global data set of climatological variables and soil characteristics | |
| k_sat (saturated hydraulic conductivity or Ksat) | m/s | ||
| tau (an empirical power governing the rate at which conductivity decreases as saturation levels decrease) | dimensionless | ||
| temp_islscp_us | Monthly average air temperature (6-hourly resolution) at 2 meters above the ground | degrees Celsius | ECMWF |
| sois.txt | Locations of 12 U.S. sites that were used to evaluate the size- and age-structured (SAS) approximation | decimal degrees | Hurtt et al. (2002) |
Input Data Sub-Directories:
/mechanism.in/: The mechanism data files (lat**lon**.in) provide pre-computed, monthly-integrated photosynthesis and transpiration per leaf area for 121 light levels within the canopy. There are two sets of files, one for each physiology (C3 and C4) with one file per grid cell.
| VARIABLES and UNITS | SOURCE |
|---|---|
Files list 5 columns for each light level for each month:
|
Hurtt et al. (2002) |
/lu/: The 'lu' data files (lat**lon**.lu) provide annual transitions between land-use types.
| VARIABLES and UNITS | SOURCE |
|---|---|
The files have the following columns: longitude and latitude (decimal degrees), year (yyyy), fraction of grid cell area transitioned between land-use types:
|
Hurtt et al. (2002) |
Note: The last line of the file contains a single value that specifies the fraction of new secondary forest that is not a plantation.
Additional Input Files
| FILE NAME | DESCRIPTION | VARIABLES and UNITS | SOURCE |
|---|---|---|---|
| g2s_1d_us.dat | Map grid cells to state and region for accounting and reporting | Contains 5 columns: longitude and latitude (decimal degrees), U.S. state (text code), unused (-9), and region (text code) | Hurtt et al. (2002) |
| GRIDAREA.GRD | One degree global ASCII map of grid cell area | km2 | |
| land_sea.msk | Land - sea mask | Value of 1 for land and 0 for water |
Output Data:
File name: published_output.zip :
This file contains estimated patterns of land use and average total carbon stocks for 1700, 1850, 1920, and 1990. The output was used to generate the maps shown above in Figure 1.
| Data File | Variables and Units | File Format |
|---|---|---|
| ed_us.nc | There are four time steps (1700, 1850, 1920, and 1990) for each variable: fraction of crop, pasture, primary vegetation, and secondary vegetation (percent within each grid cell) and total carbon density (kg C/m2 within each grid cell). | The output data file is in NetCDF format. |
Spatial & Temporal Scales
The U.S. data set has a grid cell size of 1 degree by 1 degree. This data set covers conterminous United States, with the output data files covering a region of 50 degrees N to 24 degrees N latitude and 66 degrees W to 125 degrees W longitude. The input data span an overall area of 52 degrees N to 21.5 degrees N latitude and 30.5 degrees W to 164.5 degrees W longitude. The spatial coverage of individual input data files varies. The data represent the 1700, 1850, 1920, and 1990 time period covered by the input variables.
Data Format
The output data file is in NetCDF format. The full data set contains 70 rows [the x-dimension (longitude)] by 25 [the y-dimension (latitude)] columns of floating point data. The fill value for missing output data is -99.9. The input data files from ISLSCP Initiative I are ASCII text files. The C3 and C4 mechanism data and land use input data are also ASCII text files The fill value for missing input data values is -99. The fill value for non-land/ocean grid cells (sea mask) is 0.
Variable Description
ED output provides estimated historical patterns of land use and total carbon stocks (above- plus below-ground) at four time intervals: 1700, 1850, 1920, and 1990 (Figure 1).
a) Land Use Maps. Each land use map shows the fraction of each grid cell in each of four categories: crop, pasture, primary vegetation, and secondary vegetation (percent (%) area within each 1 degree grid cell).
b) Average Total Carbon Density Maps. Each map of total carbon shows the average total carbon density for each grid cell (kgC/m2), including all above- and below-ground carbon stocks both in and out of agriculture. Changes in total carbon between time periods are the net result of gains from growth and losses that include respiration, decomposition, fire, and removals from land clearing, harvesting, grazing, and logging.
Site boundaries: (All latitude and longitude given in decimal degrees)
| Site (Region) | Westernmost Longitude | Easternmost Longitude | Northernmost Latitude | Southernmost Latitude | Geodetic Datum |
|---|---|---|---|---|---|
| Conterminous United States | -125 | -66 | 50 | 24 | World Geodetic System, 1984 (WGS-84) |
Model Documentation and User's Guide
Description:
The ED model solves a system of size- and age-structured partial differential equations (PDEs) for each grid cell numerically using the method of characteristics. The model, written in C, makes extensive use of C structures, and pointers and dynamic memory allocation.
Steps for compiling and running the Ecosystem Demography Model (ED):
1. Build the integration library
The ED model uses Scott D. Cohen's and Alan C. Hindmarsh's CVODE integration code. To build the integration library, cd to the /cvode/ subdirectory. Check the Makefile to ensure the C compiler, paths and compile flags are appropriate for your system. Compile the library by typing 'make'. If successful, the library libcvode.a will appear in /cvode/lib.
2. Compile the ED model executable
cd to the /code sub-directory of the ED directory tree. Edit the Makefile to set the C compiler, paths and compile flags appropriately for your system.
Edit the header file site.h, using the macros to set desired options. Details of the different options are included in the header file comments.
Important settings include:
TMAX - float indicating the number of years to be integrated (eg 200.0)
REGION - integer flag. Set to 0 to run model for the grid cells specified in inputs/sois/soi.list. Set to 1 perform a regional integration.
RESTART - integer flag indicating whether run is a restart. If set to 0, begins integration from a low initial density (0.1 indivs/m2) of seedlings (size HGTMIN) of each plant functional type. When RESTART is set to 1, initial conditions are read in from restart files in the RESTART/ subdirectory. See output section below for more details on restart files.
LANDUSE - integer flag. Set to 1 enable transitions between 5 land-use types. Generally, the model is spun-up with LANDUSE set to 0, and then RESTARTed from this state with LANDUSE set to 1.
Build the ED model executable (ed) by typing 'make'.
Additional model parameters are specified the init_data sub-routine found in init_data.c source file
3. Run ED
Run the ED model by typing './ed prefix', where prefix is a user defined string to prepend to output file names. Output indicating the progress of the integration will be printed to the stdout and output data will accumulate in the current directory (see below for details). The frequency of printing is set by the value of the macro PRINT_OUTPUT_FREQ.
Output Files
For the grid-cells specified in inputs/sois/soi.list, numerous files of the form pfx.latxxlonyy.* (where pfx is the prefix specified in the command line argument and xx and yy are the lat/lon coordinates of the North-West corner the grid cell). These files contain detailed information on the ecosystem structure and fluxes for the grid cell. Files with the word 'patch' contain contain information on the age-related subgrid-scale variability in ecosystem structure and fluxes. Consult model source files for more details on the various quantities output.
If a regional integration is performed, the model will also output numerous files of the form basename.region.* These files contain gridded region-wide snapshots of model quantities. Output is in the form of a [lon] x [lat] x [time] matrix of values. Longitude varies fastest followed by latitude, then time. Consult model source files for more details on the quantities output.
During the integration two restart files per grid cell (pfx.latxxlonyy.pss and pfx.latxxlonyy.css) are created periodically in the 'RESTART' subdirectory (frequency is determined by the value of the macro PRINT_SS_FREQ).
Data Access:
This data is available through the Oak Ridge National Laboratory (ORNL) Distributed Active Archive Center (DAAC).
Data Archive Center:
Contact for Data Center Access Information:
E-mail: uso@daac.ornl.gov
Telephone: +1 (865) 241-3952
References:
Hurtt, G.C., S.W. Pacala, P.R. Moorcroft, J. Caspersen, E. Shevliakova, R. A. Houghton, and B. Moore III. 2002. Projecting the future of the U.S. carbon sink. Proceedings of the National Academy of Sciences of the United States of America 9(3): 1389-1394.
Additional Sources of Information:
Hurtt G.C., P.R. Moorcroft, S.W. Pacala, and S.A. Levin. 1998. Terrestrial models and global change: challenges for the future. Global Change Biology 4: 581-590.
Meeson, B.W., F.E. Corprew, J.M.P. McManus, D.M. Myers, J.W. Closs, K.J. Sun, D J. Sunday, and P.J. Sellers. 1995. ISLSCP Initiative I-global data sets for land-atmosphere models, 1987-1988. American Geophysical Union, Washington, D.C., U.S.A. [Available on CD-ROM.]
Morrill, J.C. 1999. Sensitivity of a land surface model to the diurnal distribution of downward longwave radiation. Journal of the Meteorological Society of Japan 77: 265-279.
Sellers, P.J., et al. 1995. An overview of the ISLSCP Initiative I global data sets. In Meeson, B W., F.E. Corprew, J.M.P. McManus, D.M. Myers, J.W. Closs, K.J. Sun, D J. Sunday, and P.J. Sellers. ISLSCP Initiative I-global data sets for land-atmosphere models, 1987-1988. American Geophysical Union, Washington, D.C., USA. [Available on CD-ROM.]
Webb, R.S., C.E. Rosenzweig, and E.R. Levine. 1993. Specifying land surface characteristics in general circulation models: soil profile data set and derived water-holding capacities. Global Biogeochemical Cycles 7: 97-108.
Zobler, L. 1986. A world soil file for global climate modeling. NASA Tech. Memo. 8780. NASA. pp 36.