Documentation Revision Date: 2023-04-11
Dataset Version: 1
Summary
The MASTER instrument is a modified Daedalus Wildfire scanning spectrometer that flies on a variety of multi-altitude research aircraft and provides spectral information similar to that provided by the Moderate Resolution Imaging Spectroradiometer (MODIS) and the Advanced Spaceborne Thermal Emission and Reflection Radiometer (ASTER), which are aboard two NASA Earth Observing System satellites: Terra and Aqua. The primary goal of this airborne campaign was to collect data for validating Suomi-NPP satellite measurements.
Suomi National Polar-orbiting Partnership (Suomi-NPP) serves as a bridge between the Earth Observing System (EOS) satellites and the series of Joint Polar Satellite System (JPSS) satellites. The Suomi-NPP satellite, deployed in 2011, carries five science instruments and tests key technologies for the JPSS missions. Suomi-NPP addresses the challenge of acquiring a wide range of land, ocean, and atmospheric measurements for Earth system science while simultaneously preparing to address operational requirements for weather forecasting.
This dataset includes a total of 978 data files: 134 files in Hierarchical Data Format (HDF-4; *.hdf) format, 340 ENVI raster files (*.dat and *.hdr) that are compressed (*.zip), 219 files in Keyhole Markup Language Zipped (KMZ; *.kmz) format, 85 Portable Network Graphics (PNG; *.png) files that are compressed (*.zip), 44 text (*.txt) files, 11 archives of text files that are zipped (*.zip), 11 flight maps as GIF (*.gif) images, and 134 browse images in JPEG (*.jpg) format.
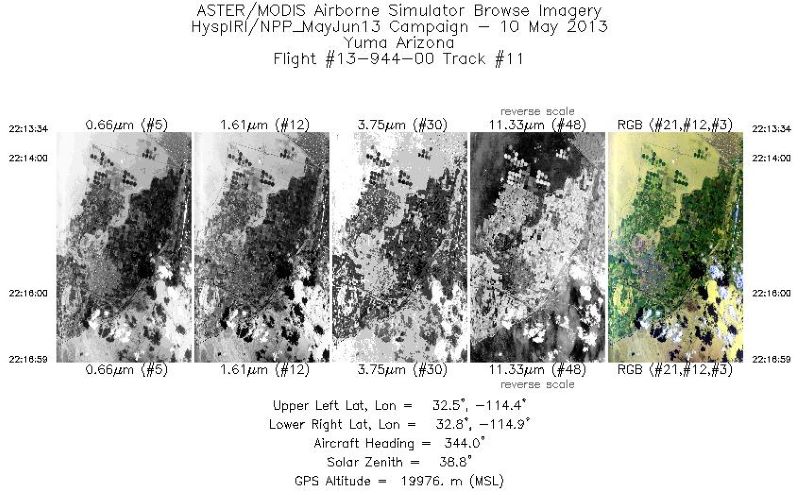
Figure 1. Single band images and an RGB composite image from flight track 11 acquired on 10 May 2013 over Yuma, Arizona, U.S. Source: MASTERL1B_1394400_11_20130510_2213_2216_V01.jpg
Citation
Hook, S.J., J.S. Myers, K.J. Thome, M. Fitzgerald, A.B. Kahle, Airborne Sensor Facility NASA Ames Research Center, A. Larar, and R.O. Green. 2022. MASTER: Suomi-NPP Airborne Campaign, 2013. ORNL DAAC, Oak Ridge, Tennessee, USA. https://doi.org/10.3334/ORNLDAAC/1969
Table of Contents
- Dataset Overview
- Data Characteristics
- Application and Derivation
- Quality Assessment
- Data Acquisition, Materials, and Methods
- Data Access
- References
Dataset Overview
This dataset includes Level 1B (L1B) and Level 2 (L2) data products from the MODIS/ASTER Airborne Simulator (MASTER) instrument. The spectral data were collected for the Suomi National Polar-orbiting Partnership (Suomi-NPP) instrument validation airborne campaign during 11 flights aboard a NASA ER-2 aircraft over California, Texas, and Oklahoma, U.S.; Baja California, Mexico; and eastern Pacific Ocean from 2013-05-07 to 2013-06-01. Data products include L1B georeferenced multispectral imagery of calibrated radiance in 50 bands covering wavelengths of 0.460 to 12.879 micrometers at approximately 50-meter spatial resolution. Derived L2 data products are emissivity in 5 bands in thermal infrared range (8.58 to 12.13 micrometers) and land surface temperature. The L1B file format is HDF-4, and L2 products are provided in ENVI and KMZ formats. In addition, the dataset includes flight paths, spectral band information, instrument configuration, ancillary notes, and summary information for each flight, and browse images derived from each L1B data file.
The MASTER instrument is a modified Daedalus Wildfire scanning spectrometer that flies on a variety of multi-altitude research aircraft and provides spectral information similar to that provided by the Moderate Resolution Imaging Spectroradiometer (MODIS) and the Advanced Spaceborne Thermal Emission and Reflection Radiometer (ASTER), which are aboard two NASA Earth Observing System satellites: Terra and Aqua. The primary goal of this airborne campaign was to collect data for validating Suomi-NPP satellite measurements.
Suomi National Polar-orbiting Partnership (Suomi-NPP) serves as a bridge between the Earth Observing System (EOS) satellites and the forthcoming series of Joint Polar Satellite System (JPSS) satellites. Suomi-NPP, deployed in 2011, carries five science instruments and tests key technologies for the JPSS missions. Suomi-NPP addresses the challenge of acquiring a wide range of land, ocean, and atmospheric measurements for Earth system science while simultaneously preparing to address operational requirements for weather forecasting.
Project: MODIS/ASTER Airborne Simulator
The MODIS/ASTER Airborne Simulator (MASTER) is a scanning spectrometer which flies on a variety of multi-altitude research aircraft and provides data similar to the Moderate Resolution Imaging Spectroradiometer (MODIS) and the Advanced Spaceborne Thermal Emission and Reflection Radiometer (ASTER). MASTER first flew in 1998 and has ongoing deployments as a Facility Instrument in the NASA Airborne Science Program (ASP). MASTER is a joint project involving the Airborne Sensor Facility (ASF) at the Ames Research Center, the Jet Propulsion Laboratory (JPL), and the Earth Resources Observation and Science Center (EROS).
Related Publication
Hook, S.J. Myers, J.J., Thome, K.J., Fitzgerald, M. and A.B. Kahle. 2001. The MODIS/ASTER airborne simulator (MASTER) - a new instrument for earth science studies. Remote Sensing of Environment 76:93–102. https://doi.org/10.1016/S0034-4257(00)00195-4
Related Datasets
Additional MASTER datasets are available on the ORNL DAAC MASTER project page.
Acknowledgments
The MASTER instrument is maintained and operated by the Airborne Sensor Facility (ASF) at NASA Ames Research Center in Mountain View, California, under the oversight of the EOS Project Science Office at NASA Goddard. Data processing was conducted at NASA Ames Research Center and the Jet Propulsion Laboratory at the California Institute of Technology in Pasadena, California.
Data Characteristics
Spatial Coverage: Portions of California, Texas, and Oklahoma, U.S.; Baja California, Mexico; and eastern Pacific Ocean
Spatial Resolution: 50 m
Temporal Coverage: 2013-05-07 to 2013-06-01
Temporal Resolution: One-time estimate
Study Area: All latitudes and longitudes given in decimal degrees.
| Site | Westernmost Longitude | Easternmost Longitude | Northernmost Latitude | Southernmost Latitude |
|---|---|---|---|---|
| California; Texas; Oklahoma; Baja California; eastern Pacific Ocean | -135.000 | -90.000 | 40.980 | 11.178 |
Data File Information
This dataset includes a total of 978 data files: 134 files in Hierarchical Data Format (HDF-4; *.hdf) format, 340 ENVI raster files (*.dat and *.hdr) that are compressed (*.zip), 219 files in Keyhole Markup Language Zipped (KMZ; *.kmz) format, 85 Portable Network Graphics (PNG; *.png) files that are compressed (*.zip), 44 text (*.txt) files, 11 archives of text files that are zipped (*.zip), 11 flight maps as GIF (*.gif) images, and 134 browse images in JPEG (*.jpg) format (Table 1).
There are different numbers of each type of file, which corresponds to the number of "flights" and "flight tracks. A "flight" is flown on a single day, and a "flight track" typically refers to a segment of a given flight. The number of flight tracks varies among flights (Table 2).
- There are 11 flights with 134 flight tracks (Table 2).
- For each of 134 flight tracks, there is one L1B data file in HDF format, one file in KMZ format, and one auxiliary browse image (*.jpg).
- L2 data are included for 85 of the 134 flight tracks. For each track, there is one L2 data file in KMZ format and five L2 data files in ZIP format.
- Four of the ZIP files contain L2 ENVI data for emissivity, land surface temperature, geographic coordinates, and quality assurance status. Each ZIP includes a binary data file (*.dat) and its header file (*.hdr).
- One ZIP file contains three L2 PNG files: RBG composite, single-band emissivity, and land surface temperature.
- For each flight, there is a collection of auxiliary files providing information about the flight and instrument configuration.
The primary data files are named MASTERLAA_BBBBBBBB_CC_YYYYMMDD_EEFF_GGHH_V0J-X.ext (e.g., MASTERL1B_1361900_01_20130518_1604_1651_V01.hdf).
The flight track-level browse images are named MASTERLAA_BBBBBBBB_CC_YYYYMMDD_EEFF_GGHH_V0J.jpg (e.g., MASTERL1B_1361900_01_20130518_1604_1651_V01.jpg).
The deployment-level auxiliary files are named MASTER_BBBBBBBB_YYYYMMDD_X.ext (e.g., MASTER_1361900_20130518_config.txt).
Elements of file names are described as:
AA = ”1B” or “2”, indicating L1B or L2 data level,
BBBBBBBB = flight number (Table 2),
CC = flight track,
YYYYMMDD = date of sampling,
EEFF = starting time at EE hour and FF minute,
GGHH = ending time at GG hour and HH minute,
J = version number for file,
X = the file content (see Table 1), and
ext = "hdf", "kmz", "gif", "jpg", "txt", or "zip", indicating the file extension.
Table 1. File names and descriptions.
| File Name | Level | File Type | Total Files | Description |
|---|---|---|---|---|
| Primary Data Files | ||||
| MASTERL1B_BBBBBBBB_CC_YYYYmmDD_EEFF_GGHH_V0J.hdf | L1B | HDF-4 | 134 | Multispectral radiance in 50 bands, pixel coordinates, sensor configuration, aircraft platform data, analysis parameters. The "CalibratedData" variable provides estimates of radiance in units of W m-2 sr-1 per micron. |
| MASTERL1B_BBBBBBBB_CC_YYYYmmDD_EEFF_GGHHV0J-RGB.kmz | L1B | KMZ | 134 | RGB composite browse image (in KMZ format) derived from corresponding bands of RGB wavelengths of L1B data. |
| MASTERL2_BBBBBBBB_CC_YYYYmmDD_EEFF_GGHH_V0J-emissivity_tes.zip | L2 | ENVI | 85 | Map of atmospheric corrected emissivity; Temperature and Emissivity Separation (TES) corrected data in 5 bands (wavelengths: 8.58, 9.02, 10.62, 11.32, and 12.13 µm). |
| MASTERL2_BBBBBBBB_CC_YYYYmmDD_EEFF_GGHH_V0J-images.zip | L2 | PNG | 85 | Three non-georeferenced images depicting (a) RGB composite using selected bands, (b) emissivity from a single band, and (c) land surface temperature. |
| MASTERL2_BBBBBBBBB_CC_ YYYYmmDD_EEFF_GGHH_V0J-location.zip | L2 | ENVI | 85 | Latitude and longitude coordinates for pixels in ENVI files. |
| MASTERL2_BBBBBBBB_CC_YYYYmmDD_EEFF_GGHH_V0J-LST.kmz | L2 | KMZ | 85 | Map of land surface temperature in degrees Kelvin. |
| MASTERL2_BBBBBBBB_CC_YYYYmmDD_EEFF_GGHH_V0J-QAmap.zip | L2 | ENVI | 85 | QA status for each pixel from TES algorithm, where 1 = divergence and 0 = convergence. |
| MASTERL2_BBBBBBBB_CC_YYYYmmDD_EEFF_GGHH_V0J-surface_temp.zip | L2 | ENVI | 85 | Map of land surface temperature (TES LST) in degrees Kelvin. |
| Auxiliary Files | ||||
| MASTERLAA_BBBBBBBB_CC_YYYYMMDD_EEFF_GGHH_V0J.jpg | L1B | JPEG | 134 | Browse figures; one image per flight track; multiple tracks per flight. |
| MASTER_BBBBBBBB_YYYYMMDD_ancillary.txt | - | Text | 11 | Ancillary information about flight including notes on aircraft platform, mission objective, and data evaluation. |
| MASTER_BBBBBBBB_YYYYMMDD_config.txt | - | Text | 11 | Instrument configuration information for flight. |
| MASTER_BBBBBBBB_YYYYMMDD_flightpath.gif | - | GIF | 11 | Map showing flight paths. |
| MASTER_BBBBBBBB_YYYYMMDD_spectral_band_info.txt | - | Text | 11 | Spectral band information for flight. |
| MASTER_BBBBBBBB_YYYYMMDD_spectral_response_table.zip | - | Text | 11 | Spectral response tables by band (ZIP archive of 50 text files). |
| MASTER_BBBBBBBB_YYYYMMDD_summary.txt | - | Text | 11 | Time and coordinates for start and end of flight tracks along with the number of scan lines, solar and instrument angles, and aircraft altitude. FTLT = flight track number. |
Data File Details
The HDF and ENVI files contain swath trajectory data using longitude and latitude coordinates. The spatial resolution is 46 to 52 m and is a function of aircraft altitude.
Table 2. Number of flight tracks per file data level for each MASTER flight during this 2013 campaign.
| Date | Flight Number | Locations | Flight Tracks | |
|---|---|---|---|---|
| Data Level | L1B | L2 | ||
| 2013-05-07 | 1394300 | Pacific Ocean (SNPP / AQUA) | 8 | 1 |
| 2013-05-10 | 1394400 | Gulf of California / Baja California (SNPP) | 13 | 9 |
| 2013-05-15 | 1394500 | Gulf of California / Baja California (SNPP / AQUA / Metop-A / Metop-B) | 17 | 14 |
| 2013-05-16 | 1394600 | Gulf of California / Baja California | 17 | 13 |
| 2013-05-18 | 1361900 | Texas (SNPP / AQUA) | 11 | 7 |
| 2013-05-20 | 1362000 | Oklahoma CART Site / Texas (SNPP / AQUA / Metop-A / Metop-B) | 19 | 11 |
| 2013-05-23 | 1362200 | Pacific Ocean (SNPP) | 8 | 4 |
| 2013-05-24 | 1362300 | Oklahoma CART Site (SNPP) | 13 | 4 |
| 2013-05-30 | 1362400 | Pacific Ocean (SNPP) (night) | 7 | 7 |
| 2013-05-31 | 1362500 | Pacific Ocean (SNPP / Metop-A) (night) | 8 | 6 |
| 2013-06-01 | 1362600 | Southern California / Gulf of California / Pacific Ocean (SNPP) (night) | 13 | 9 |
| Total | 134 | 85 | ||
Application and Derivation
The primary objective of MASTER is to: (a) collect ASTER-like and MODIS-like land datasets to support the validation of the ASTER and MODIS geophysical retrieval algorithms; (b) collect these datasets at a higher resolution than the spaceborne datasets to permit scaling studies and comparisons with in situ measurements; and (c) under fly the EOS-AM1 ASTER and MODIS sensors to provide an additional radiometric calibration to assist with in-flight instrument performance characterization. Calibration is particularly important for ASTER where on-board calibration is dependent on a single black body in the TIR and only partial aperture illumination in the VNIR.
A secondary objective of MASTER is to: (a) provide both a backup instrument and backup modules for the current MODIS Airborne simulator, which is committed to a program of atmospheric and oceanic measurements; and (b) provide a wider spectral and dynamic range alternative to the use of the Thematic Mapper (TM) airborne simulator and Thermal Infrared Multispectral Scanner (TIMS) airborne scanners (JPL, 2021b).
MASTER imagery has been used for mapping wildfires and their impacts (Veraverbeke et al., 2011), land cover (Li and Moon, 2004), coral reefs (Capolsini et al., 2003), and urban heat islands (Zhao and Wentz, 2016).
Quality Assessment
The MASTER instrument channels are calibrated spectrally and radiometrically in the laboratory preflight and postflight. The mid-infrared and thermal infrared channels (26–50) are also radiometrically calibrated in-flight by viewing an internal hot and cold blackbody with each scanline (Hook et al., 2001). Three calibration and validation experiments were conducted in 1998–2001 (Hook et al., 2001; JPL, 2021a). Spectral response information for this deployment is included in the files named MASTER_BBBBBBBB_YYYYMMDD_spectral_response_table.zip.
Data Acquisition, Materials, and Methods
The MASTER instrument was developed by the NASA Ames Research Center in conjunction with the Jet Propulsion Laboratory. The instrument consists of three key components: the scanning spectrometer, the digitizer, and the storage system. The scanning unit was built by Sensys Technology (formerly Daedalus Enterprises) and the digitizer was a collaborative effort between Berkeley Camera Engineering and the Ames Airborne Sensor Facility (ASF, 2021). The data storage system and overall system integration were also provided by the ASF.
The MASTER instrument is similar to the MODIS Airborne Simulator (MAS) developed by the MODIS project (King et al., 1996). However, it has two key differences. First, MASTER supports a variety of scan speeds allowing it to acquire contiguous imagery from a variety of altitudes with different pixel sizes. Second, the channel positions are configured to closely match those of ASTER and MODIS. A detailed description of the instrument and optical system are provided by Hook et al. (2001) and King et al. (1996), respectively.
For this deployment, the MASTER instrument was flown on NASA's ER-2 aircraft at altitudes of 18,307–20,204 m above sea level. The study area included portions of southwestern US, northwestern Mexico, and eastern Pacific Ocean (Fig. 2).
The L2 data are derived from the L1B files, and the primary L2 products are emissivity in five bands (wavelengths: 8.58, 9.02, 10.62, 11.32, and 12.13 µm) and land surface temperature (LST). Emissivity and LST were corrected using a Temperature and Emissivity Separation (TES) algorithm (Coll et al., 2001).
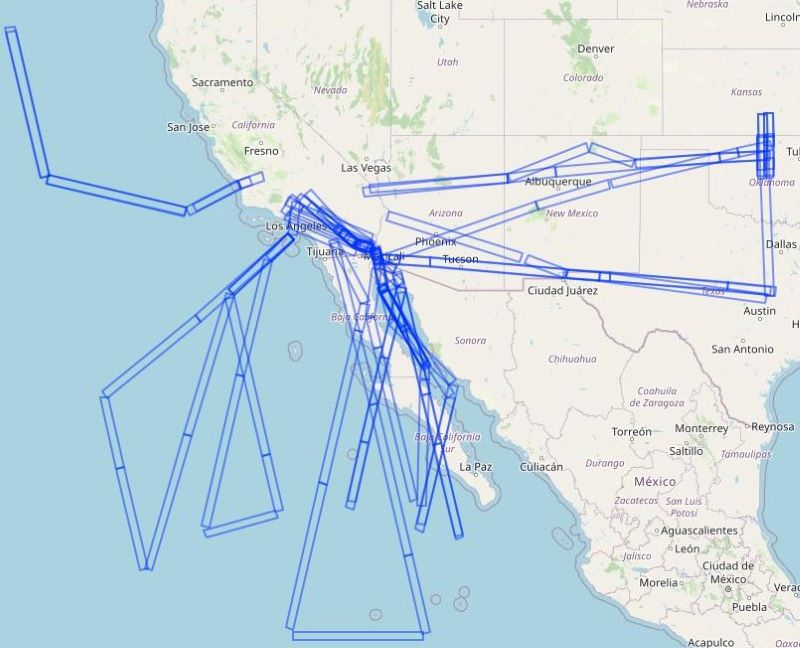
Figure 2. Flight tracks in this dataset represented as rectangular polygons. Basemap: © OpenStreetMap contributors.
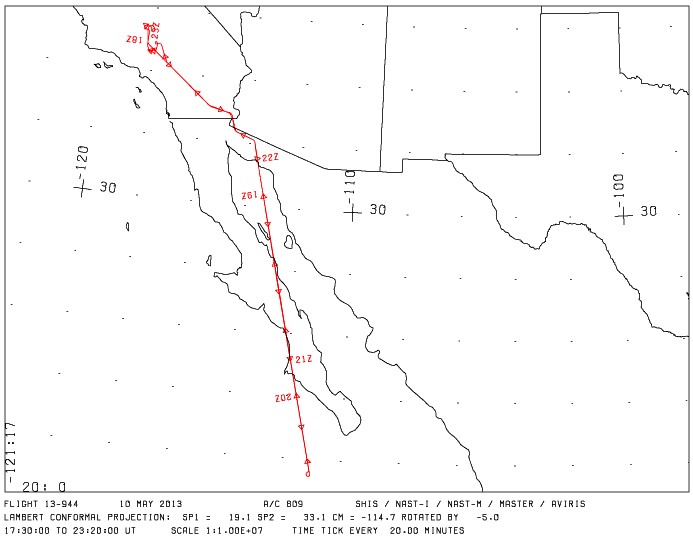
Figure 3. Flight path for Flight 1394400, flown on 10 May 2013. Flight 1394400 and 13 flight tracks occurred over southern California, Arizona, U.S., and Baha California, Mexico. Source: MASTER_1394400_20130510_flightpath.gif
Data Access
These data are available through the Oak Ridge National Laboratory (ORNL) Distributed Active Archive Center (DAAC).
MASTER: Suomi-NPP Airborne Campaign, 2013
Contact for Data Center Access Information:
- E-mail: uso@daac.ornl.gov
- Telephone: +1 (865) 241-3952
References
ASF. 2021. Campaign summary information: HyspIRI / WDTS Airborne Campaign. Airborne Sensor Facility, Airborne Science Program, NASA Ames Research Center, Moffett Field, California. https://asapdata.arc.nasa.gov/sensors/master/data/deploy_html/hyspiri_home.html
Capolsini, P., S. Andréfouët, C. Rion, and C. Payri. 2003. A comparison of Landsat ETM+, SPOT HRV, Ikonos, ASTER, and airborne MASTER data for coral reef habitat mapping in South Pacific islands. Canadian J. Remote Sensing 29:187-200. https://doi.org/10.5589/m02-088
Coll, C., V. Caselles, E. Rubio, F. Sospedra, and E. Valor. 2001. Temperature and emissivity separation from calibrated data of the Digital Airborne Imaging Spectrometer. Remote Sensing of Environment 76:250-259. https://doi.org/10.1016/S0034-4257(00)00207-8
Hook, S.J. Myers, J.J., Thome, K.J., Fitzgerald, M., and A. B. Kahle. 2001. The MODIS/ASTER airborne simulator (MASTER) - a new instrument for earth science studies. Remote Sensing of Environment 76:93-102. https://doi.org/10.1016/S0034-4257(00)00195-4
JPL. 2021a. Calibration and Validation, MASTER: MODIS/ASTER Airborne Simulator. Jet Propulsion Laboratory, California Institute of Technology, Pasadena, California, USA. https://masterprojects.jpl.nasa.gov/cal-val
JPL. 2021b. Science objectives, MASTER: MODIS/ASTER Airborne Simulator. Jet Propulsion Laboratory, California Institute of Technology, Pasadena, California, USA. https://masterprojects.jpl.nasa.gov/objectives
King, M.D., W.P. Menzel, P.S. Grant, J.S. Myers, G.T. Arnold, S.E. Platnick, L.E. Gumley, S.C. Tsay, C.C. Moeller, M. Fitzgerald, K.S. Brown, and F.G. Osterwisch. 1996. Airborne scanning spectrometer for remote sensing of cloud, aerosol, water vapor and surface properties. J. Atmospheric and Oceanic Technology 13:777-794. https://doi.org/10.1175/1520-0426(1996)013<0777:ASSFRS>2.0.CO;2
Li, P., and W.M. Moon. 2004. Land cover classification using MODIS-ASTER airborne simulator (MASTER) data and NDVI: A case study of the Kochang area, Korea. Canadian J. Remote Sensing 30:123-126. https://doi.org/10.5589/m03-061
Veraverbeke, S., S. Harris, and S. Hook. 2011. Evaluating spectral indices for burned area discrimination using MODIS/ASTER (MASTER) airborne simulator data. Remote Sensing of Environment 115:2702-2709. https://doi.org/10.1016/j.rse.2011.06.010
Zhao, Q., and E.A. Wentz. 2016. A MODIS/ASTER Airborne Simulator (MASTER) imagery for urban heat island research. Data 1:7. https://doi.org/10.3390/data1010007