Get Data
Summary
This data set provides a digital mosaic of the Amazon River floodplain in geoTIFF format that was compiled using Landsat TM images. This mosaic was planned in July 1995 as an activity of the EOS-IDS Project that was developed with cooperation among INPE, CENA, University of Washington in Seattle (UW), University of California in Santa Barbara (UCSB), and NASA. The mosaic is composed by 29 Landsat TM images covering a period from 1986 to 1995 that were selected with minimum cloud cover and within the July to September high water season of the Amazon River. These images were geometrically corrected using ground control points extracted from topographic charts and image charts at 1:250,000 scale. In addition, these images were radiometrically rectified to 231/062 (Manaus region) TM image using the method developed by Hall et al. (1991). The radiometric rectification applied had a good performance for bands 3, 5, and 7, for most of the scenes. For bands 1 and 2 the radiometric rectification was limited, especially for scenes with intense haze. Nevertheless, the overall performance of radiometric normalization allowed the production of a uniform data set for the entire Brazilian Amazon River mainstem floodplain. The mosaic was then built using the best bands (rectified or non-rectified) of the TM images with 90 meter spatial resolution.
The mosaic data are provided in geoTIFF-formatted files, rectified and geocoded, for six TM bands (1 to 5 and 7) with a 90- meter spatial resolution. The mosaic is divided in two parts:
- Part 1, from the mouth of the Amazon river in Brazil to the Brazil/Peru boundary and
- Part 2, from the Brazil/Peru boundary to its spring.
There is also a 500- meter resolution mosaic covering all the Amazon River (from spring to the mouth) with geoTIFF-formatted data files for TM bands 3, 4, and 5.
For additional information contact Dr.Evlyn M. Novo, evlyn@dsr.inpe.br, or Adriana Affonso, affonso@dsr.inpe.br.
The total length of the Amazon River from its source springs in the Peruvian Andes (taking the Ucayali River as the continuation of the main river into the Andes), is estimated at 6518 km (not including all river bends, and measured the short distance around Marajo Island in the mouth of the Amazon), or ~4075 miles in length. The headwaters are located high in the Andes at an elevation of about 5,200 meters (17,000 feet), and only 190 kilometers (120 miles) from the Pacific Ocean.
Figure 1. Digital Mosaic of the Amazon River floodplain produced using Landsat TM images.
Pre-LBA Data Set Collection Initiative
The Pre-LBA data set collection was dedicated to providing information to the LBA research community about existing data that have been collected in Amazonia during the 20 years prior to 1998. The main goal of this activity was to compile and document existing data sets in a consistent manner and make them available prior to the beginning of the LBA experiment.
The data sets compiled include satellite imagery, micrometeorological observations, near surface and upper-air atmospheric conditions, surface biophysical and hydrological measurements obtained from 1970s - 1990s in a number of field experiments. Data were collected for several intensive field campaigns, during the rainy and dry seasons, and other periods that vary from short intensive field campaigns to several years worth of observations, measured sometimes with a time resolution of 5 minutes to 1 hour.
Citation:
Cite this data set as follows:
Shimabukuro, Y.E. and E.M. Novo. 2008. Pre-LBA FLOODAMA Project Data. Data set. Available on-line [http://daac.ornl.gov] from Oak Ridge National Laboratory Distributed Active Archive Center, Oak Ridge, Tennessee, U.S.A. doi:10.3334/ORNLDAAC/903.
The original CD-ROM citation is as follows:
Marengo, J.A., and R.L. Victoria. 1998. Pre-LBA Data Sets Initiative, 3 vols. [Pre-Large-Scale Biosphere-Atmosphere Experiment in Amazonia Data Sets Initiative, 3 vols.]. CD-ROM. Centro de Previsao de Tempo e Estudios Climaticos, Instituto Nacional de Pesquisas Espaciais (CPTEC/INPE) [Center for Weather Forecasting and Climate Study, National Institute for Space Research], Sao Paulo, Brazil.
| Pre-LBA Data Set Collection
Metadata Campaign: FLOODAMA Amazon Floodplains Keywords DIGITAL MOSAIC LANDSAT TM FLOODAMA Investigators Last_name: Mertes First_name: Leal Middle_name: A. K. Email: lcal@geog.ucsb.edu Address: Department of Geography University of California City: Santa Barbara State_or_Province: CA 93106-4060 Country: USA Last_name: Hess First_name: Laura Middle_name: Loraine Email: lola@icess.ucsb.edu Address: ICESSS University of California City: Santa Barbara State_or_Province: CA 93106-4060 Country: USA Last_name: Msc First_name: Maycira Middle_name: Costa Email: Maycira.Costa@CCRS.NRCan.gc.ca Address: University of Carlington City: Ottawa State_or_Province: Ontario Country: Canada Last_name: Shimabukuro First_name: Yosio Middle_name: Edemir Email: yosio@ltid.inpe.br Phone: 55 12 345 6483 FAX: 55 12 345 6488 Address: Laboratorio de Tratamento de Imagens Instituto Nacional de Pesquisas Espaciais Av dos Astronautas, 1758 City: Sao Jose dos Campos State_or_Province: 12201-970 Sao Paulo Country: Brazil Last_name: Novo First_name: Evlyn Marcia Leao de Middle_name: Moraes Email: evlyn@ltid.inpe.br Phone: 55 12 345 6433 FAX: 55 12 345 6488 Address: Laboratorio de Tratamento de Imagens Instituto Nacional de Pesquisas Espaciais Av. dos Astronautas, 1758 City: Sao Jose dos Campos State_or_Province: 12201-970 Sao Paulo Country: Brazil |
Technical_Contact Last_name: Shimabukuro First_name: Yosio Middle_name: Edemir Email: yosio@ltid.inpe.br Phone: 55 12 345 6483 FAX: 55 12 345 6488 Address: Laboratorio de Tratamento de Imagens Instituto Nacional de Pesquisas Espaciais Av. dos Astronautas, 1758 City: Sao Jose dos Campos State_or_Province: 12201-970 Sao Paulo Country: Brazil Coverage Southernmost_latitude: -18.202213 Northernmost_latitude: 1.291141 Westernmost_longitude: -78.192763 Easternmost_longitude: -46.283957 Location: SOUTH AMERICA Author Last_name: Novo First_name: Evlyn Marcia Leao de Middle_name: Moraes Email: evlyn@ltid.inpe.br Phone: 55 12 345 6433 FAX: 55 12 345 6488 Address: Laboratorio de Tratamento de Imagens Instituto Nacional de Pesquisas Espaciais Av. dos Astronautas, 1758 City: Sao Jose dos Campos State_or_Province: 12201-970 Sao Paulo Country: Brazil Data_Center Data_Center_Name: "INPE,CENA,UW,UCSB,NASA UW - Univ. of Washington (Seattle), UCSB - Univ. of California (Santa Barbara)" Dataset_ID: FLOODAMA Data_Center_Contact Last_name: Novo First_name: Evlyn Marcia Leao de Middle_name: Moraes Email: evlyn@ltid.inpe.br Phone: 55 12 345 6433 FAX: 55 12 345 6488 Address: Laboratorio de Tratamento de Imagens Instituto Nacional de Pesquisas Espaciais Av. dos Astronautas, 1758 City: Sao Jose dos Campos State_or_Province: 12201-970 Sao Paulo Country: Brazil Science_Review_Date: 1998-01-05 Constraints Data may not be used for commercial applications. |
Data Description
These images were geometrically corrected using ground control points extracted from topographic charts and image charts in the 1:250,000 scale. In addition, these images were radiometrically rectified to 231/062 (Manaus region) TM image using the method developed by Hall et al. (1991). The radiometric rectification applied had a good performance for bands 3, 5, and 7, for most of the scenes. For bands 1 and 2 the radiometric rectification was limited, especially for scenes with intense haze.
All of the images are geoTIFF, composed of a .tif and a .twf file, and compressed (*.zip) for downloading convenience. They are rectified and geocoded.
Projection: Polyconic
Datum: Clarke 1866
Date Range of TM Images: 1986-08-04 to 1995-09-19
Spatial Coverage: (for Parts 1 and 2)
Southernmost_latitude: -18.202213
Northernmost_latitude: 1.291141
Westernmost_longitude: -78.192763
Easternmost_longitude: -46.283957
These files comprise the 90- meter resolution of bands 1, 2, 3, 4, 5, and 7 for TM Mosaics of the Amazon River. Each geoTIFF image is composed of a .tif and a .twf file and has been compressed (*.zip) for downloading convenience.
Part 1: From the mouth of the Amazon river in Brazil to the Brazil/Peru boundary, each image is comprised of 30616 columns and 8698 rows.
Parte_1_B1.zip
Parte_1_B2.zip
Parte_1_B3.zip
Parte_1_B4.zip
Parte_1_B5.zip
Parte_1_B7.zip
Part 2: From the Brazil/Peru boundary to its spring, each image is comprised of 11001 columns and 19955 rows.
Parte_2_B1.zip
Parte_2_B2.zip
Parte_2_B3.zip
Parte_2_B4.zip
Parte_2_B5.zip
Parte_2_B7.zip
These three files comprise the 500- meter resolution mosaic covering all the Amazon river (from spring to the mouth) for TM bands 3, 4, and 5. Each image is comprised of 6779 columns and 4312 rows. Each geoTIFF image is composed of a .tif and a .twf file and has been compressed (*.zip) for downloading convenience.
500_meter_mosaic_345:
Mosaic_B3.zip
Mosaic_B4.zip
Mosaic_B5.zip
Landsat TM Sensor Bands
The TM sensor is an advanced Earth resources multispectral scanning instrument. The TM data are scanned simultaneously in seven spectral bands. Band 6 scans thermal (heat) infrared radiation. Spectral range of the bands and spatial resolution for the TM sensor are:
Landsats 4-5 Wavelength Resolution**
(micrometers) (meters)
Band
1
0.45 - 0.52
30
Band 2
0.52 - 0.60
30
Band 3
0.63 - 0.69
30
Band 4
0.76 - 0.90
30
Band 5
1.55 - 1.75
30
Band 6
10.40 - 12.50 120
Band 7
2.08 - 2.35
30
** These are the nominal Landsat TM sensor resolutions. The data provided here are at 90-m and 500- m resolutions as specified.
Data Visualization
The Landsat TM mosaic has been overlain on an SRTM (Shuttle Radar Topography Mission) water bodies layer (from ESRI® Data and Maps, ESRI). The Landsat images of the Amazon river features consistently align with the SRTM water features in most regions. However, certain regions (in the west end of the river) do not overlap exactly. There may be shifts of up to 2 km. Figure 1 shows an example of the shift. Figure 2 shows an example of the non-shifted regions. The shifts may be due to the mosaicing of a large area which makes accurate georeferencing difficult. These maps show Band 4 of the part 1 data set.
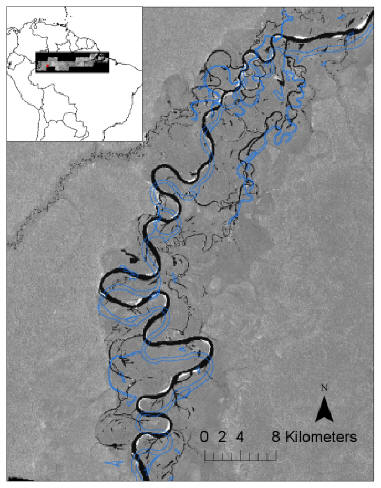
Figure 1. Example of the shift observed in western region. Above area lies within Image 002-62 of table below. |
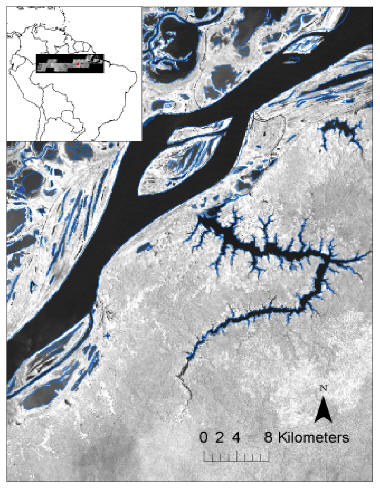
Figure 2. Example of the non-shifted regions. Above area lies within Image 228-62 of table below. |
Originating Data Center Quality Evaluation
Mean performance of the geometrical correction model for each of the scenes that form part of the mosaic.
| Image | Date(dd/mm/yy) | Mean error in x (pixel) | Mean error in y (pixel) |
|---|---|---|---|
| 001-61 | 24/08/95 | 1.33 | 1.74 |
| 001-62 | 02/10/92 | 1.60 | 1.51 |
| 002-61 | 21/05/95 | 1.98 | 1.95 |
| 002-62 | 07/10/91 | 1.57 | 1.76 |
| 003-62 | 11/08/91 | 1.48 | 1.59 |
| 003-63 | 02/08/88 | 1.38 | 1.70 |
| 004-62 | 04/08/86 | 1.84 | 1.00 |
| 004-63 | 13/09/89 | 1.77 | 1.71 |
| 223-61 | 24/06/87 | 1.48 | 1.77 |
| 224-60 | 14/08/88 | 7.31 | 7.26 |
| 224-61 | 19/09/95 | 1.06 | 1.00 |
| 225-60 | 02/07/87 | 0.34 | 0.37 |
| 225-61 | 15/07/86 | 1.06 | 1.20 |
| 226-60 | 11/07/88 | 1.76 | 1.85 |
| 226-61 | 04/08/85 | 0.62 | 0.64 |
| 226-62 | 20/07/91 | 1.77 | 1.67 |
| 227-61 | 22/08/89 | 0.52 | 0.73 |
| 227-62 | 03/08/88 | 0.91 | 0.80 |
| 228-61 | 06/09/92 | 0.94 | 0.64 |
| 228-62 | 18/06/92 | 0.86 | 0.99 |
| 229-61 | 21/09/89 | 1.67 | 1.65 |
| 229-62 | 10/08/91 | 1.06 | 0.66 |
| 230-62 | 02/07/92 | 0.94 | 0.71 |
| 231-62 | 02/08/89 | 1.56 | 1.65 |
| 231-63 | 25/07/92 | 1.45 | 1.71 |
| 232-62 | 28/08/92 | 1.52 | 1.43 |
| 232-63 | 01/08/92 | 1.62 | 1.70 |
| 233-62 | 24/08/92 | 1.79 | 1.85 |
| 233-63 | 25/09/92 | 1.75 | 1.77 |
To better understand the effects of the rectification on the original data the table below shows the results of the image analyses.
| Image | Date (dd/mm/yy) |
Skill of the rectification | ||
|---|---|---|---|---|
| TM1TM2TM3 | TM3TM4TM5 | TM4TM5TM7 | ||
| 001-61 | 24/08/95 | better | better | worse |
| 001-62 | 02/10/92 | better | worse | worse |
| 002-61 | 021/05/95 | worse | worse | worse |
| 002-62 | 07/10/91 | better | better | better |
| 003-62 | 11/08/91 | better | better | worse |
| 003-63 | 02/08/88 | better | worse | worse |
| 004-62 | 04/08/86 | worse | better | worse |
| 004-63 | 13/09/89 | better | better | worse |
| 223-61 | 24/06/87 | worse | better | better |
| 224-60 | 14/08/88 | - | - | - |
| 224-61 | 19/09/95 | - | - | - |
| 225-60 | 02/07/87 | - | - | - |
| 225-61 | 15/07/86 | better | worse | worse |
| 226-60 | 11/07/88 | - | - | - |
| 226-61 | 04/08/85 | - | - | - |
| 226-62 | 20/07/91 | - | - | - |
| 227-61 | 22/08/89 | - | - | - |
| 227-62 | 03/08/88 | - | - | - |
| 228-61 | 06/09/92 | better | better | worse |
| 228-62 | 18/06/92 | worse | better | worse |
| 229-61 | 21/09/89 | better | better | worse |
| 229-62 | 10/08/91 | better | better | worse |
| 230-62 | 02/07/92 | worse | better | worse |
| 231-62 | 02/08/89 | reference | reference | reference |
| 231-63 | 25/07/92 | worse | better | worse |
| 232-62 | 28/08/92 | - | - | - |
| 232-63 | 01/08/92 | - | - | - |
| 233-62 | 24/08/92 | better | better | worse |
| 233-63 | 25/09/92 | better | worse | worse |