Revision date: August 24, 2015
Summary:
This data set provides ~100-m resolution image mosaics of South America acquired during the low flood season between September and December 1995 and during the high flood season between May and July of 1996. The images cover the same areas during both seasons and were obtained from the Japanese Earth Resources Satellite 1 (JERS-1) Synthetic Aperture Radar (SAR) of the National Space Development Agency of Japan (NASDA). The data were mosaicked into 34 tiles for each season, each consisting of about 50 JERS-1 scenes. This data set constitutes the first-ever high-resolution and single season coverage of the entire Amazon River Basin, made possible by the cloud penetrating properties of the radar sensor. The images are from the original JERS-1 SAR Global Rain Forest Mapping Project.
This data set contains 66 files in GeoTIFF (.tif) format. There are 32 files for the low flood season and 34 files for the high flood season.
There are also 136 companion files in GIF (.gif) format which includes: 66 textured mosaics for the same corresponding areas as the GeoTIFFS at 500-m resolution, and an image of slope and an image of topography for each of the 34 tiles derived from the GTOPO30 Global 30 Arc Second Elevation data set (not provided with this data set). In addition, there is one file in .pdf format which provides additional information regarding the textured images, the derivation of the slope, and topography.
NOTE: These data were originally distributed on four CD-ROMs.The images provided as data files were converted to GeoTIFF format (.tif) and renamed. In addition, there are 136 additional graphical images that were on the CD-ROMs being provided in the original .gif format as companion files. The documentation has been revised to reflect the changes.

(High flood
mosaic)

(Low flood mosaic)
Figure 1. High and low flood mosaics of the Amazon River Basin. The mosaics are gray scale images in which the brightness of the image corresponds to the amount of radar energy reflected back to the radar. The flooded forested areas appear brighter and the rivers appear darker (Images are courtesy of GRFM, © NASDA/MITI).
Data Citation:
Cite this data set as follows:
Chapman, B., A. Rosenqvist, and A. Wong. 2015. JERS-1 Synthetic Aperture Radar, 100-m Mosaics, South America: 1995-1996, R1. Data set. Available on-line [http://daac.ornl.gov] from Oak Ridge National Laboratory Distributed Active Archive Center, Oak Ridge, Tennessee, USA. http://dx.doi.org/10.3334/ORNLDAAC/1280.
This data set was originally published as:
Chapman, B., A. Rosenqvist, and A. Wong. 2001. JERS-1 SAR Global Rain Forest Mapping Project: Vol. AM-1, South America. Data set. Available on-line [http://www.daac.ornl.gov] from Oak Ridge National Laboratory Distributed Active Archive Center, Oak Ridge, Tennessee, U.S.A. doi:10.3334/ORNLDAAC/582.
Acknowledgements:
The original CD-ROM data product and related information was written, designed, and produced by Bruce Chapman, Jet Propulsion Laboratory; Ake Rosenqvist, National Space Development Agency of Japan (NASDA); and Al Wong, Jet Propulsion Laboratory; and is based upon previous cdroms produced for the GRFM project. We thank the many people involved in the data processing, in particular: Greg McGarragh, Paul Siqueira, John Holt, Marcos Alves, Masanobu Shimada, Dave Curkendall, and Laura Hess. A portion of this work was carried out by the Jet Propulsion Laboratory (JPL), California Institute of Technology, under a contract with the National Aeronautics and Space Administration (NASA).
Related Data Sets:
- LBA-ECO LC-07 Validation Overflight for Amazon Mosaics, Raster, 1999
- LBA-ECO LC-07 Validation Overflight for Amazon Mosaics, video, 1999
- LBA-ECO LC-07 Monthly Mean Flooded Wetlands Habitat, Central Amazon Basin: 1979-1996
- LBA-ECO LC-07 JERS-1 SAR Wetlands Masks and Land Cover, Amazon Basin: 1995-1996
- LBA-ECO LC-15 JERS-1 Synthetic Aperture Radar, 1- km Mosaic, Amazon Basin: 1995-1996
Table of Contents:
- 1 Data Set Overview
- 2 Data Description
- 3 Applications and Derivation
- 4 Quality Assessment
- 5 Acquisition Materials and Methods
- 6 Data Access
- 7 References
Project: LBA (Large-Scale Biosphere-Atmosphere Experiment in the Amazon)
Activity: LBA-ECO
LBA Data Set Inventory ID: Jers-1_SAR_GRFM_Amazon_Mosaics
This data set provides ~100-m resolution image mosaics of South America acquired during the low flood season between September and December 1995 and during the high flood season between May and July of 1996. The images cover the same areas during both seasons and were obtained from the Japanese Earth Resources Satellite 1 (JERS-1) Synthetic Aperture Radar (SAR) of the National Space Development Agency of Japan (NASDA). The data were mosaicked into 34 tiles for each season, each consisting of about 50 JERS-1 scenes. This data set constitutes the first-ever high-resolution and single season coverage of the entire Amazon River Basin, made possible by the cloud penetrating properties of the radar sensor. The images are from the original JERS-1 SAR Global Rain Forest Mapping Project.
2. Data Characteristics:
There are 66 files in GeoTIFF (.tif) format with this data set. They are images of the original JERS-1 SAR Global Rain Forest Mapping Project, South American (Amazon Basin), dual season SAR image mosaics. The mosaics are gray scale images in which the brightness of the image corresponds to the amount of radar energy reflected back to the radar.
The data were acquired between September and December 1995 (low flood season for the river) and between May and July of 1996 (high flood season for the river) and were mosaicked into 34 tiles. For this project, the study areas were referred to by sections and the tiles were located in one of four sections referred to as A, B, C, and D (see section 5 of this document) and numbered.
The data files are also named with the same tile numbers. The images for both seasons are for the same areas. The files numbered 101-133 denote the low flood season of September-December 1995; files numbered 301-334 denote the high flood season of May-July 1996.
Example file names: MOSAIC_112.tif. and MOSAIC_312.tif. These are mosaics of the same area (area A, see the table below) for both seasons, from the area located in tile number 112.
Table 1. Tile and file name numbers and corresponding tile areas
| File number (also corresponds to the tile numbers) | Tile location area |
|---|---|
| Files 101-133 are for the low flood season-September-December 1995 | |
| 101 | D |
| 102-103 | C |
| 104-107 | D |
| 108 | A |
| 109-110 | C |
| 111-115 | A |
| 116 | C |
| 117-118 | A |
| 119-121 | B |
| 122-124 | C |
| 125-127 | B |
| 128 | C |
| 129-130 | B |
| Note-there is no file numbered 131 | NA |
| 132-133 | D |
| Files 301-334 are for the high-flood season- May-July 1996 | |
| 301 | D |
| 302-303 | C |
| 304-307 | D |
| 308 | A |
| 309-310 | C |
| 311-315 | A |
| 316 | C |
| 317-318 | A |
| 319-321 | B |
| 322-324 | C |
| 325-327 | B |
| 328 | C |
| 329-330 | B |
| 331-334 | D |
Spatial Data Properties of the GeoTIFF files
Spatial Representation Type: Raster
Pixel Depth: 8 bit
Pixel Type: byte
Compression Type: LZW
Number of Bands: 1
Raster Format: TIFF
Source Type: generic
No Data Value: 0
Scale Factor: 1
Column Resolution: 3 arc seconds (~300 feet)
Row Resolution: 3 arc seconds (~300 feet)
Spatial Reference Properties
Type: Geographic
Geographic Coordinate Reference: WGS 1984
Open Geospatial Consortium (OGC) Well Known Text (WKT)
GEOGCS["WGS 84",
DATUM["WGS_1984",
SPHEROID["WGS 84",6378137,298.257223563,
AUTHORITY["EPSG","7030"]],
AUTHORITY["EPSG","6326"]],
PRIMEM["Greenwich",0],
UNIT["degree",0.0174532925199433],
AUTHORITY["EPSG","4326"]]
Companion files
There are 136 companion files described below:
| File name | Description |
|---|---|
| MOSAIC_XXX_texture.gif | 66 textured mosaic images in .gif format which correspond to the 66 .tif files in Table 1. "XXX" refers to the file number. Example file name: MOSAIC_112_texture.gif. For additional information, refer to the companion file JERS_COMPANION_FILES.pdf. |
| MOSAIC_XXX_slope.gif | Slope images in .gif format for the areas in each of the 34 tiles. The slopes were derived from the GTOPO30 Global 30 Arc Second Elevation data set. These files are named with the corresponding tile numbers XXX. Refer to Table 1 above. Example file name: MOSAIC_112_slope.gif. For additional information, refer to the companion file JERS_COMPANION_FILES.pdf. |
| MOSAIC_XXX_topography.gif | Topography images in .gif format for the areas in each of the 34 tiles derived from the GTOPO30 Global 30 Arc Second Elevation data set. These files are named with the corresponding tile numbers XXX. Refer to Table 1 above. Example file name: MOSAIC_112_topography.gif. For additional information, refer to the companion file JERS_COMPANION_FILES.pdf. |
| JERS_COMPANION_FILES.pdf | Information regarding the textured .gif files, derivation of the slopes, and topography from the GTOP030 data set. |
| JERS-1_SAR_GRFM_Amazon_Mosaics.pdf | A pdf of this data set guide document |
Site boundaries: (All latitude and longitude given in decimal degrees)
| Site (Region) | Westernmost Longitude | Easternmost Longitude | Northernmost Latitude | Southernmost Latitude | Datum |
|---|---|---|---|---|---|
| Amazon River Basin, Brazil | -82.0004 | -48.0004 | 13.0002 | -19.9996 | WGS-84 |
Time period: The data were acquired between September and December 1995 (low flood season) and between May and July of 1996 (high flood season) .
Platform/Sensor/Parameters measured include:
- JERS-1 (JAPANESE EARTH RESOURCES SATELLITE-1) / SAR (SYNTHETIC APERTURE RADAR) / LAND COVER
- JERS-1 (JAPANESE EARTH RESOURCES SATELLITE-1) / SAR (SYNTHETIC APERTURE RADAR) / WETLANDS
3. Data Application and Derivation:
This data set has been used in other LBA-ECO data products. The image below is from a related LBA data set which used this SAR mosaicked data product.
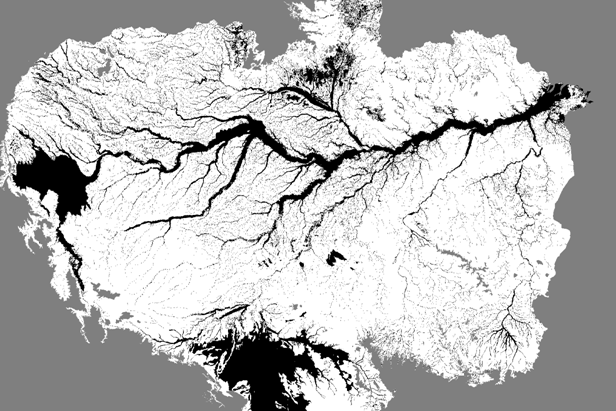
Figure 2. Floodable area (black) for Amazon basin below 500-m contour derived from JERS-1 SAR mosaic (Hess et al., 2012).
4. Quality Assessment:
Every attempt was made to make a well calibrated mosaic image product. However, some residual calibration errors still remain in the backscatter mosaic. For instance, in the high flood mosaic, the imagery is too dark on the Peruvian coastline. The high flood texture mosaic also has some calibration errors.
Preliminary analysis of the geographic fidelity of the data showed that the error in absolute geolocation can be as large as 400 meters. However, the relative errors within any one mosaic tile were less than a few pixels of the binary data. For additional information, refer to Siqueira et al., 2000.
5. Data Acquisition Materials and Methods:
Research areas
The main objective of this data set was to delineate the extent of flooding that occurred between the two acquisitions (one at approximate high flood stage of the Amazon River main stem, and one at the approximate low flood stage). For this project, the study area was referred to by sections (A, B, C, and D). The SAR data were mosaicked into 34 tiles and the tiles were located in the four sections and numbered.
The four study areas (very light green areas) and tiles (medium green squares within the light green areas) are indicated in the figures below. The tile numbers were not provided with the images below. However, refer to Table 1 for a listing of the tile numbers and corresponding areas.
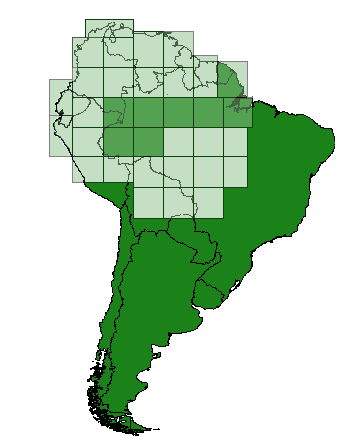
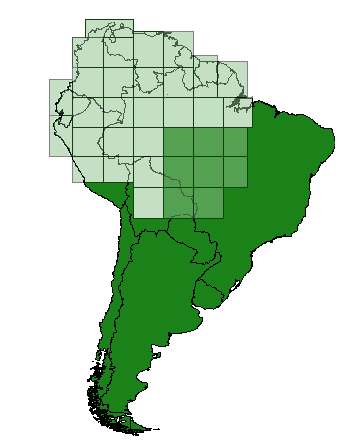
Area A tiles are in the left image and area B tiles are indicated in the right image.

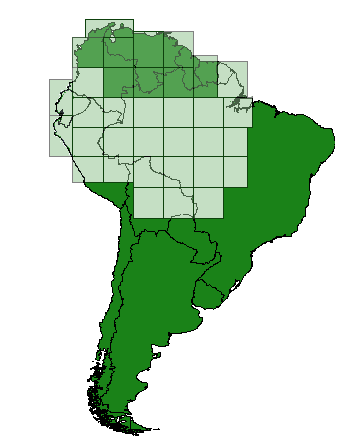
Area C tiles are in the left image and area D tiles are indicated in the right image.
Generation of mosaics
SAR imagery were acquired by the Japanese Earth Resources Satellite-1 (Rosenqvist et al., 2000). The data, acquired between September and December 1995 (low flood season for the river) and between May and July of 1996, were mosaicked into tiles, each consisting of about 50 JERS-1 scenes.
Image mosaicking was performed by means of block adjustment. Relative scene displacements, calculated by image correlation in the overlapping areas between scenes (both in azimuth and range directions), were used as observations in the adjustment procedure. Ground control points for absolute geolocation, derived from e.g. existing maps (with varying quality) and the World Vector Shoreline data set, were added as additional observations with higher weight. As a first step, only the transformation parameters were calculated, and the result was scanned for gross errors or other outliers which needed to be corrected before the actual mosaic was assembled. The steps of parameter calculation and geometric verification were repeated until acceptable geometric accuracy was achieved. In order to assure relative co-registration between mosaics acquired at different seasons, block adjustment was performed for all scenes covering the region simultaneously (Rosenqvist et al., 2000).
Least squares block adjustment was applied to data from one season only and the second coverage was rectified scene-by-scene to the first ‘master’ mosaic. The characteristics of the JPL output were 100-m nominal ground resolution, amplitude and texture mosaics on a latitude/longitude grid. Due to the large sizes of the 100-m data files the 100-m canvases were divided into smaller regional mosaics, or tiles, (typically corresponding to 5 degrees by 5 degrees).
When viewing the imagery, the rivers will appear relatively dark, while the flooded forest areas will appear bright. The flooded forests appear bright due to the radar L-band microwaves reflecting off both the underlying water and the tree trunks (ie. double bounce reflections). The rivers are dark because SAR is a side-looking instrument - when imaging water most of the radiation is reflected away from the radar. The forest is of middle brightness mostly due do the volume scattering of the microwave radiation by the forest canopy. The bright signal associated with the flooded forest is not due to an increase in moisture, but to the double bounce scattering mechanism. It requires that the forest be currently flooded. Urban areas and areas of low vegetation also may be discerned in the imagery. Urban areas tend to be bright (also due to double bounce reflections), while areas of low vegetation tend to be between the brightness levels of undisturbed mature tropical forests and water. More subtle differences in vegetation in certain areas may also be observed. In the presence of topography, the radar backscatter will vary according to the slope. Areas on the side facing toward the East (the approximate direction to the sensor) will appear brighter, and toward the West, darker. Care should be taken to not necessarily confuse this effect with ecological differences. In the savanna areas, more subtle interpretation of the imagery may be required.
6. Data Access:
These data are available through the Oak Ridge National Laboratory (ORNL) Distributed Active Archive Center (DAAC).
Data Archive Center:
Contact for Data Center Access Information:
E-mail: uso@daac.ornl.gov
Telephone: +1 (865) 241-3952
7. References
Hess, L.L., J.M. Melack, E.M.L.M. Novo, C.C.F. Barbosa, and M. Gastil. 2012. LBA-ECO LC-07 JERS-1 SAR Wetlands Masks and Land Cover, Amazon Basin: 1995-1996. Data set. Available on-line [http://daac.ornl.gov] from Oak Ridge National Laboratory Distributed Active Archive Center, Oak Ridge, Tennessee, U.S.A. http://dx.doi.org/10.3334/ORNLDAAC/1079
Rosenqvist, A., Shimada, M., Chapman, B., and Freeman, A. 2000. The Global Rain Forest Mapping project -- a review. International Journal of Remote Sensing, 21, 1375-1387.
Siqueira, P., Hensley, S., Shaffer, S., Hess, L., McGarragh, G., Chapman, B., and Freeman, A., "A continental-scale mosaic of the Amazon basin using JERS-1 SAR imagery", 2000, IEEE Geosc. Rem. Sensing, vol. 38, No. 6, November 2000, pp 2638-2644.