Documentation Revision Date: 2021-09-23
Dataset Version: 2
Summary
This dataset includes and expands upon Version 1 of this compilation (Saleska et al., 2013). Version 2 contains the flux tower data and additional calculations of ecosystem respiration, gross ecosystem productivity, and canopy storage as published in Restrepo-Coupe et al., 2013.
There are 36 data files in tab-delimited (*.txt) format included in this dataset along with CD32_Fluxes_Brazil-Readme.pdf as a companion file. For each of the nine towers, there are four files where data have been aggregated to hourly, daily, 16-day, and monthly time steps.
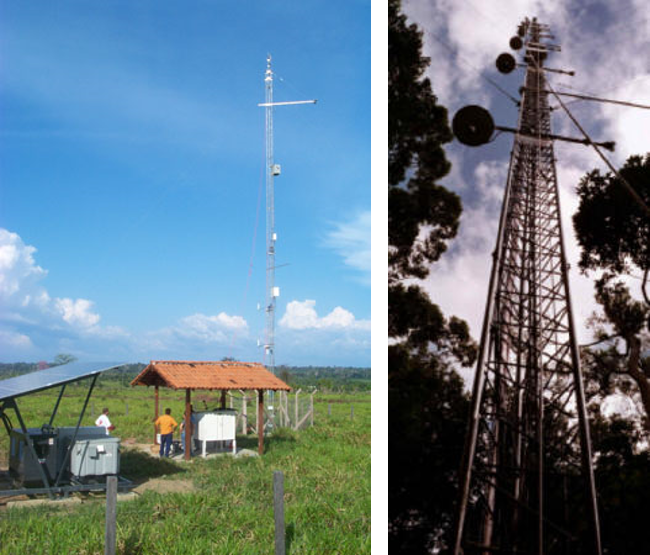
Figure 1. Santarem km 77 eddy flux and micrometeorological measurement pasture site (Fitzjarrold and Sakai, 2010) and the Para Western (Santaram) - km 67, Primary Forest Tower. Source: Hutyra et al., 2008
Citation
Restrepo-Coupe, N., H.R. da Rocha, L.R. Hutyra, A.C. de Araujo, L.S. Borma, B. Christoffersen, O. Cabral, P.B. de Camargo, F.L. Cardoso, A.C.L. Costa, D.R. Fitzjarrald, M.L. Goulden, B. Kruijt, J.M.F. Maia, Y.S. Malhi, A.O. Manzi, S.D. Miller, A.D. Nobre, C. von Randow, L.D. Abreu Safaj, R.K. Sakai, J. Tota, S.C. Wofsy, F.B. Zanchi, and S.R. Saleska. 2021. LBA-ECO CD-32 Flux Tower Network Data Compilation, Brazilian Amazon: 1999-2006, V2. ORNL DAAC, Oak Ridge, Tennessee, USA. https://doi.org/10.3334/ORNLDAAC/1842
Table of Contents
- Dataset Overview
- Data Characteristics
- Application and Derivation
- Quality Assessment
- Data Acquisition, Materials, and Methods
- Data Access
- References
- Dataset Revisions
Dataset Overview
Project: LBA (Large-Scale Biosphere-Atmosphere Experiment in the Amazon)
Activity: LBA-ECO
LBA Science Component: Carbon Dynamics
Team ID: CD-32 (Saleska / da Rocha / Artaxo / Nobre / Shimabukuro)
The investigators were Saleska, Scott R.; Rocha, Humberto Ribeiro da; Artaxo, Paulo Eduardo; Huete, Alfredo R.; Nobre, Antonio Donato; Parker, Geoffrey; Ratana, Piyachat; Restrepo-Coupe, Natalia; Shimabukuro, Monica Takako; Shimabukuro, Yosio Edemir and Tannus, Rafael Nora. You may contact Saleska, Scott R. (saleska@email.arizona.edu) and Restrepo-Coupe, Natalia (ncoupe@email.arizona.edu).
LBA Data Set Inventory ID: CD32_Brazil_Flux_Network
This dataset is a compilation of carbon and energy eddy covariance flux, meteorology, radiation, canopy temperature, humidity, and CO2 profiles, and soil moisture and temperature profile data that were collected at nine towers across the Brazilian Amazon. Independent investigators provided the data from a variety of flux tower projects over the period 1999 thru 2006. The data have been harmonized across projects, additional quality control checks performed and aggregated to several time intervals. This dataset includes and expands upon Version 1 of this compilation (Saleska et al., 2013). Version 2 contains the flux tower data and additional calculations of ecosystem respiration, gross ecosystem productivity, and canopy storage as published in Restrepo-Coupe et al., 2013. This integrated dataset is intended to facilitate integrative studies and data-model synthesis from a common reference point.
Related Publication
Restrepo-Coupe, N., Rocha, H.R. da, Christoffersen, B., Araujo, A.C. da, Borma, L.S., Cabral, O.M.R., Camargo, P.B. de, Cardoso, F.L., Costa, A.C.L. da, Fitzjarrald, D.R., Goulden, M.L., Hutyra, L.R., Kruijt, B., Maia, J.M.F., Malhi, Y.S., Manzi, A.O., Miller, S.D., Nobre, A.D., Randow, C. von, Sá, L.D. da A., Sakai, R.K., Tota, J., Wofsy, S.C., Zanchi, F.B., Saleska, S.R. 2013. What drives the seasonality of productivity across the Amazon basin? A cross-site analysis of eddy flux tower measurements from the Brasil flux network. Agricultural and Forest Meteorology. https://doi.org/10.1016/j.agrformet.2013.04.031
Related Datasets
Saleska, S.R., H.R. da Rocha, A.R. Huete, A.D. Nobre, P.E. Artaxo, and Y.E. Shimabukuro. 2013. LBA-ECO CD-32 Flux Tower Network Data Compilation, Brazilian Amazon: 1999-2006. ORNL DAAC, Oak Ridge, Tennessee, USA. https://doi.org/10.3334/ORNLDAAC/1174
- This dataset is Version 1 and is superseded by the current Version 2 dataset. Version 1 was the source of the original and quality assured time-series data used as the basis for Version 2.
Data from LBA flux tower sites for similar time periods:
- LBA-ECO CD-10 CO2 & H2O Eddy Flux Data at km 67 Tower Site, Tapajos National Forest (data for the period 2002/01/01 to 2006/01/18 )
- LBA-ECO CD-10 H2O Profiles at km 67 Tower Site, Tapajos National Forest (data for the period 2002/01/01 to 2006/01/18 )
- LBA-ECO CD-10 CO2 Profiles at km 67 Tower Site, Tapajos National Forest (data for the period 2002/01/01 to 2006/01/18 )
- LBA-ECO CD-10 Temperature Profiles at km 67 Tower Site, Tapajos National Forest (data for the period 2002/01/01 to 2006/01/18 )
- LBA-ECO CD-03 Flux-Meteorological Data, km 77 Pasture Site, Para, Brazil: 2000-2005 (data for the period 2000/09/01 to 2006/01/01)
- LBA-ECO CD-04 CO2 Profiles, km 83 Tower Site, Tapajos National Forest (data for the period 2000/07/01 to 2004/03/12 )
- LBA-ECO CD-04 Meteorological and Flux Data, km 83 Tower Site, Tapajos National Forest (data for the period 2000/06/29 to 2004/03/11)
- LBA-ECO CD-02 Carbon and Oxygen Isotopes in Atmospheric CO2 in the Amazon: 1999-2004 (data for the period 1999/03/01 to 2004/03/31)
- LBA-ECO CD-04 CO2 and Heat Flux, km 83 Gap Tower Site, Tapajos National Forest (data for the period 2002/06/03 to 2004/01/30 )
- LBA-ECO CD-04 Meteorological and Flux Data, km 83 Tower Site, Tapajos National Forest (data for the period 2000/06/29 to 2004/03/11)
- LBA-ECO TG-07 Soil Trace Gas Fluxes km 67 Seca-Floresta Site, Tapajos National Forest (data for the period 2000/01/12 to 2004/04/28 )
- LBA-ECO CD-04 Soil Respiration, km 83 Tower Site, Tapajos National Forest, Brazil (data for the period 2001/12/19 to 2002/03/01)
Data Characteristics
Spatial Coverage: Flux tower sites within the Brazilian Amazon
Spatial Resolution: Point tower site
Temporal Coverage: 1999-01-01 to 2006-12-31 (Coverage varies by tower. See Table 2.)
Temporal Resolution: Hourly, daily, 16-day, and monthly
Site Boundaries: Latitude and longitude are given in decimal degrees. World Geodetic System, 1984 (WGS-84).
| Site (Region) | Tower Code (Data File) | Westernmost Longitude | Easternmost Longitude | Northernmost Latitude | Southernmost Latitude |
|---|---|---|---|---|---|
| Para Western (Santarem) - km 67 Primary Forest Tower | K67 | -54.959 | -54.959 | -2.857 | -2.857 |
| Para Western (Santarem) - km 77 Pasture Tower | K77 | -54.8885 | -54.8885 | -3.0202 | -3.0202 |
| Para Western (Santarem) - km 83 Logged Forest Tower | K83 | -54.9707 | -54.9707 | -3.017 | -3.017 |
| Amazonas (Manaus) - ZF2 km 34 | K34 | -60.2091 | -60 | -2.5 | -2.609 |
| Para Eastern (Belem) - FLONA Caxiuana | CAX | -51.4536 | -51.4536 | -1.7483 | -1.7483 |
| Rondonia - Fazenda Nossa Senhora | FNS | -62.3572 | -62.3572 | -10.7618 | -10.7618 |
| Rondonia - Jaru Biological Reserve Tower B | RJA | -61.9331 | -61.9331 | -10.078 | -10.078 |
| Tocantins - Ilha do Bananal | BAN | -50.1591111 | -50.1591111 | -9.824416667 | -9.824416667 |
| Sao Pablo - Reserva Pe-de-Gigante | RPG | -47.6498889 | -47.6498889 | -21.61947222 | -21.61947222 |
Data File Information
There are 36 data files in tab-delimited (*.txt) format included in this dataset. That is four files at hourly, daily, 16-day, and monthly resolution for each of the nine tower sites. All files include the same 211 variables.
Tower Codes used in data file names are provided in the above table. Examples shown use the "BAN" tower.
Data File Details
1. Hourly Data
- Data source: Original and quality assured time series data. These are the hourly base-files (_CfluxBF) for the other data products.
- Data aggregation intervals: Data reported at 10:00 are from aggregating measurements between 10:00 and 11:00. Hour runs from 0 (zero) to 23.
- Units: Precipitation (prec) units are mm hr-1. Other variable units are averaged over the aggregation interval.
- Example file name: BAN_CfluxBF.txt
NOTE: There are no original time series hourly files for the K77, RON_RJA, and RON_FNS sites; however, there are quality control-hourly files for those sites.
2. Daily Data
- Data source: Hourly data
- Data aggregation intervals: Julian day (day)
- Units: Precipitation (prec) units are mm hr-1 as average. Other variable units are averaged over the aggregation interval.
- Example file name: BANday_CfluxBF.txt
3. 16-Day (similar to MODIS products):
- Data source: Hourly data
- Data aggregation intervals: 16-days
- Units: Precipitation (prec) units are mm hr-1 as average. Other variable units are averaged over the aggregation interval.
- Example file name: BANday16_CfluxBF.txt
4. Monthly Data
- Data source: Daily data.
- Data aggregation intervals: Month. Variable value set to missing if less than 7 days of data, except precipitation.
- Units: Precipitation (prec) units are (mm day-1) as average. Other variable units are averaged over the aggregation interval.
- Example file name: BANmonth_CfluxBF.txt
Table 1. Variables (211) in all data files. Missing values and values for bad data are represented as -9999. Value ranges included when provided by authors. Note that all values are in scientific notation. See example data record below.
| # | Variable | Units | Description | Value Range | V1 and V2 notes |
|---|---|---|---|---|---|
| 1 | dateloc | NA | |||
| 2 | Year_LBAMIP | YYYY | Year (YYYY) | 1999-2006 | LBA-DMIP driver added to V2 |
| 3 | DoY_LBAMIP | JD | Julian day (DDD) | 0-366 | LBA-DMIP driver added to V2 |
| 4 | Hour_LBAMIP | HR | Hour, UTC time | 0-23 | LBA-DMIP driver added to V2 |
| 5 | Tair_LBAMIP | degK | Near surface air temperature | LBA-DMIP driver added to V2 | |
| 6 | Qair_LBAMIP | kg kg-1 | Near surface specific humidity | LBA-DMIP driver added to V2 | |
| 7 | Wind_LBAMIP | m s-1 | Near surface module of the wind | LBA-DMIP driver added to V2 | |
| 8 | Rainf_LBAMIP | kg m-2 s-1 | Rainfall rate. Average of the total rainfall over a time step and grid cell. | LBA-DMIP driver added to V2 | |
| 9 | PSurf_LBAMIP | Pa | Surface atmospheric pressure | LBA-DMIP driver added to V2 | |
| 10 | SWdown_LBAMIP | W m-2 | Surface incident shortwave radiation | LBA-DMIP driver added to V2 | |
| 11 | LWdown_LBAMIP | W m-2 | Surface incident longwave radiation | LBA-DMIP driver added to V2 | |
| 12 | CO2air_LBAMIP | Logical | Near surface CO2 concentration. The partial pressure of CO2 concentration at the atmospheric reference level (3D variable). | LBA-DMIP driver added to V2 | |
| 13 | GF_Tair_LBAMIP | Logical | Near surface air temperature | GF-LBA-DMIP driver added to V2 | |
| 14 | GF_Qair_LBAMIP | Logical | Near surface specific humidity | GF-LBA-DMIP driver added to V2 | |
| 15 | GF_Wind_LBAMIP | Logical | Near surface module of the wind | GF-LBA-DMIP driver added to V2 | |
| 16 | GF_Rainf_LBAMIP | Logical | Rainfall rate. Average of the total rainfall over a time step and grid cell. | GF-LBA-DMIP driver added to V2 | |
| 17 | GF_PSurf_LBAMIP | Logical | Surface atmospheric pressure | GF-LBA-DMIP driver added to V2 | |
| 18 | GF_SWdown_LBAMIP | Logical | Surface incident shortwave radiation | GF-LBA-DMIP driver added to V2 | |
| 19 | GF_LWdown_LBAMIP | Logical | Surface incident longwave radiation | GF-LBA-DMIP driver added to V2 | |
| 20 | GF_CO2air_LBAMIP | Logical | Near surface CO2 concentration. The partial pressure of CO2 concentration at the atmospheric reference level (3D variable). | GF-LBA-DMIP driver added to V2 | |
| 21 | ta | oC (degree Celsius) | AWS Air temperature | 0-40 | V1 |
| 22 | taed | oC (degree Celsius) | Sonic temperature | 0-40 | V1 |
| 23 | wd | degrees | Wind direction (Cup Anemometer) | V1 | |
| 24 | wded | degrees | Wind direction (Sonic Anemometer) | V1 | |
| 25 | pressed | KPa | Pressure eddy system | 90-110 | V1 |
| 26 | press | KPa | Pressure: Automatic Weather Station (AWS) | 40-110 | V1 |
| 27 | rg | W m-2 | Global Incident Radiation | 20-1200 | V1 |
| 28 | rr | W m-2 | Global Reflected Radiation | 20-800 | V1 |
| 29 | par | umol photons m-2 s-1 | PAR Incident Radiation | 0-2600 | V1 |
| 30 | rpar | umol photons m-2 s-1 | PAR Reflected Radiation | 0-1300 | V1 |
| 31 | Rn | W m-2 | Net Radiation | 100-1010 | V1 |
| 32 | FG | W m-2 | Soil Heat Flux | 26-32 | V1 |
| 33 | wsed | m s-1 | Wind speed (Cup Anemometer) | 0-19 | V1 |
| 34 | ws | m s-1 | Wind speed (Sonic Anemometer) | 0-26 | V1 |
| 35 | H | W m-2 | Sensible heat flux corrected for air heat capacity that can change with humidity | 100-600 | V1 |
| 36 | Hraw | W m-2 | Sensible heat flux (raw, without correction) | 100-600 | V1 |
| 37 | LE | W m-2 | Latent heat flux corrected for air heat capacity that can change with humidity | 100-1000 | V1 |
| 38 | Leraw | W m-2 | Latent heat flux (raw, without correction) | 100-1000 | V1 |
| 39 | Fc | umol CO2 m-2 s-1 | CO2 turbulent flux at the top of the canopy, corrected for air heat capacity that can change with humidity | 60-70 | V1 |
| 40 | Fcraw | umol CO2 m-2 s-1 | CO2 turbulent flux (raw, without correction) (60-70 umol CO2/m2/s) | 60-70 | V1 |
| 41 | co2 | ppm | CO2 concentration IRGA | 140-170 | V1 |
| 42 | sco2 | umol CO2 m-2 s-1 | Canopy storage flux of CO2 | -130 | V1 |
| 43 | NEE | umol CO2 m-2 s-1 | Net ecosystem exchange of CO2 | -140 | V1 |
| 44 | NEEf | umol CO2 m-2 s-1 | Filtered net ecosystem exchange | -140 | V1 |
| 45 | mrs | umol CO2 m-2 s-1 | Soil respiration | 0 | V1 |
| 46 | ust | m s-1 | Friction velocity (m/s) | 0.00-2.00 | V1 |
| 47 | rh | % | Relative humidity | 10-130 | V1 |
| 48 | prec | mm | Precipitation | 0-80 | V1 |
| 49 | h2o | mmol/mol | H2O concentration IRGA | 2-80 | V1 |
| 50 | Fh2o | mmols m-2 s-1 | Rate of vertical transfer of H2O (mmol/m2/s) | 15-20 | V1 |
| 51 | U | m s-1 | zonal wind (Cup Anemometer) | 15-20 | V1 |
| 52 | Ued | m s-1 | Zonal wind (Sonic Anemometer) | 13-Oct | V1 |
| 53 | V | m s-1 | Meridional wind (Cup Anemometer) | 19-15 | V1 |
| 54 | Ved | m s-1 | Meridional wind (Sonic Anemometer) | 30-Oct | V1 |
| 55 | ee | KPa | Vapor pressure | 0-20 | V1 |
| 56 | ees | KPa | Saturation vapour pressure | 0-13 | V1 |
| 57 | dpt | oC (degree Celsius) | Dew point temperature | 30-6- | V1 |
| 58 | tsavg | oC (degree Celsius) | Avg Soil Temperature | 5-40 | V1 |
| 59 | eqtemp | oC (degree Celsius) | Equivalent Temperature | 0 | V1 |
| 60 | abshu | g m-3 | Absolute Humidity | 0 | V1 |
| 61 | slopee | KPa oC -1 | Slope of Saturation Vapor Pressure | 0 | V1 |
| 62 | radtop | W m -2 | Hourly Theoretical Radiation | 0 | V1 |
| 63 | rgs | W m -2 | Short wave radiation in | 0-1200 | V1 |
| 64 | rgsout | W m -2 | Short wave radiation in | 0-200 | V1 |
| 65 | rgl | W m -2 | Long wave radiation in | 0-600 | V1 |
| 66 | rglout | W m -2 | Long wave radiation out | 0-600 | V1 |
| 67 | stdW | m s-1 | Standard deviation, vertical wind | 0 | V1 |
| 68 | ang | degrees | Rotation Angle | 0 | V1 |
| 69 | Tau | Kg m-2 s-1 | Rate of vertical tranference of momentum | 0 | V1 |
| 70 | zl | NA | Atmospheric stability parameter | 0 | V1 |
| 71 | tprof1 | oC (degree Celsius) | Canopy temperature profile | 10-50 | V1 |
| 72 | tprof2 | oC (degree Celsius) | Canopy temperature profile | V1 | |
| 73 | tprof3 | oC (degree Celsius) | Canopy temperature profile | V1 | |
| 74 | tprof4 | oC (degree Celsius) | Canopy temperature profile | V1 | |
| 75 | tprof5 | oC (degree Celsius) | Canopy temperature profile | V1 | |
| 76 | tprof6 | oC (degree Celsius) | Canopy temperature profile | V1 | |
| 77 | tprof7 | oC (degree Celsius) | Canopy temperature profile | V1 | |
| 78 | tprof8 | oC (degree Celsius) | Canopy temperature profile | V1 | |
| 79 | tprof9 | oC (degree Celsius) | Canopy temperature profile | V1 | |
| 80 | tprof10 | oC (degree Celsius) | Canopy temperature profile | V1 | |
| 81 | avgprofT | oC (degree Celsius) | Average Profile Temperature | 10-50 | V1 |
| 82 | msoil1 | m3 m-3 | Soil humidity profile | 0-5 | V1 |
| 83 | msoil2 | m3 m-3 | Soil humidity profile | V1 | |
| 84 | msoil3 | m3 m-3 | Soil humidity profile | V1 | |
| 85 | msoil4 | m3 m-3 | Soil humidity profile | V1 | |
| 86 | msoil5 | m3 m-3 | Soil humidity profile | V1 | |
| 87 | msoil6 | m3 m-3 | Soil humidity profile | V1 | |
| 88 | msoil7 | m3 m-3 | Soil humidity profile | V1 | |
| 89 | msoil8 | m3 m-3 | Soil humidity profile | V1 | |
| 90 | msoil9 | m3 m-3 | Soil humidity profile | V1 | |
| 91 | msoil10 | m3 m-3 | Soil humidity profile | V1 | |
| 92 | totalteta | m3 m-3 | Total H20 in the soil | 0-5 | V1 |
| 93 | pco2_1 | ppm | CO2 concentration profile | 200-600 | V1 |
| 94 | pco2_2 | ppm | CO2 concentration profile | V1 | |
| 95 | pco2_3 | ppm | CO2 concentration profile | V1 | |
| 96 | pco2_4 | ppm | CO2 concentration profile | V1 | |
| 97 | pco2_5 | ppm | CO2 concentration profile | V1 | |
| 98 | pco2_6 | ppm | CO2 concentration profile | V1 | |
| 99 | pco2_7 | ppm | CO2 concentration profile | V1 | |
| 100 | pco2_8 | ppm | CO2 concentration profile | V1 | |
| 101 | pco2_9 | ppm | CO2 concentration profile | V1 | |
| 102 | pco2_10 | ppm | CO2 concentration profile | V1 | |
| 103 | avgsto | ppm | Average Storage | 200-600 | V1 |
| 104 | h2o_1 | mmol/mol | H20 concentration profile | 10-85 | V1 |
| 105 | h2o_2 | mmol/mol | H20 concentration profile | V1 | |
| 106 | h2o_3 | mmol/mol | H20 concentration profile | V1 | |
| 107 | h2o_4 | mmol/mol | H20 concentration profile | V1 | |
| 108 | h2o_5 | mmol/mol | H20 concentration profile | V1 | |
| 109 | h2o_6 | mmol/mol | H20 concentration profile | V1 | |
| 110 | h2o_7 | mmol/mol | H20 concentration profile | V1 | |
| 111 | h2o_8 | mmol/mol | H20 concentration profile | V1 | |
| 112 | h2o_9 | mmol/mol | H20 concentration profile | V1 | |
| 113 | h2o_10 | mmol/mol | H20 concentration profile | V1 | |
| 114 | avgprofW | mmol/mol | Average H20 profile | 10-85 | V1 |
| 115 | Wind1 | m s-1 | Wind profile | 0-25 | V1 |
| 116 | Wind2 | m s-1 | Wind profile | V1 | |
| 117 | Wind3 | m s-1 | Wind profile | V1 | |
| 118 | Wind4 | m s-1 | Wind profile | V1 | |
| 119 | Wind5 | m s-1 | Wind profile | V1 | |
| 120 | Wavg | m s-1 | Average wind profile | 0-25 | V1 |
| 121 | tsoil1 | oC (degree Celsius) | Soil temperature profile | 5-40 | V1 |
| 122 | tsoil2 | oC (degree Celsius) | Soil temperature profile | V1 | |
| 123 | tsoil3 | oC (degree Celsius) | Soil temperature profile | V1 | |
| 124 | tsoil4 | oC (degree Celsius) | Soil temperature profile | V1 | |
| 125 | tsoil5 | oC (degree Celsius) | Soil temperature profile | V1 | |
| 126 | So | W m-2 | Top of the Atmosphere radiation | Added to V2 | |
| 127 | Re_5day | umol CO2 m-2 s-1 | Re: ecosystem respiration 5day model: 5 day night-time average (used) Fc | Added to V2 | |
| 128 | Re_5day_ust | umol CO2 m-2 s-1 | Re: ecosystem respiration 5day model: 5 day night-time average (used) Fc ustar corrected | Added to V2 | |
| 129 | Re_5day_sco2 | umol CO2 m-2 s-1 | Re: ecosystem respiration 5day model: 5 day night-time average (used) NEE | Added to V2 | |
| 130 | Re_5day_sco2_ust | umol CO2 m-2 s-1 | Re: ecosystem respiration 5day model: 5 day night-time average (used) NEE ustar corrected | Added to V2 | |
| 131 | Re_5day_ust_min | umol CO2 m-2 s-1 | Re: ecosystem respiration 5day model: 5 day night-time average (used) Fc ustar lower bound corrected | Added to V2 | |
| 132 | Re_5day_ust_max | umol CO2 m-2 s-1 | Re: ecosystem respiration 5day model: 5 day night-time average (used) Fc ustar upper bound corrected | Added to V2 | |
| 133 | Re_5day_sco2_ust_min | umol CO2 m-2 s-1 | Re: ecosystem respiration 5day model: 5 day night-time average (used) NEE ustar lower bound corrected | Added to V2 | |
| 134 | Re_5day_sco2_ust_max | umol CO2 m-2 s-1 | Re: ecosystem respiration 5day model: 5 day night-time average (used) NEE ustar upper bound corrected | Added to V2 | |
| 135 | Re_fourier_model | umol CO2 m-2 s-1 | Re: ecosystem respiration fourier: Re as in Richardson et al and Papale et al Fc | Added to V2 | |
| 136 | Re_fourier_ust_model | umol CO2 m-2 s-1 | Re: ecosystem respiration fourier: Re as in Richardson et al and Papale et al Fc ustar corrected | Added to V2 | |
| 137 | Re_fourier_sco2_model | umol CO2 m-2 s-1 | Re: ecosystem respiration fourier: Re as in Richardson et al and Papale et al NEE | Added to V2 | |
| 138 | Re_fourier_sco2_ust_model | umol CO2 m-2 s-1 | Re: ecosystem respiration fourier: Re as in Richardson et al and Papale et al NEE ustar corrected | Added to V2 | |
| 139 | Re_fourier_ust_min_model | umol CO2 m-2 s-1 | Re: ecosystem respiration fourier: Re as in Richardson et al and Papale et al Fc ustar lower bound corrected | Added to V2 | |
| 140 | Re_fourier_ust_max_model | umol CO2 m-2 s-1 | Re: ecosystem respiration fourier: Re as in Richardson et al and Papale et al Fc ustar upper bound corrected | Added to V2 | |
| 141 | Re_fourier_sco2_ust_min_model | umol CO2 m-2 s-1 | Re: ecosystem respiration fourier: Re as in Richardson et al and Papale et al NEE ustar lower bound corrected | Added to V2 | |
| 142 | Re_fourier_sco2_ust_max_model | umol CO2 m-2 s-1 | Re: ecosystem respiration fourier: Re as in Richardson et al and Papale et al NEE ustar upper bound corrected | Added to V2 | |
| 143 | NEE_night | umol CO2 m-2 s-1 | NEE: net ecosystem exchange nightime used for Re calculations | Added to V2 | |
| 144 | Fc_night | umol CO2 m-2 s-1 | Fc: CO2 flux nightime used for Re calculations | Added to V2 | |
| 145 | NEE_night_ust | umol CO2 m-2 s-1 | NEE: net ecosystem exchange nightime used for Re calculations ustar corrected | Added to V2 | |
| 146 | Fc_night_ust | umol CO2 m-2 s-1 | Fc: CO2 flux nightime used for Re calculations ustar corrected | Added to V2 | |
| 147 | Re_5day_ust_Sco2_LUT | umol CO2 m-2 s-1 | Re: ecosystem respiration 5day model: 5 day night-time average (used) NEE=Fc+Sco2 filled using the LUT method | Added to V2 | |
| 148 | Re_5day_ust_Sco2_IwataLIN | umol CO2 m-2 s-1 | Re: ecosystem respiration 5day model: 5 day night-time average (used) NEE=Fc+Sco2 filled using Iwata linear method | Added to V2 | |
| 149 | Re_5day_ust_Sco2_IwataLN | umol CO2 m-2 s-1 | Re: ecosystem respiration 5day model: 5 day night-time average (used) NEE=Fc+Sco2 filled using Iwata ln method | Added to V2 | |
| 150 | Re_5day_ust_Sco2_IwataPOL | umol CO2 m-2 s-1 | Re: ecosystem respiration 5day model: 5 day night-time average (used) NEE=Fc+Sco2 filled using Iwata 2nd degree polynomial method | Added to V2 | |
| 151 | Re_5day_ust_Sco2_EC | umol CO2 m-2 s-1 | Re: ecosystem respiration 5day model: 5 day night-time average (used) NEE=Fc+Sco2 filled using CO2 from the EC system | Added to V2 | |
| 152 | Re_5day_ust_Sco2_DIEL | umol CO2 m-2 s-1 | Re: ecosystem respiration 5day model: 5 day night-time average (used) NEE=Fc+Sco2 filled using the Diel method | Added to V2 | |
| 153 | NEEnogap_5day_ust_Sco2_LUT | umol CO2 m-2 s-1 | NEE: net ecosystem exchange 5day model: 5 day night-time average (used) NEE=Fc+Sco2 filled using the LUT method | Added to V2 | |
| 154 | NEEnogap_5day_ust_Sco2_IwataLIN | umol CO2 m-2 s-1 | NEE: net ecosystem exchange 5day model: 5 day night-time average (used) NEE=Fc+Sco2 filled using Iwata linear method | Added to V2 | |
| 155 | NEEnogap_5day_ust_Sco2_IwataLN | umol CO2 m-2 s-1 | NEE: net ecosystem exchange 5day model: 5 day night-time average (used) NEE=Fc+Sco2 filled using Iwata ln method | Added to V2 | |
| 156 | NEEnogap_5day_ust_Sco2_IwataPOL | umol CO2 m-2 s-1 | NEE: net ecosystem exchange 5day model: 5 day night-time average (used) NEE=Fc+Sco2 filled using Iwata 2nd degree polynomial method | Added to V2 | |
| 157 | NEEnogap_5day_ust_Sco2_EC | umol CO2 m-2 s-1 | NEE: net ecosystem exchange 5day model: 5 day night-time average (used) NEE=Fc+Sco2 filled using CO2 from the EC system | Added to V2 | |
| 158 | NEEnogap_5day_ust_Sco2_DIEL | umol CO2 m-2 s-1 | NEE: net ecosystem exchange 5day model: 5 day night-time average (used) NEE=Fc+Sco2 filled using the Diel method | Added to V2 | |
| 159 | GEP_5day_sco2_ust | umol CO2 m-2 s-1 | GEP: gross ecosystem productivity 5day model: 5 day night-time average (used) NEE ustar corrected | Added to V2 | |
| 160 | GEP_5day_sco2_ust_max | umol CO2 m-2 s-1 | GEP: gross ecosystem productivity 5day model: 5 day night-time average (used) NEE ustar lower bound corrected | Added to V2 | |
| 161 | GEP_5day_sco2_ust_min | umol CO2 m-2 s-1 | GEP: gross ecosystem productivity 5day model: 5 day night-time average (used) NEE ustar upper bound corrected | Added to V2 | |
| 162 | GEP_5day_ust | umol CO2 m-2 s-1 | GEP: gross ecosystem productivity 5day model: 5 day night-time average (used) Fc ustar corrected | Added to V2 | |
| 163 | GEP_5day_ust_max | umol CO2 m-2 s-1 | GEP: gross ecosystem productivity 5day model: 5 day night-time average (used) Fc ustar lower bound corrected | Added to V2 | |
| 164 | GEP_5day_ust_min | umol CO2 m-2 s-1 | GEP: gross ecosystem productivity 5day model: 5 day night-time average (used) Fc ustar upper bound corrected | Added to V2 | |
| 165 | GEP_5day_sco2 | umol CO2 m-2 s-1 | GEP: gross ecosystem productivity 5day model: 5 day night-time average (used) NEE | Added to V2 | |
| 166 | GEP_5day | umol CO2 m-2 s-1 | GEP: gross ecosystem productivity 5day model: 5 day night-time average (used) Fc ustar lower bound corrected | Added to V2 | |
| 167 | GEP_5day_sco2_ust_hyperbola | umol CO2 m-2 s-1 | GEP: gross ecosystem productivity 5day model: 5 day night-time average (used) NEE ustar corrected | Added to V2 | |
| 168 | GEP_5day_sco2_ust_hyperbola | umol CO2 m-2 s-1 | GEP: gross ecosystem productivity 5day model: 5 day night-time average (used) NEE ustar corrected | Added to V2 | |
| 169 | GEP_5day_ust_hyperbola | umol CO2 m-2 s-1 | GEP: gross ecosystem productivity 5day model: 5 day night-time average (used) Fc ustar corrected | Added to V2 | |
| 170 | GEP_5day_sco2_hyperbola | umol CO2 m-2 s-1 | GEP: gross ecosystem productivity 5day model: 5 day night-time average (used) NEE | Added to V2 | |
| 171 | GEP_5day_hyperbola | umol CO2 m-2 s-1 | GEP: gross ecosystem productivity 5day model: 5 day night-time average (used) Fc | Added to V2 | |
| 172 | NEE_spike5_free | umol CO2 m-2 s-1 | NEE: net ecosystem exchange NEE spike free | Added to V2 | |
| 173 | NEEnogap_5day_sco2_ust | umol CO2 m-2 s-1 | NEE: net ecosystem exchange NEE filled ustar corrected | Added to V2 | |
| 174 | NEEnogap_5day_ust | umol CO2 m-2 s-1 | NEE: net ecosystem exchange assumed =Fc Fc filled ustar corrected | Added to V2 | |
| 175 | NEEnogap_5day_sco2 | umol CO2 m-2 s-1 | NEE: net ecosystem exchange | Added to V2 | |
| 176 | NEEnogap_5day | umol CO2 m-2 s-1 | NEE: net ecosystem exchange assumed =Fc | Added to V2 | |
| 177 | Sco2_LUT | umol CO2 m-2 s-1 | Sco2: storage flux LUT method | Added to V2 | |
| 178 | Sco2_IwataLIN | umol CO2 m-2 s-1 | Sco2: storage flux Iwata linear method | Added to V2 | |
| 179 | Sco2_IwataLN | umol CO2 m-2 s-1 | Sco2: storage flux Iwata ln method | Added to V2 | |
| 180 | Sco2_IwataPOL | umol CO2 m-2 s-1 | Sco2: storage flux Iwata 2nd degree polynomial method | Added to V2 | |
| 181 | Sco2_EC | umol CO2 m-2 s-1 | Sco2: storage flux CO2 from the EC system | Added to V2 | |
| 182 | Sco2_DIEL | umol CO2 m-2 s-1 | Sco2: storage flux Diel method | Added to V2 | |
| 183 | Fc_spike7_free | umol CO2 m-2 s-1 | Fc: CO2 flux spike free | Added to V2 | |
| 184 | Sco2 | umol CO2 m-2 s-1 | Sco2: storage flux | Added to V2 | |
| 185 | GEP_5day_ust_Sco2_LUT | umol CO2 m-2 s-1 | GEP: gross ecosystem productivity 5day model: 5 day night-time average (used) NEE=Fc+Sco2 filled using the LUT method | Added to V2 | |
| 186 | GEP_5day_ust_Sco2_IwataLIN | umol CO2 m-2 s-1 | GEP: gross ecosystem productivity 5day model: 5 day night-time average (used) NEE=Fc+Sco2 filled using Iwata linear method | Added to V2 | |
| 187 | GEP_5day_ust_Sco2_IwataLN | umol CO2 m-2 s-1 | GEP: gross ecosystem productivity 5day model: 5 day night-time average (used) NEE=Fc+Sco2 filled using Iwata ln method | Added to V2 | |
| 188 | GEP_5day_ust_Sco2_IwataPOL | umol CO2 m-2 s-1 | GEP: gross ecosystem productivity 5day model: 5 day night-time average (used) NEE=Fc+Sco2 filled using Iwata 2nd degree polynomial method | Added to V2 | |
| 189 | GEP_5day_ust_Sco2_EC | umol CO2 m-2 s-1 | GEP: gross ecosystem productivity 5day model: 5 day night-time average (used) NEE=Fc+Sco2 filled using CO2 from the EC system | Added to V2 | |
| 190 | GEP_5day_ust_Sco2_DIEL | umol CO2 m-2 s-1 | GEP: gross ecosystem productivity 5day model: 5 day night-time average (used) NEE=Fc+Sco2 filled using the Diel method | Added to V2 | |
| 191 | GEP_5day_ust_Sco2_UST | umol CO2 m-2 s-1 | GEP: gross ecosystem productivity 5day model: 5 day night-time average (used) NEE=Fc+Sco2 filled using the Ustar method | Added to V2 | |
| 192 | GEP_5day_ust_Sco2_REG | umol CO2 m-2 s-1 | GEP: gross ecosystem productivity 5day model: 5 day night-time average (used) NEE=Fc+Sco2 filled using Regression method | Added to V2 | |
| 193 | GEP_model | umol CO2 m-2 s-1 | GEP: gross ecosystem productivity Selected for analysis Sco2 filled, ustar corrected, Re based on the 5day model | Added to V2 | |
| 194 | GEPmodel_ust_max | umol CO2 m-2 s-1 | GEP: gross ecosystem productivity Selected for analysis ustar corrected for lower bound | Added to V2 | |
| 195 | GEPmodel_ust_min | umol CO2 m-2 s-1 | GEP: gross ecosystem productivity Selected for analysis ustar corrected for upper bound | Added to V2 | |
| 196 | Re_model | umol CO2 m-2 s-1 | Re: ecosystem respiration Selected for analysis Sco2 filled, ustar corrected, Re based on the 5day model | Added to V2 | |
| 197 | Remodel_ust_max | umol CO2 m-2 s-1 | Re: ecosystem respiration Selected for analysis ustar corrected for lower bound | Added to V2 | |
| 198 | Remodel_ust_min | umol CO2 m-2 s-1 | Re: ecosystem respiration Selected for analysis ustar corrected for upper bound | Added to V2 | |
| 199 | Sco2_model | umol CO2 m-2 s-1 | Sco2: storage flux Selected for analysis | Added to V2 | |
| 200 | NEE_model_ust_max | umol CO2 m-2 s-1 | NEE: net ecosystem exchange Selected for analysis ustar corrected for upper bound | Added to V2 | |
| 201 | NEE_model_ust_min | umol CO2 m-2 s-1 | NEE: net ecosystem exchange Selected for analysis ustar corrected for lower bound | Added to V2 | |
| 202 | NEE_model | umol CO2 m-2 s-1 | NEE: net ecosystem exchange Selected for analysis Sco2 filled, ustar corrected | Added to V2 | |
| 203 | par_fill | umol CO2 m-2 s-1 | PAR: Photosynthetic Active Radiation filled | Added to V2 | |
| 204 | Pc | umol CO2 m-2 s-1 | Pc: photosyntetic capacity GEP (PAR>725 and PAR<925) | Added to V2 | |
| 205 | Pc_GEPfill | umol CO2 m-2 s-1 | Pc: photosyntetic capacity Selected for analysis GEP incl. Sco2 and ustar (PAR>725 and PAR<925) | Added to V2 | |
| 206 | Pc_AM | umol CO2 m-2 s-1 | Pc: photosyntetic capacity morning GEP (PAR>725 and PAR<925) | Added to V2 | |
| 207 | Pc_PM | umol CO2 m-2 s-1 | Pc: photosyntetic capacity afternoon GEP (PAR>725 and PAR<925) | Added to V2 | |
| 208 | Pc at med. VPD | umol CO2 m-2 s-1 | Pc: photosyntetic capacity at med VPD (1-2kPa) | Added to V2 | |
| 209 | Pc at low VPD | umol CO2 m-2 s-1 | Pc: photosyntetic capacity at low VPD (0-1kPa) | Added to V2 | |
| 210 | Pc at high VPD values | umol CO2 m-2 s-1 | Pc: photosyntetic capacity at high VPD (2-3kPa) | Added to V2 | |
| 211 | VPD | kPa | Vapor pressure deficit | Added to V2 |
Example Data Records: BANmonth_CfluxBF.txt
This very short excerpt is included to show the tab delimited structure for the 211 all numeric variables – the first row is variable names, and the second row is units. Data start in row three and note that all values are in scientific notation.
| dateloc Year_LBAMIP DoY_LBAMIP Hour_LBAMIP Tair_LBAMIP Qair_LBAMIP Wind_LBAMIP … NA YYYY JD HR degK kg kg-1 m s-1 … 7.3155100000000000e+05 2.0020000000000000e+03 3.3500000000000000e+02 0.0000000000000000e+00 -9.9990000000000000e+03 -9.9990000000000000e+03 -9.9990000000000000e+03 … 7.3258600000000000e+05 2.0050000000000000e+03 2.7400000000000000e+02 0.0000000000000000e+00 3.0059477504607167e+02 1.4361542797276887e-02 2.4486677385065501e+00 … |
Application and Derivation
This data product is an assimilation of eddy flux data that was independently produced and generously provided by the PIs of a variety of tower projects in the Amazon of Brazil. This integrated dataset is intended to facilitate integrative studies and data-model synthesis from a common reference point.
Quality Assessment
Uncertainty analysis can be performed by comparing the results of different methods included in this dataset as published in Restrepo-Coupe et al., 2013.
Data Acquisition, Materials, and Methods
Study Areas
This dataset is an assimilation of eddy flux data that was independently produced and provided by the investigators of a variety of tower projects in the Amazon of Brazil. Data are provided from nine flux network towers for the period 1999 thru 2006.
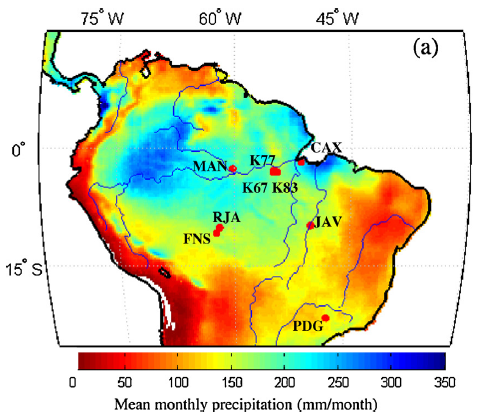
Figure 2. Location of Brazil flux network sites: Santarém forests (K67 and K83), Santarém converted site (K77), Manaus forest (K34), Caxiuanã forest (CAX), Reserva Jarú southern forest (RJA), Fazenda Nossa Senhora southern converted site (FNS), Javés River-Bananal Island (JAV) and savanna Pe-de Gigante (PDG). Shown is average monthly (1998–2012) precipitation (mm month−1) in the Amazon region according to Tropical Rainfall Measuring Mission (TRMM). From Restrepo-Coupe et al., 2013.
Tower site descriptions and codes used in Figure 2.
- Reserva Cuieiras near Manaus (K34 forest tower) (MAN)
- Tapajos National forest, near Santarem (K67 and K83 forest towers, and K77 pasture/agriculture tower)
- Caxiuana National forest (CAX forest tower), near Belem
- Reserva Jaru (RJA forest tower)
- Fazenda Nossa Senhora (FNS pasture tower), near Ji-Parana
- Tocantins-Javaes site (JAV seasonally flooded ecotone tower). Alternate code is BAN.
- Reserva Pe-de-Gigante in Sao Paulo state (PDG savanna tower)
Table 2. Nine towers and corresponding study areas. Information for these sites may also be found at the AmeriFlux site (https://ameriflux.lbl.gov/).
| Study Area_Tower | Tower Code | Description | Fluxnet Site Name/Site Code | Altitude (m) | Measurement Height (m) | Time Series |
|---|---|---|---|---|---|---|
| TOC_BAN | BAN | Tocantins State, Bananal seasonally flooded forest, mixture of cerrado, cerrado and campo (natural grassland) | Ecotone Bananal Island/BR-Ban | 120 | 40 | 24-Oct-03 to 8-Dec-06 |
| MAN_K34 | K34 | Manaus, km 34 tropical forest site | Manaus-ZF2 K34/BR-Ma2 | 130 | 50 | 14-Jun-99 to 30-Sep-06 |
| STM_K67 | K67 | Santarem, km 67 tropical forest site | Santarem-Km67-Primary Forest/BR-Sa1** | 130 | 63 | 2-Jan-02 to 23-Jan-06 |
| STM_K77 | K77 | Santarem, km 77 pasture-agriculture site | Santarem-Km77-Pasture/BR-Sa2 | 130 | 18 | 1-Jan-00 to 30-Dec-05 |
| STM_K83 | K83 | Santarem, km 83 selectively logged tropical forest | Santarem-Km83-Logged Forest/BR-Sa3*** | 130 | 64 | 29-Jun-00 to 12-Mar-04 |
| RON_RJA | RJA | Rondonia State, Reserva Jaru, tropical dry forest | Rond.- Rebio Jaru Ji Parana-Tower B/BR-Ji3 | 191 | 60 | 23-Mar-99 to 14-Nov-02 |
| RON_FNS | FNS | Rondonia State, Fazenda Nossa Senhora, pasture | Rond.- Faz. Nossa Senhora-Ji Parana-pasture/BR-Ji1 | 306 | 8.5 | 4-Feb-99 to 4-Nov-02 |
| PA_CAX | CAX | Para State, Caxiuana tropical forest | Caxiuana Forest-Almeirim/BR-Cax | 130 | 51.5 | 1-Jan-99 to 30-Jul-03 |
| SP_PDG | PDG | Sao Paulo State, Reserva Pe-de-Gigante (PDG) cerrado | Sao Paulo Cerrado/BR-Sp1 | 690 | 21 | 1-Jan-04 to 31-Dec-06 |
** Site information and data are also available from AmeriFlux (https://ameriflux.lbl.gov/sites/siteinfo/BR-Sa1).
*** Site information and data are also available from AmeriFlux (https://ameriflux.lbl.gov/sites/siteinfo/BR-Sa3).
Data Processing
The data compilation provided in Version 2 follows data harmonization across projects, quality control checks, flux modeling, uncertainty analyses, and includes LBA MIP Project drivers and validation data aggregated to the various time intervals that were performed as described in detail in Restrepo-Coupe et al. (2013) and Restrepo-Coupe et al. (2017).
Data Access
These data are available through the Oak Ridge National Laboratory (ORNL) Distributed Active Archive Center (DAAC).
LBA-ECO CD-32 Flux Tower Network Data Compilation, Brazilian Amazon: 1999-2006, V2
Contact for Data Center Access Information:
- E-mail: uso@daac.ornl.gov
- Telephone: +1 (865) 241-3952
References
Hutyra, L.R., S.C. Wofsy, and S.R. Saleska. 2007. LBA-ECO CD-10 CO2 and H2O Eddy Flux Data at km 67 Tower Site, Tapajos National Forest. ORNL DAAC, Oak Ridge, Tennessee, USA. https://doi.org/10.3334/ORNLDAAC/860
Restrepo-Coupe, N., Rocha, H.R. da, Christoffersen, B., Araujo, A.C. da, Borma, L.S., Cabral, O.M.R., Camargo, P.B. de, Cardoso, F.L., Costa, A.C.L. da, Fitzjarrald, D.R., Goulden, M.L., Hutyra, L.R., Kruijt, B., Maia, J.M.F., Malhi, Y.S., Manzi, A.O., Miller, S.D., Nobre, A.D., Randow, C. von, Sá, L.D. da A., Sakai, R.K., Tota, J., Wofsy, S.C., Zanchi, F.B., Saleska, S.R. 2013. What drives the seasonality of productivity across the Amazon basin? A cross-site analysis of eddy flux tower measurements from the Brasil flux network. Agricultural and Forest Meteorology. https://doi.org/10.1016/j.agrformet.2013.04.031
Restrepo-Coupe, N., Levine, N. M., Christoffersen, B. O., Albert, L. P., Wu, J., Costa, M. H., Galbraith, D., Imbuzeiro, H., Martins, G., da Araujo, A. C., Malhi, Y. S., Zeng, X., Moorcroft, P., & Saleska, S. R. (2017). Do dynamic global vegetation models capture the seasonality of carbon fluxes in the Amazon basin? A data-model intercomparison. Global Change Biology, 23(1), 191-208. https://doi.org/10.1111/gcb.13442
Saleska, S.R., H.R. da Rocha, A.R. Huete, A.D. Nobre, P.E. Artaxo, and Y.E. Shimabukuro. 2013. LBA-ECO CD-32 Flux Tower Network Data Compilation, Brazilian Amazon: 1999-2006. ORNL DAAC, Oak Ridge, Tennessee, USA. https://doi.org/10.3334/ORNLDAAC/1174
Related Publications
- da Rocha, H.R., A.O. Manzi, O.M. Cabral, S.R. Saleska, S.D. Miller, M.L. Goulden, S.C. Wofsy, N. R.-Coupe, L.S. Borma, A.D. Nobre, G. Vourlitis, J.S. Nogueira, F.L. Cardoso, B. Kruijt, H. Freitas, C. von Randow, R.G. Aguiar, and J.F. Maia. 2009. Patterns of water and heat flux across a biome gradient from tropical forest to savanna in Brazil. Journal of Geophysical Research - Biogeosciences, 114 (G00B12), doi:10.1029/2007JG000640.
- Saleska, S.R., Rocha, H.R. da, Kruijt, B., Nobre, A.D., 2009. Ecosystem Carbon Fluxes and Amazonian Forest Metabolism, in: Amazonia and global change. American Geophysical Union, Washington DC.
- Restrepo-Coupe, N., Christoffersen, B., Rocha, H.R. da, Araujo, A.C. da, Borma, L.S., Cabral, O.M.R., Camargo, P.B. de, Cardoso, F.L., Costa, A.C.L. da, Fitzjarrald, D.R., Goulden, M.L., Hutyra, L.R., Kruijt, B., Maia, J.M.F., Malhi, Y.S., Manzi, A.O., Miller, S.D., Nobre, A.D., Randow, C. von, Sá, L.D. da A., Sakai, R.K., Tota, J., Wofsy, S.C., Zanchi, F.B., Saleska, S.R., submitted. Gross Ecosystem Productivity Seasonality in the Tropics: Issues Posed by the Absence of Co2 Profile Measurements at Eddy-Flux Systems. Agricultural and Forest Meteorology.
- Restrepo-Coupe, N., Rocha, H.R. da, Christoffersen, B., Araujo, A.C. da, Borma, L.S., Cabral, O.M.R., Camargo, P.B. de, Cardoso, F.L., Costa, A.C.L. da, Fitzjarrald, D.R., Goulden, M.L., Hutyra, L.R., Kruijt, B., Maia, J.M.F., Malhi, Y.S., Manzi, A.O., Miller, S.D., Nobre, A.D., Randow, C. von, Sá, L.D. da A., Sakai, R.K., Tota, J., Wofsy, S.C., Zanchi, F.B., Saleska, S.R., submitted. What drives the seasonality of productivity across the Amazon basin? A cross-site analysis of eddy flux tower measurements from the Brasil flux network. Agricultural and Forest Meteorology.
- Saleska, S.R., Didan, K., Huete, A.R., da Rocha, H.R., 2007. Amazon Forests Green-Up During 2005 Drought. Science 318, 612.
Dataset Revisions
Changes made to Version 1 implemented in Version 2
- Added VPD and Pc (Photosynthetic Capacity) for different VPD conditions.
- Missing values set to -9999.
- C-flux products added: Gross Ecosystem Exchange, ecosystem respiration, filled Net Ecosystem Exchange, using different methods.
- Canopy storage (Sco2) analysis added.
- LBA-DMIP drivers added.
- New variables added: Top of the Atmosphere radiation, filled PAR, among others
- Change time vector from local time to UTM
- Additional QAQC added:
- Pe-de-Gigante atmospheric pressure corrected accordingly to near-by study site (mean adjusted) probably a problem with the calibration of the sensor
- K67 PAR included even if filled (after 2005)
- K83 PAR included even if a downward trend was observed (probably due to sensor degradation)