Documentation Revision Date: 2016-06-01
Data Set Version: V1
Summary
This data set includes 10 files in *.csv format, 5 for temperature and 5 for relative humidity over different periods of time (pre-calibration in office and garage, field deployment, and post-calibration in office and garage). There are three companion files of which two are *.csv files containing the Collection Log and the Collection Dates and one *.pdf file showing the locations of the 12 loggers around the NASA Goddard Space Flight Center.
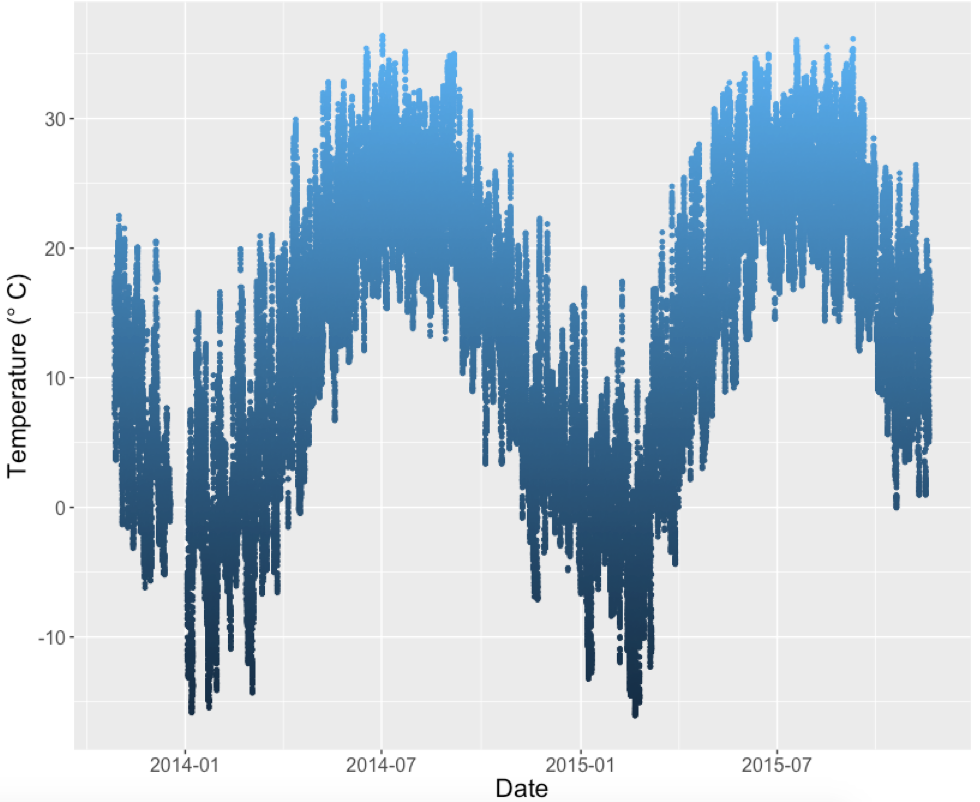
Figure 1: Temperature readings (degrees C) from Logger1 located in the Rain Garden near Building 32 on the Goddard Space Flight Center campus in Greenbelt, MD.
Citation
Carroll, M.L., M.E. Brown, M.R. Wooten, J.E. Donham, A.B. Hubbard, and W.B. Ridenhour. 2016. In-situ Air Temperature and Relative Humidity in Greenbelt, MD, 2013-2015. ORNL DAAC, Oak Ridge, Tennessee, USA. http://dx.doi.org/10.3334/ORNLDAAC/1319
Table of Contents
- Data Set Overview
- Data Characteristics
- Application and Derivation
- Quality Assessment
- Data Acquisition, Materials, and Methods
- Data Access
- References
Data Set Overview
This data set describes the temperature and relative humidity at 12 locations around Goddard Space Flight Center in Greenbelt MD at 15 minute intervals between November 2013 and November 2015. These data were collected to study the impact of surface type on heating in a campus setting and to improve the understanding of urban heating and potential mitigation strategies on the campus scale. Sensors were mounted on posts at 2 m above surface and placed on 7 different surface types around the centre: asphalt parking lot, bright surface roof, grass field, forest, and stormwater mitigation features (bio-retention pond and rain garden). The data files are organized by time period: office pre-calibration (20130905-20130918), garage pre-calibration (20130920-20131003), live data collection (20131028-20151119), garage post-calibration (20151129-20151212), and office post-calibration (20151215-20151228). This dataset could be used to validate satellite-based study or could be used as a stand-alone study of the impact of surface type on heating in a campus setting.
Data Characteristics
This data set includes 10 files in *.csv format, 5 for temperature and 5 for relative humidity over different periods of time (pre-calibration in office and garage, field deployment, and post-calibration in office and garage). There are three companion files of which two are *.csv files containing the Collection Log and the Collection Dates and one *.pdf file showing the locations of the 12 loggers around the NASA Goddard Space Flight Center.
Site boundaries: (All latitude and longitude given in decimal degrees)
|
Site |
Westernmost Longitude |
Easternmost Longitude |
Northernmost Latitude |
Southernmost Latitude |
|
Goddard Space Flight Center, Greenbelt MD |
-76.8569 |
-76.8401 |
39.0000 |
39.9926 |
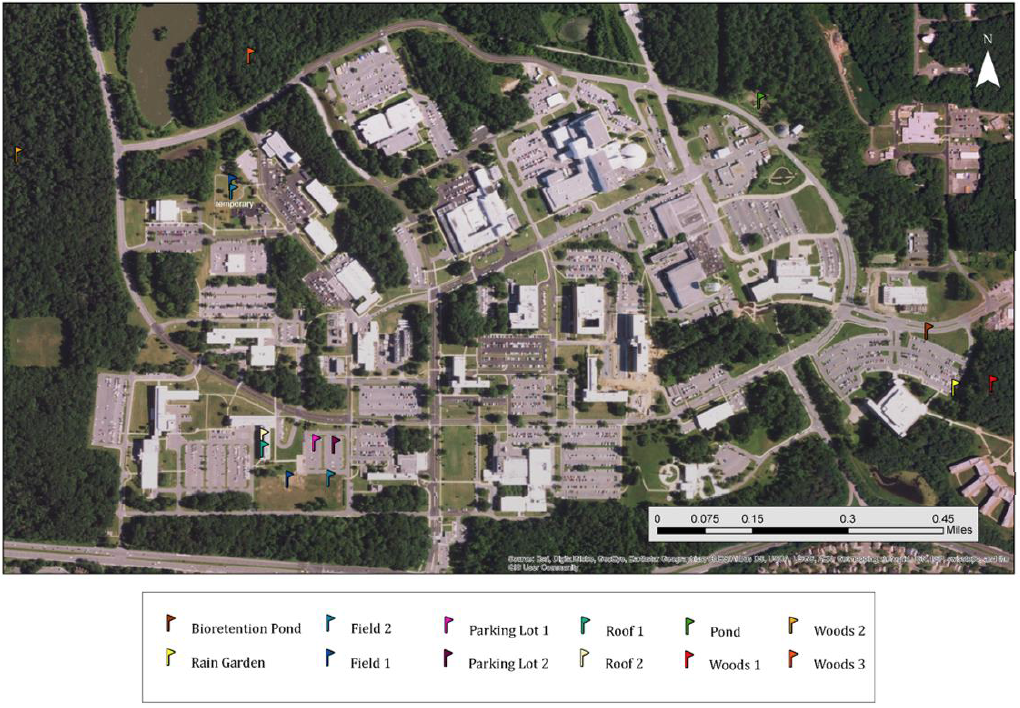
Figure 2. Data logger locations
Table 1. Data logger locations
| Data Logger Locations | Latitude | Longitude |
| Rain garden by Building 32 | 38.9943 | -76.8409 |
| Parking lot #2, furthest from Building 6 | 38.9932 | -76.855 |
| Pond by salt dome | 38.9993 | -76.8453 |
| Parking lot #1, closest to B6 | 38.9933 | -76.8555 |
| Field #1, closest to B6 | 38.9926 | -76.8561 |
| Field #2, furthest from B6 | 38.9926 | -76.8551 |
| Bioretention pond, upper lot by B32 | 38.9952 | -76.8415 |
| Roof#1, closest to door | 38.9932 | -76.8567 |
| Roof#2, furthest from door | 38.9934 | -76.8567 |
| Woods#1, between B32&B33 | 38.9943 | -76.8401 |
| Woods#2, by employee gate | 38.9984 | -76.8622 |
| Woods#3, off Cobe road, marked by log | 39.0001 | -76.8569 |
Table 2. Data and companion files
| File Name | Description |
| Temperature_20130905-20130918_preCal_office.csv | Pre-calibration temperature data at office |
| Temperature _20130919-20131021_preCal_garage.csv | Pre-calibration temperature data at garage |
| Temperature _20131028-20131119_GSFC.csv | Live temperature data collection |
| Temperature _20151129-20151212_postCal_garage.csv | Post-Calibration temperature data at garage |
| Temperature _20151215-20151228_postCal_office.csv | Post-Calibration temperature data at office |
| RelativeHumidity_20130905-20130918_preCal_office.csv | Pre-calibration relative humidity data at office |
| RelativeHumidity _20130919-20131021_preCal_garage.csv | Pre-calibration relative humidity data at garage |
| RelativeHumidity _20131028-20131119_GSFC.csv | Live relative humidity data collection |
| RelativeHumidity _20151129-20151212_postCal_garage.csv | Post-Calibration relative humidity data at garage |
| RelativeHumidity _20151215-20151228_postCal_office.csv | Post-Calibration relative humidity data at office |
| Companion Files: | |
| Collection_Dates.csv | The dates when data were collected by the loggers |
| Collection_Log.csv | Log of events recorded for the study period |
| Logger_Names_Location.pdf | Names and spatial locations of the 12 loggers |
Table 3. Data fields in the temperature files
|
Data Field |
Units |
Description |
|
Date_Time |
yyyy-mm-dd hh:mm |
Date and time of the data collection |
|
Logger1 |
oC |
Temperature measured by the logger at Rain garden by Building 32 |
|
Logger2 |
oC |
Temperature measured by the logger at Parking lot #2, furthest from Building 6 |
|
Logger3 |
oC |
Temperature measured by the logger at Pond by salt dome |
|
Logger4 |
oC |
Temperature measured by the logger at Parking lot #1, closest to B6 |
|
Logger5 |
oC |
Temperature measured by the logger at Field #1, closest to B6 |
|
Logger6 |
oC |
Temperature measured by the logger at Field #2, furthest from B6 |
|
Logger7 |
oC |
Temperature measured by the logger at Bioretention pond, upper lot by B32 |
|
Logger8 |
oC |
Temperature measured by the logger at Roof#1, closest to door |
|
Logger9 |
oC |
Temperature measured by the logger at Roof#2, farthest from door |
|
Logger10 |
oC |
Temperature measured by the logger at Woods#1, between B32&B33 |
|
Logger11 |
oC |
Temperature measured by the logger at Woods#2, by employee gate |
|
Logger12 |
oC |
Temperature measured by the logger at Woods#3, off Cobe road, marked by log |
Table 3. Data fields in the relative humidity files
|
Data Field |
Units |
Description |
|
Date_Time |
yyyy-mm-dd hh:mm |
Date and time of the data collection |
|
Logger1 |
% |
Relative Humidity measured by the logger at Rain garden by Building 32 |
|
Logger2 |
% |
Relative Humidity measured by the logger at Parking lot #2, furthest from Building 6 |
|
Logger3 |
% |
Relative Humidity measured by the logger at Pond by salt dome |
|
Logger4 |
% |
Relative Humidity measured by the logger at Parking lot #1, closest to B6 |
|
Logger5 |
% |
Relative Humidity measured by the logger at Field #1, closest to B6 |
|
Logger6 |
% |
Relative Humidity measured by the logger at Field #2, furthest from B6 |
|
Logger7 |
% |
Relative Humidity measured by the logger at Bioretention pond, upper lot by B32 |
|
Logger8 |
% |
Relative Humidity measured by the logger at Roof#1, closest to door |
|
Logger9 |
% |
Relative Humidity measured by the logger at Roof#2, farthest from door |
|
Logger10 |
% |
Relative Humidity measured by the logger at Woods#1, between B32&B33 |
|
Logger11 |
% |
Relative Humidity measured by the logger at Woods#2, by employee gate |
|
Logger12 |
% |
Relative Humidity measured by the logger at Woods#3, off Cobe road, marked by log |
Application and Derivation
This dataset could be used as a validation dataset for a satellite-based study or could be used as a stand-alone study of the impact of surface type on heating in a campus setting.
Quality Assessment
Uncertainty in the data was not quantified, however the pre- and post-deployment data could be used to estimate the variation between and among sensors since all loggers were in the same environment during these periods.
Data Acquisition, Materials, and Methods
Twelve “HOBO U23 Pro v2 External Temperature/Relative Humidity Data Logger - U23-002” were used to record data at the NASA Goddard Space Flight Center (GSFC). The loggers were programmed to record temperature and humidity at 15 minute intervals beginning at the start of an hour. In this way all loggers were recording at the same time. The loggers were mounted on posts at 2 meters height above the ground with the actual logger mounted inside a radiation shield to minimize direct sunlight on the probe. The twelve loggers were deployed on 7 different surface types around the center: asphalt parking lot, bright surface roof, grass field, forest, and stormwater mitigation features (bio-retention pond and rain garden).
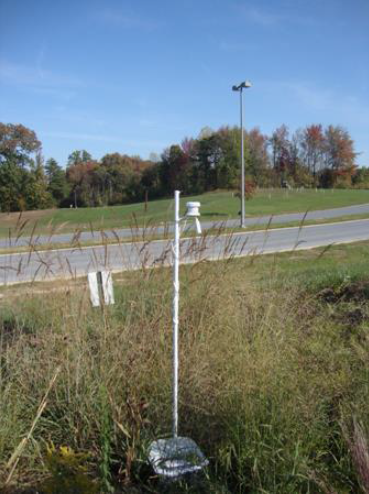
Figure 3. Data logger mounted at the rain garden location on GSFC campus.
The data were collected over 5 periods of time: office pre-calibration (20130905-20130918), garage pre-calibration (20130920-20131003), live data collection (20131028-20151119), garage post-calibration (20151129-20151212), and office post-calibration (20151215-20151228). The loggers were initialized in the office in September 2013. They were placed in a box with ventilation for 2 weeks on a shelf to assess the amount of agreement between the loggers in a controlled environment. The box was moved to a garage with no temperature controls for an additional 2 weeks prior to being deployed in the field in late October 2013. Data was downloaded every 2 – 3 weeks. A portable data shuttle was used to download data in the field and transfer it to a PC and a log of observations and dates of download was maintained. The loggers were retrieved in November 2015 after collecting data for 2 years continuously. Upon retrieval the loggers were placed in a box and stored in the same garage for 2 weeks. The box was moved to the climate controlled office for 2 more weeks after which data collection stopped. The information collecting during the pre- and post- deployment can be used to determine sensor to sensor agreement both before deployment and after retrieval.
Data Access
This data is available through the Oak Ridge National Laboratory (ORNL) Distributed Active Archive Center (DAAC).
In-situ Air Temperature and Relative Humidity in Greenbelt, MD, 2013-2015
Contact for Data Center Access Information:
- E-mail: uso@daac.ornl.gov
- Telephone: +1 (865) 241-3952
References
Carroll, M. L., Brown, M. E., Wooten, M. R., Donham, J. E., Hubbard, A. B., and Ridenhour, W. B.: In-situ air temperature and humidity measurements over diverse landcovers in Greenbelt, MD Nov. 2013–Nov. 2015, Earth Syst. Sci. Data Discuss., doi:10.5194/essd-2016-13, in review, 2016.