Get Data
Summary
The MODIS global subsetting and visualization tool provides customized subsets and visualizations of 13 MODIS Collection 5 land products on demand for any land area on Earth, from 1 pixel up to 201 x 201 km. Subset products are made available to the user through an interactive web page. On this page are time series plots, QC information, land cover and phenology, citation, and data download.
Users specify a location for the center point of their area of interest by either entering the geographic coordinates or selecting the location on an interactive map. The land area is then defined by specifying the desired number of kilometers “Above and Below” and “Left and Right” of the center point (recall that MODIS land products are in sinusoidal projection).
Users then choose the desired MODIS land product (Table 1) and date range for this subset. After providing a valid e-mail address, the request is submitted and the subset and associated products created. The user receives an e-mail with a link to a customized “Data Visualization and Download” page.
The tool provides time series plots of the measurement, quality information, land cover grid (land cover classification) of the area and phenology, along with an estimate of heterogeneity (Shannon richness and evenness). The land product subset data are provided in comma-separated value (*.csv) and GeoTIFF (*.tif) formats.
Related MODIS Tools:
Data Citations:
Citing MODIS Land Products obtained via Global Subsetting Tool:
Citation Format:
ORNL DAAC 2008. MODIS Collection 5 Land Products Global Subsetting and Visualization Tool. ORNL DAAC, Oak Ridge, Tennessee, USA. Accessed Month dd, yyyy. Subset obtained for [Product name] product at [Lat],[Lon], time period: [Start date] to [End date], and subset size: [Width] x [Height] km. http://dx.doi.org/10.3334/ORNLDAAC/1241
Citation Example:
ORNL DAAC 2008. MODIS Collection 5 Land Products Global Subsetting and Visualization Tool. ORNL DAAC, Oak Ridge, Tennessee, USA. Accessed August 27, 2015. Subset obtained for MOD11A2 product at 35.9587N,84.2874W, time period: 2000-03-29 to 2015-06-02, and subset size: 101 x 101 km. http://dx.doi.org/10.3334/ORNLDAAC/1241
Refer to Data Product Citation Guidelines for additional information.
Table of Contents:
- 1 Data Set Overview
- 2 Data Characteristics
- 3 Applications and Derivation
- 4 Quality Assessment
- 5 Acquisition Materials and Methods
- 6 Data Access
- 7 References
1. Data Set Overview:
The MODIS Global subsetting and visualization tool provides customized subsets and visualizations of 13 MODIS Collection 5 land products on demand for any land area on Earth, from 250-m to 1-km resolution. Subset products are made available to the user through an interactive web page. On this page are time series plots, QC information, land cover and phenology, citation, and data download.
Users specify a location for the center point of their area of interest by either entering the geographic coordinates or selecting the location on an interactive map. The land area is then defined by specifying the desired number of kilometers “Above and Below” and “Left and Right” of the center point (recall that MODIS land products are in sinusoidal projection).
Users then choose the desired MODIS land product (Table 1) and date range for this subset. After providing a valid e-mail address, the request is submitted and the subset and associated products created. The user receives an e-mail with a link to a customized “Data Visualization and Download” page.
The tool provides time series plots of the measurement, quality information, and a land cover grid (land cover classification) of the area and phenology, along with an estimate of heterogeneity (Shannon richness and evenness). The land product subset data are provided in comma-separated value (*.csv) format.
2. Data Characteristics:
The 13 data products available through the global subsetting and visualization tool are from the MODIS instrument flown on both Terra and Aqua satellites. Terra products are available for the years 2000-present, and Aqua products are available from June 2002-present. They are available as 8-day, 16-day, and annual composite periods at 250-m, 500-m resolution, or 1-km (depending on the product). Products are in sinusoidal projection.
Table 1. MODIS subsets available from the ORNL DAAC.
| MODIS Product | Description |
|---|---|
| MCD43A | MODIS/Terra+Aqua BRDF and calculated Albedo |
| MCD43A4 | MODIS/Terra+Aqua Nadir BRDF-adjusted reflectance16-Day L3 Global 500m SIN Grid V005 |
| MOD09A1 | MODIS/Terra Surface Reflectance (SREF) 8-Day L3 Global 500m SIN Grid |
| MOD11A2 | MODIS/Terra Land Surface Temperature/Emissivity (LST) 8-Day L3 Global 1km SIN Grid |
| MOD13Q1 | MODIS/Terra Vegetation Indices Vegetation indices; (NDVI/EVI) 16-Day L3 Global 250m SIN Grid |
| MOD15A2 | MODIS/Terra Leaf Area Index (LAI) and Fraction of Photosynthetically Active Radiation (FPAR) 8-Day Composite |
| MOD16A2 | MODIS/Terra Evapotranspiration |
| MOD17A2_51 | MODIS/Terra Gross Primary Production (GPP) |
| MOD17A3 | MODIS/Terra Net Primary Production (NPP) |
| MYD09A1 | MODIS/Aqua Surface Reflectance (SREF) |
| MYD11A2 | MODIS/Aqua Land Surface Land surface temperature/Emissivity (LST)8-Day L3 Global 1km SIN Grid |
| MYD13Q1 | MODIS/Aqua Vegetation Indices (NDVI/EVI) 16-Day L3 Global 1km SIN Grid |
| MYD15A2 | MODIS/Aqua Leaf Area Index (LAI) and Fraction of Photosynthetically Active Radiation (FPAR) 8 Day Composite |
3. Data Application and Derivation:
MODIS subsets provide products to use for validation of models and remote-sensing products and to characterize field sites. In addition, data visualizations (time series plots and grids showing single composite periods) are available.
4. Quality Assessment:
The MODIS Land Science Team maintains a MODIS Land Quality Assessment site, MODIS Land Quality Assessment, referred to as MODLAND, which provides on a routine basis, and formally stored as product metadata and as per-pixel information, the results of the continuous quality assurance. These results are also placed on the Product Quality Web pages associated with the site.
5. Data Acquisition Materials and Methods:
Data Processing
The tiles are provided to the ORNL DAAC from the Land Processes DAAC (LP DAAC). The ORNL DAAC creates subsets and packages the data.
Tool Description
There are four steps for creating data product subsets with the MODIS global subsetting and visualization tool, illustrated below. Clicking the "back button" results in going back one page. A user can restart the visualization (back to step one-selecting a location) at any step in the process by clicking the "Restart this Visualization" button on each page in the process.
Step 1) Select a location by clicking on the map provided or by entering the site latitude and longitude in decimal degrees, and click the “Continue” button.
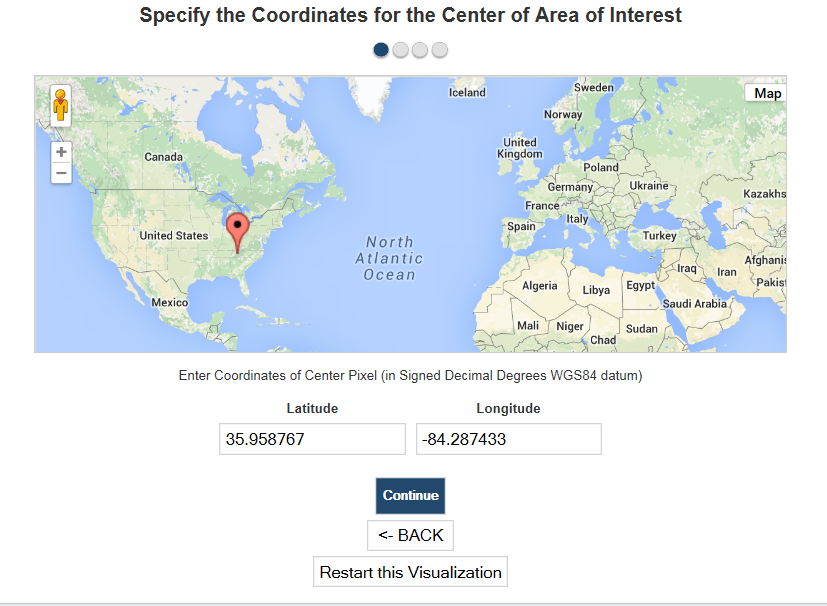
Figure 1. MODIS Global Tool, Step1- map with "click and drag" function for location selection.
Step 2) Select the MODIS Land Product; enter desired subset size for Above and Below and Left and Right; and click the “Continue” button.
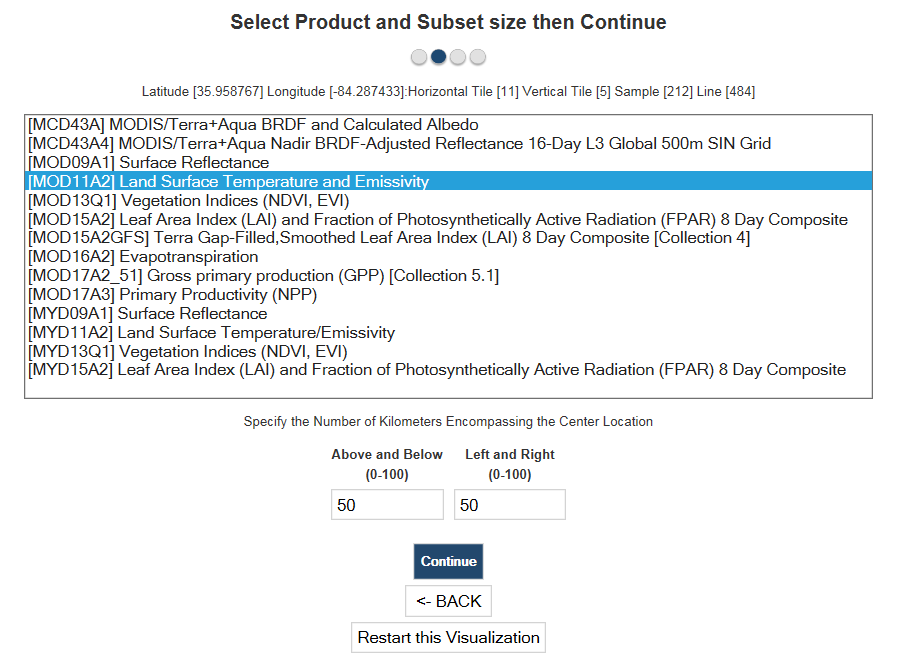
Figure 2. MODIS Global Tool, Step 2- product and subset size selection page.
Step 3) Select the temporal starting date and ending date; select the desired GeoTiff Option; enter email address; and click the “Review Order” button.
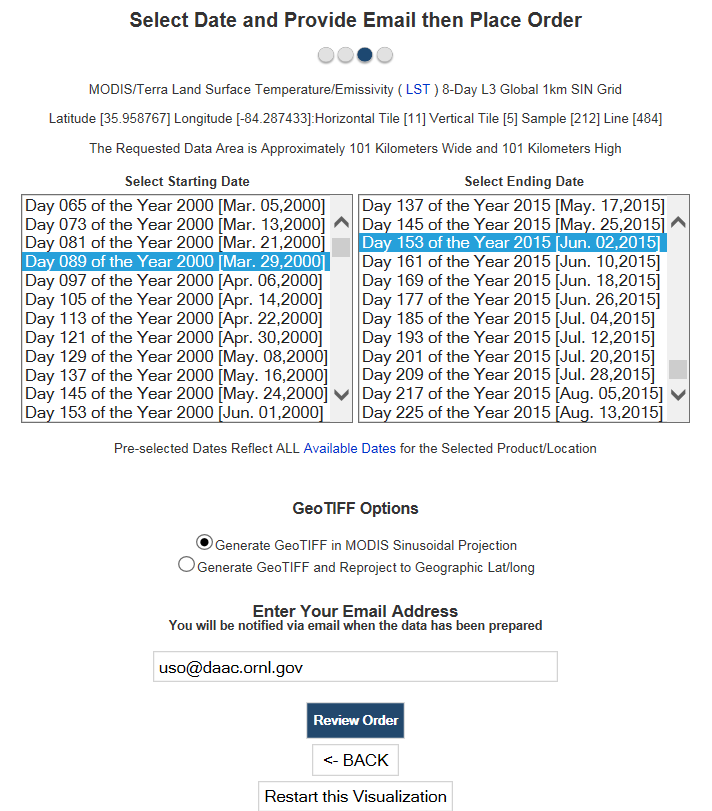
Figure 3. MODIS Global Tool, Step 3 - selection of temporal range, GeoTIFF Options, email address entry, and submission.
Step 4) Review the Order Summary page and press the “Create Subset” button.
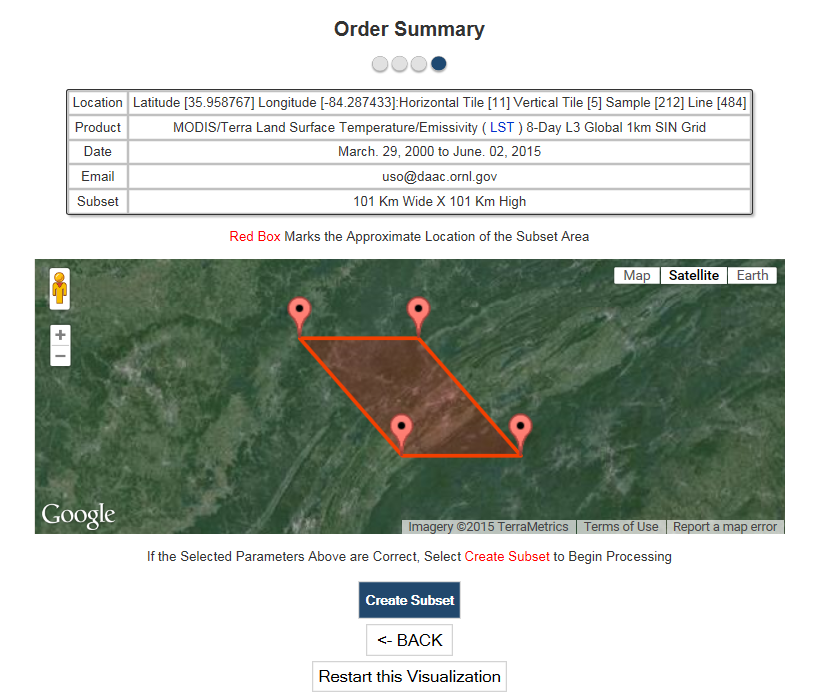
Figure 4. MODIS Global Tool, Step 4-order review and subset creation.
An order summary with order status is displayed.
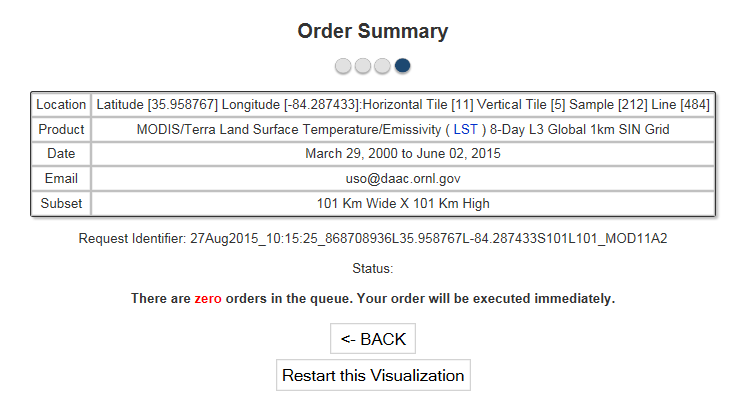
Figure 5. Data order
summary and order status page.
Data Retrieval:
Each MODIS Subset Order contains a unique access URL, provided by an instructional email message with links for retrieving and downloading the data and its citation.
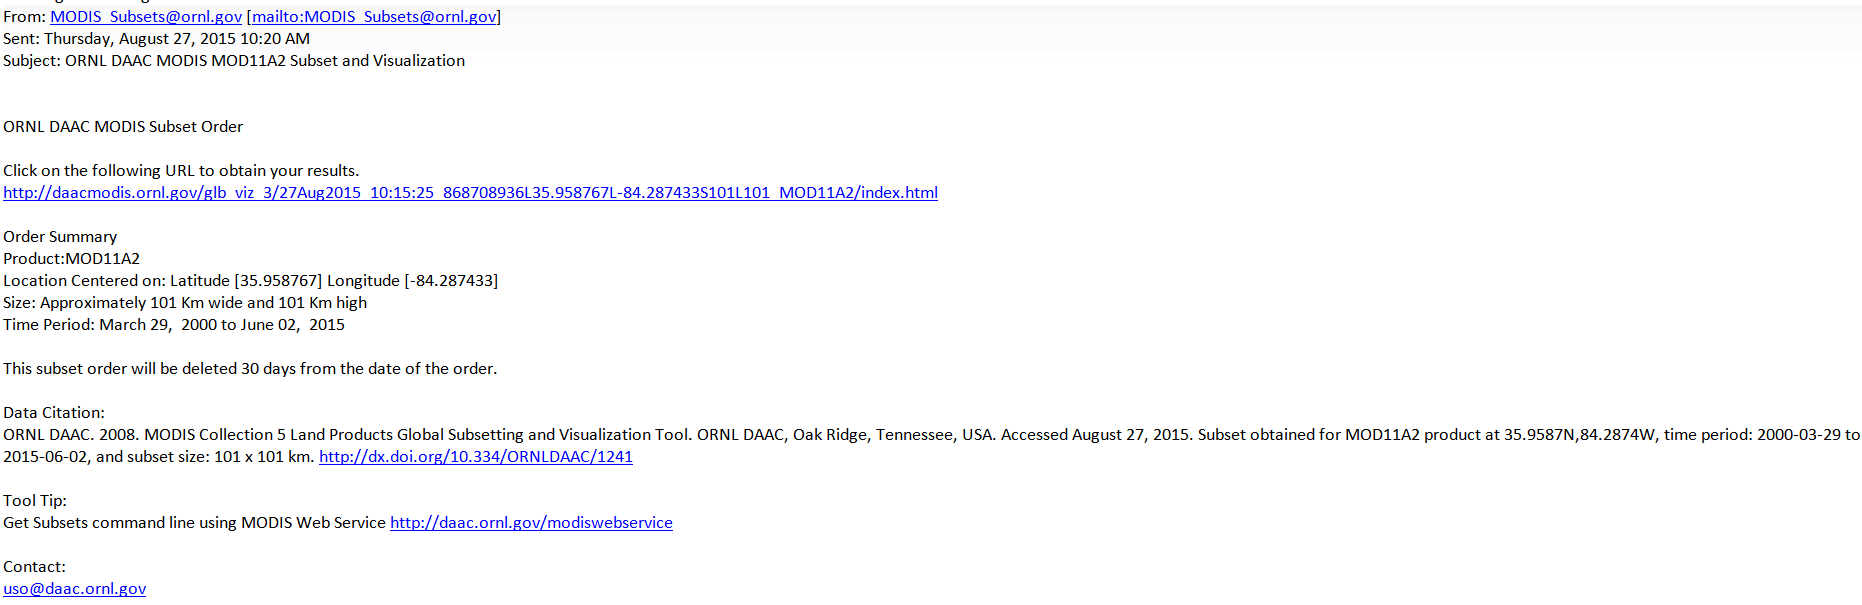
Figure 6. Email notification of data order and instructions for data retrieval.
MODIS Global Tool Order Content:
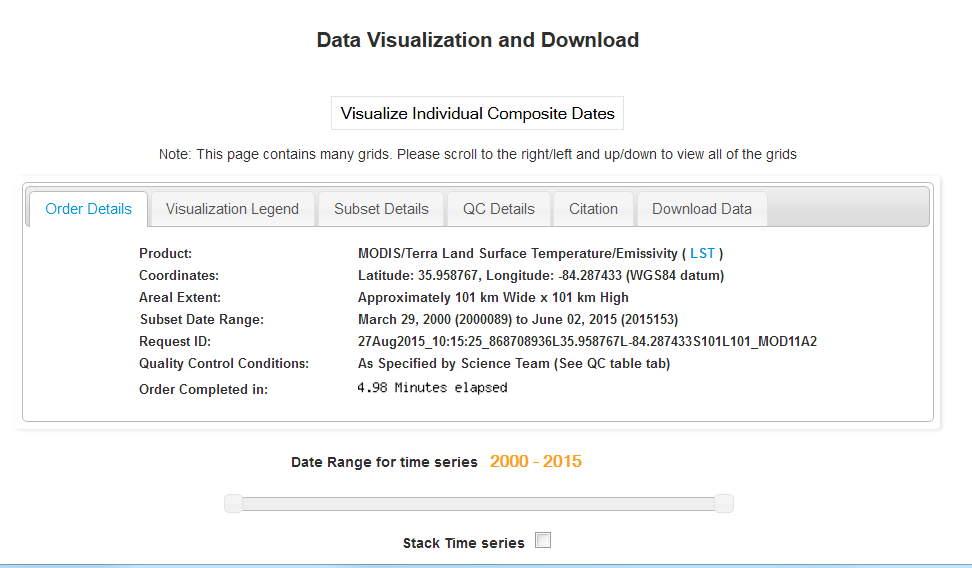
Figure 7. Visualization and download information provided after clicking on the link provided in the email in figure 6. There are also tabs provided to access citation information, subset and QC details.
To visualize a stacked time series check the 'Stack time series' box. Stacked and Default time series plots are interactive, with zoom, and slider-bar scrolling.
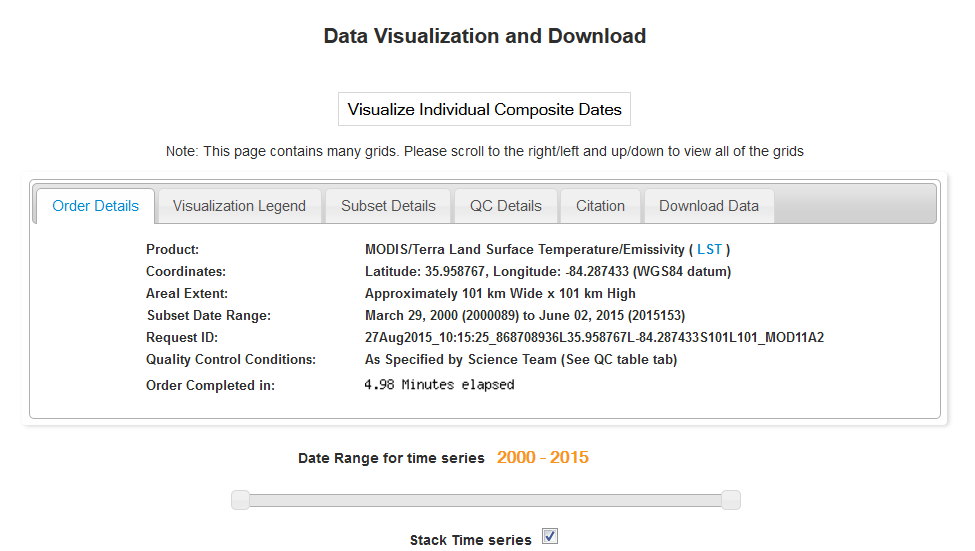
Figure 8. Time series box maybe checked at bottom of page.
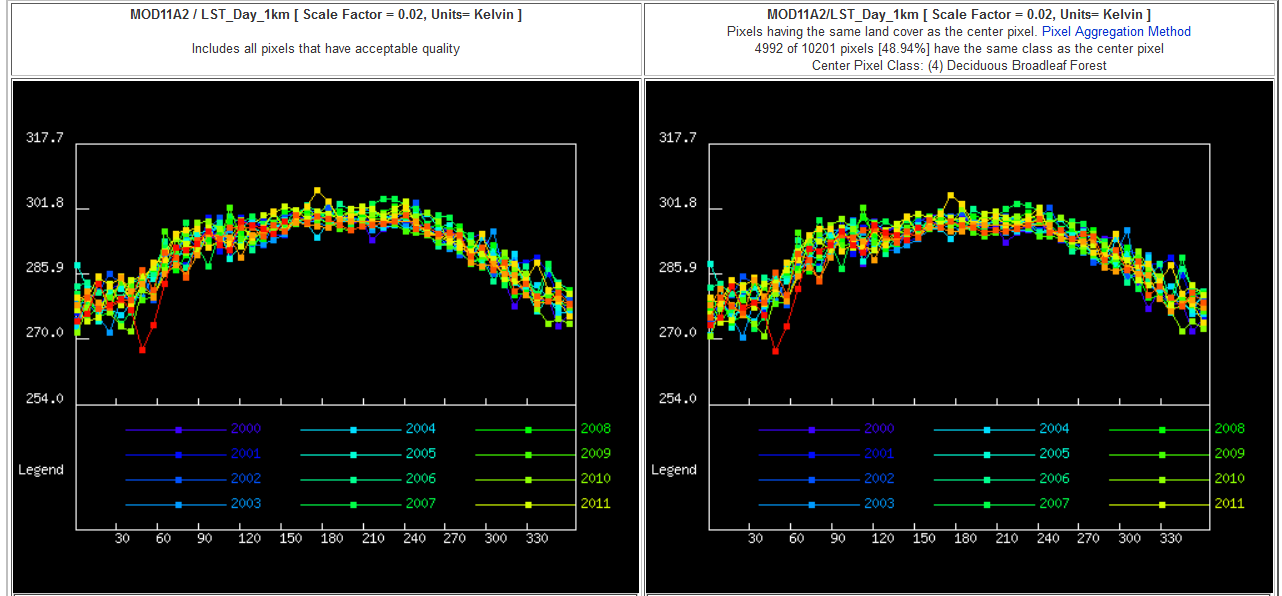
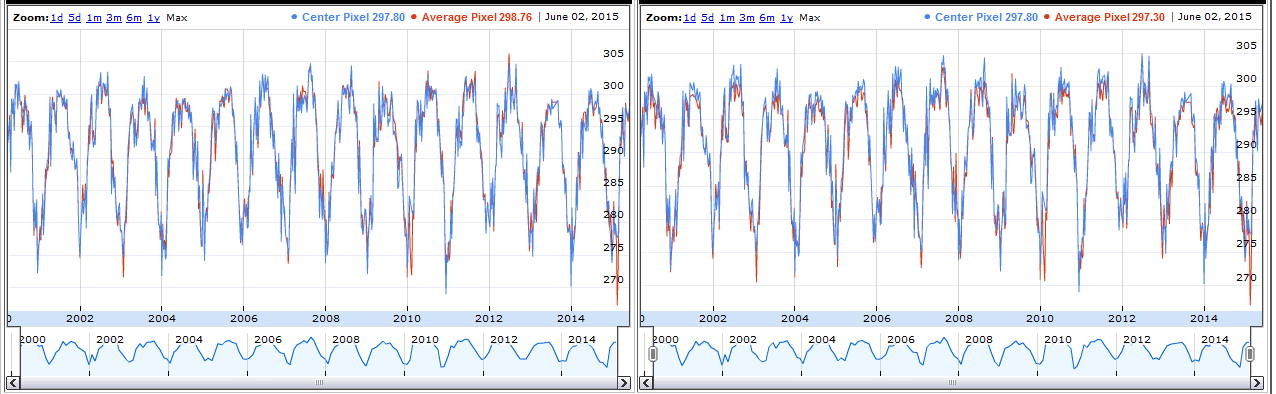
Figure 9. Illustration of time series data with stacked time series and zoom option and slider bar.
Each order displays the MODIS Land Cover Classification, Phenology, and R plots for the order accessible in tabs:
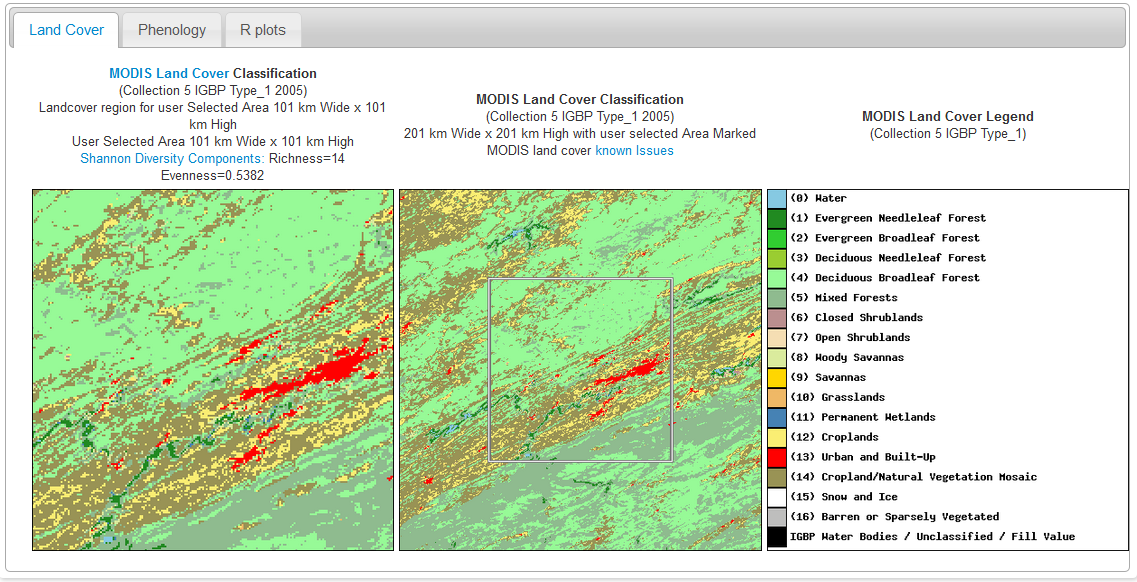
Figure 10. IGBP Type 1 Land Cover with legend.
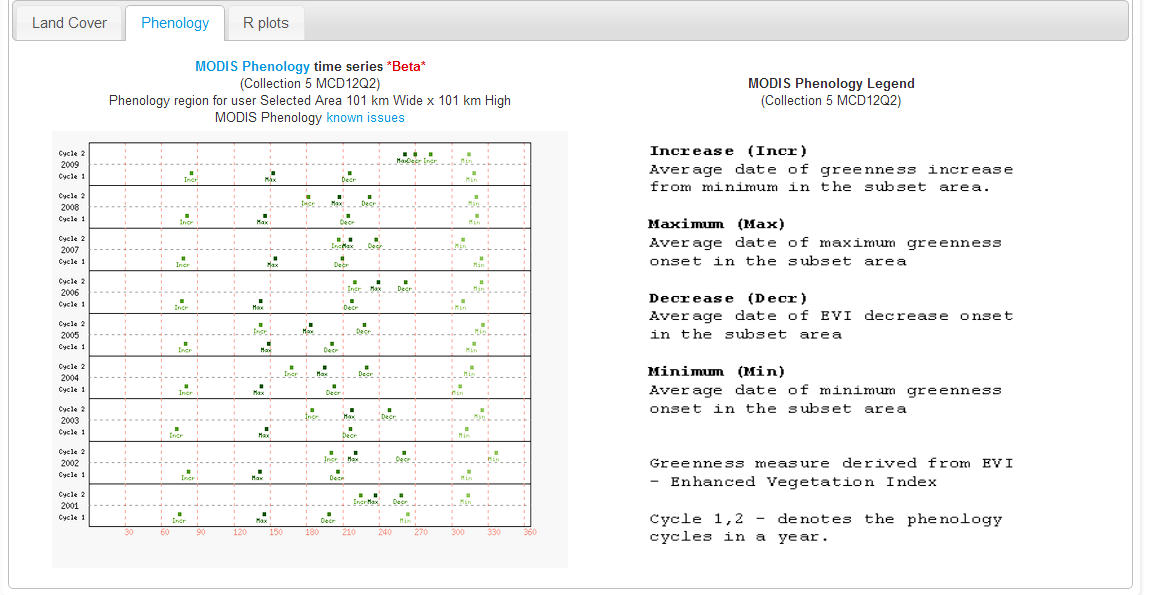
Figure 11. MODIS phenology time series with legend.
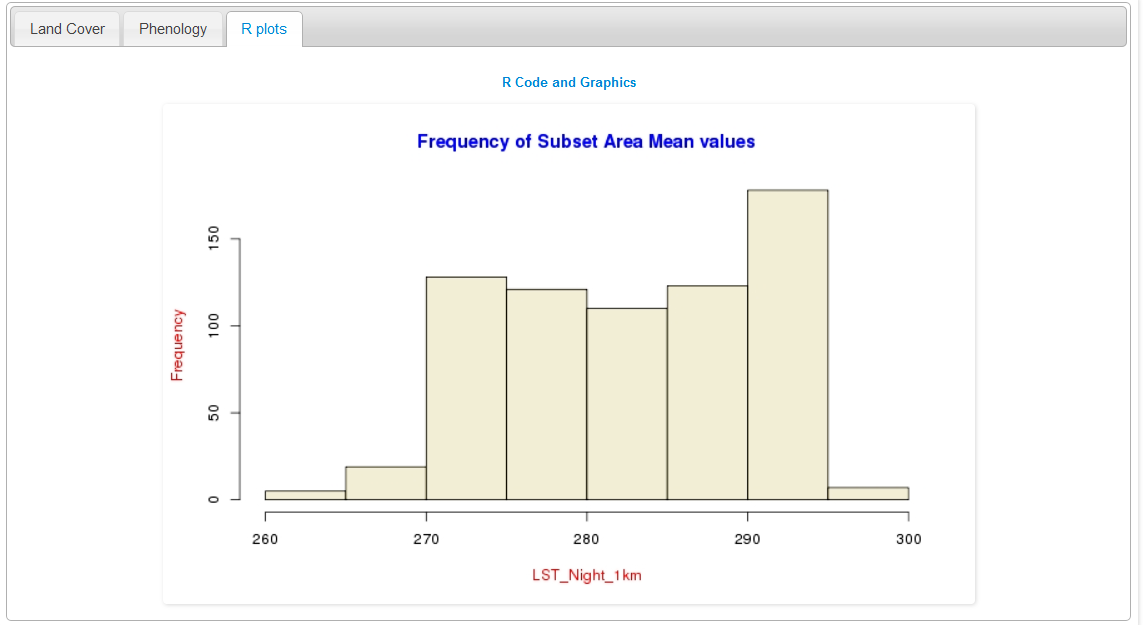
Figure 12. R plots.
Additional Resources
Classroom exercises are maintained on the MODIS Land Product Subsets page. The exercises are designed to help understand the basic concepts of remote sensing as well as the use of the MODIS data subsetting and visulization tools provided by the ORNL DAAC.
6. Data Access:
These data are available through the Oak Ridge National Laboratory (ORNL) Distributed Active Archive Center (DAAC).
MODIS global subsetting and visualization tool
Contact for Data Center Access Information:
E-mail: uso@daac.ornl.gov
Telephone: +1 (865) 241-3952
7. References:
S.K. Santhana Vannan, R.B. Cook, S.K. Holladay, L.M. Olsen, U. Dadi, B.E. Wilson. A Web-Based Subsetting Service for Regional Scale MODIS Land Products (2010). IEEE JSTARS, 2(4): 319–328