Summary:
The Peace-Athabasca Delta (PAD) is a hydrologically complex and ecologically diverse freshwater delta formed by the confluence of the Peace, Athabasca, and Birch Rivers near the western end of Lake Athabasca, Alberta, Canada. The three intersecting river deltas cover ~5,200 km2, making the PAD one of the world’s largest freshwater deltas. It has been named a United Nations Educational, Scientific, and Cultural Organization (UNESCO) World Heritage site and a Ramsar Convention Wetland of International Importance because of its biological significance and role as the largest alluvial-wetland habitat in the region. A large portion of the delta (~80%) is protected within Canada’s Wood Buffalo National Park.
This data set includes 3 comma-delimited ASCII files: one containing water quality data and site characteristics from June and July 2010, a second containing water quality data and site characteristics for June and July 2011, and a third containing spectral reflectance of the water surface for 2011. The 2010 data file has measurements from 62 unique sites, the majority of which were revisited in 2011. Both of the 2011 data files have measurements from 99 unique sites visited 1-4 times.
Data were originally collected 1) to study the spatial transferability of models that relate suspended sediment concentration to remotely sensed water surface reflectance, and 2) to further understand changes in hydrologic recharge in the Peace-Athabasca Delta.
This data set compliments another data set of surface water elevation and quality collected in the PAD during the summers of 2006 and 2007. The “Surface Water Elevation and Quality, Peace-Athabasca Delta, Canada, 2006-2007” data are archived and accessible at the Oak Ridge National Laboratory Distributed Active Archive Center (Pavelsky and Smith, 2009) and contain some of the same measurements in the same locations provided here.
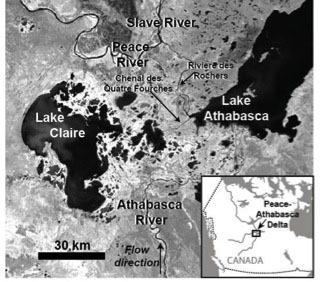
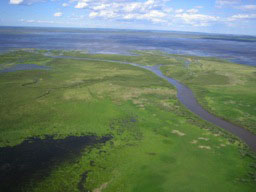
Figures 1. and 2. The Peace-Athabasca Delta (PAD) is a large boreal wetland located in northeastern Alberta, Canada at the confluence of the Peace and Athabasca Rivers with Lake Athabasca.
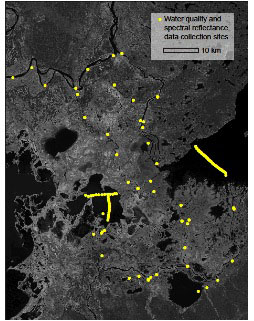
Figure 3. Map of the central PAD showing locations for water quality and reflectance data collection in 2011. Latitude and longitude for the sites are included in the data files.
Data Citation:
Cite this data set as follows:
Long, C.M. and T.M. Pavelsky. 2012.Water Quality and Spectral Reflectance, Peace-Athabasca Delta, Canada, 2010 - 2011. Data set. Available online [http://daac.ornl.gov] from Oak Ridge National Laboratory Distributed Active Archive Center, Oak Ridge, Tennessee, U.S.A. http://dx.doi.org/10.3334/ORNLDAAC/1133
Table of Contents:
- 1 Data Set Overview
- 2 Data Characteristics
- 3 Applications and Derivation
- 4 Quality Assessment
- 5 Acquisition Materials and Methods
- 6 Data Access
- 7 References
1. Data Set Overview:
The primary investigators were Long, C.M. and Pavelsky, T.M. Additional assistance in data collection was provided by Z. Miller, L. Benninger, and R. Grandjambe.
The Peace-Athabasca Delta (PAD) is a hydrologically complex and ecologically diverse freshwater delta formed by the confluence of the Peace, Athabasca,
and Birch Rivers near the western end of Lake Athabasca.
This data set includes 3 comma-delimited ASCII files: one containing water quality data and site characteristics from June and July 2010, a second containing water quality data and site characteristics for June and July 2011, and a third containing spectral reflectance of the water surface for 2011. The 2010 data file has measurements from 62 unique sites, the majority of which were
revisited in 2011. Both of the 2011 data files have measurements from 99 unique sites visited 1-4 times.
Acknowledgement:
This work was funded by student research grants from the UNC Department of Geological Sciences Martin Fund and the Geological Society of America (Grant #9536-11).
2. Data Characteristics:
1. 2010 Measurement Sites and Water Quality Parameters
Data file: pad_water_quality_2010.csv
This data set contains 177 in-situ measurements at 99 unique sites of 8 different variables: suspended sediment concentration (mg/L), Secchi disc depth (cm), temperature (°C), color dissolved organic matter concentration (mg/L), turbidity (NTU), chlorophyll content (mg/L), and specific conductivity (mS/cm). Water surface velocity (m/s) was measured at most non-lake locations and is included in 99 of the 177 records. Water depth (m) was measured at 144 locations.
Sites were visited between 1 and 11 times; there are 62 unique collection sites.
Missing data are indicated by -9999.
| Column Heading | Units | Description |
|---|---|---|
| Site_Name | Local name for the site sampled | |
| Date | YYYYMMDD | Date of acquisition |
| Local Time | hh:mm | Time of acquisition in local time (GMT-7) daylight time |
| Latitude | Decimal degrees | Coordinates obtained using a hand held Garmin Oregon 450t GPS, WGS84 Datum |
| Longitude | Decimal degrees | Coordinates obtained using a hand held Garmin Oregon 450t GPS, WGS84 Datum |
| Temperature | Deg C | Mean water temperature in degrees C at 1 m depth (in areas where depth > 1 m) over a 3 minute period. Measurements were obtained using a Eureka Manta® multiprobe. |
| SpCond | uS/cm | Mean specific conductivity in microSiemens per centimeter (uS/cm) at ~1m depth (in areas where depth >1m) over a 3 minute period. Measurements were obtained using a Eureka Manta ® Multiprobe |
| Turbidity | NTU | Mean Optical Turbidity in Nephelometric Turbidity Units (NTU) at 1 m depth (in areas where depth > 1 m) over at least a 3 minute period. Measurements were obtained using a Eureka Manta® multiprobe. |
| Chl | ug/L | Mean chlorophyll concentration at ~1m depth (in areas where depth >1m) over a 3 minute period. Measurements were obtained using a Eureka Manta ® Multiprobe |
| CDOM | ug/L | Mean color dissolved organic matter concentration at ~1m depth (in areas where depth >1m) over a 3 minute period. Measurements were obtained using a Eureka Manta ® Multiprobe |
| SSC | cm | 275 mL water samples for Suspended Sediment Concentration (SSC) were collected from the top ~15 cm of the water column. Water samples were filtered onto pre-weighed 1.2 mm Millipore cellulose filters using a vacuum filtration system. After filtration, the filters were dried in an oven at 100° C for 30 minutes and then reweighed on a high precision balance to determine the weight of total suspended matter. This weight divided by the sample volume yielded the suspended sediment concentration (mg/L). |
| Secchi_Disc_Depth | cm | Mean of two secchi disc optical depth measurements in cm, one with the disc descending in the water column, the other with the disc ascending |
| SF_Velocity | m/s | SF_Velocity m/s Surface flow velocity (SF_Velocity) was measured using a small drogue, a stopwatch, and a hand held GPS. The drogue was dropped from a stationary boat into the water and the time and a GPS point were recorded. The drogue was allowed to drift with the current for ~3-6 minutes, and when retrieved, the time in the water and a second GPS point were recorded. Velocity was determined by dividing the straight line distance between the points by the measured time. |
| Water_Depth | m | River or lake depth in m at the sampling location measured using one of two method s: (1) a boat -mounted sonar -based depth sensor attached to a GPS or (2) direct measurement of the length of anchor rope submerged when the anchor was located directly below the boat. All depth measurements should be viewed as approximations. |
Example Data Records
| Site_Name,Day of Year,Time,Latitude,Longitude,Temperature,SpCond,Turbidity,Chl,CDOM,SSC,Secchi disc depth,Velocity,Water_Depth Ath Abv Cec,20100621,12:51,58.44226, -111.37828,20.46254,252.53731,72.71791,14.83716,321.33731,102.14286,25,1.03,3.1,,,,,,,,,,,,,,,,,,,, Ath Abv Cec,20100621,13:19,58.44348, -111.38070,20.49322,252.17288,72.81017,15.80305,320.33051,115.71429,25,0.95,2.8,,,,,,,,,,,,,,,,,,,, Ath Abv FC,20100621,14:12,58.45258, -111.08581,20.50817,252.52500,74.20833,15.31667,319.07333,92.50000,35,0.78,4.4,,,,,,,,,,,,,,,,,,,, ... QF TM,20100706,11:18,58.73651,-111.41180,17.44254,363.49701,130.32239,9.56284,218.64328, -99.99,15,0.74,6.2,,,,,,,,,,,,,,,,,,,, QF Middle,20100706,11:37,58.78519, -111.45411,18.44148,371.08889,172.76852,10.61463,198.39074,122.50000,12,0.80,4.4,,,,,,,,,,,,,,,,,,,, QF BM,20100706,12:00,58.83385, -111.60782,18.41518,347.75893,140.56250,12.67857,206.29286,166.07143,17,0.77,2.6,,,,,,,,,,,,,,,,,,,, |
2. 2011 Measurement Sites and Water Quality Parameters
Data file: pad_water_quality_2011.csv
This data set contains 177 in-situ measurements at 99 unique sites of 8 different variables: suspended sediment concentration (mg/L), Secchi disc depth (cm), temperature (°C), color dissolved organic matter concentration (mg/L), turbidity (NTU), chlorophyll content (mg/L), and specific conductivity (mS/cm). Water surface velocity (m/s) was also measured at most non-lake locations and is included in 66 of the 177 records.
Sites were visited between 1 and 4 times; there are 99 unique collection sites (Figure 2).
Missing data are indicated by -9999.
| Column Heading | Units | Description |
|---|---|---|
| Site_Name | Local name for the site sampled | |
| Date | YYYYMMDD | Date of acquisition |
| Local Time | hh:mm | Time of acquisition in local time (GMT-7) daylight time |
| Latitude | Decimal degrees | Coordinates obtained using a hand held Garmin Oregon 450t GPS, WGS84 Datum |
| Longitude | Decimal degrees | Coordinates obtained using a hand held Garmin Oregon 450t GPS, WGS84 Datum |
| Temperature | Deg C | Mean water temperature in degrees C at 1 m depth (in areas where depth > 1 m) over a 3 minute period. Measurements were obtained using a Eureka Manta® multiprobe. |
| SpCond | uS/cm | Mean specific conductivity in microSiemens per centimeter (uS/cm) at ~1m depth (in areas where depth >1m) over a 3 minute period. Measurements were obtained using a Eureka Manta ® Multiprobe |
| Turbidity | NTU | Mean Optical Turbidity in Nephelometric Turbidity Units (NTU) at 1 m depth (in areas where depth > 1 m) over at least a 3 minute period. Measurements were obtained using a Eureka Manta® multiprobe. |
| Chl | ug/L | Mean chlorophyll concentration at ~1m depth (in areas where depth >1m) over a 3 minute period. Measurements were obtained using a Eureka Manta ® Multiprobe |
| CDOM | ug/L | Mean color dissolved organic matter concentration at ~1m depth (in areas where depth >1m) over a 3 minute period. Measurements were obtained using a Eureka Manta ® Multiprobe |
| SSC | cm | 275 mL water samples for Suspended Sediment Concentration (SSC) were collected from the top ~15 cm of the water column. Water samples were filtered onto pre-weighed 1.2 mm Millipore cellulose filters using a vacuum filtration system. After filtration, the filters were dried in an oven at 100° C for 30 minutes and then reweighed on a high precision balance to determine the weight of total suspended matter. This weight divided by the sample volume yielded the suspended sediment concentration (mg/L). |
| Secchi_Disc_Depth | cm | Mean of two secchi disc optical depth measurements in cm, one with the disc descending in the water column, the other with the disc ascending |
| SF_Velocity | m/s | SF_Velocity m/s Surface flow velocity (SF_Velocity) was measured using a small drogue, a stopwatch, and a hand held GPS. The drogue was dropped from a stationary boat into the water and the time and a GPS point were recorded. The drogue was allowed to drift with the current for ~3-6 minutes, and when retrieved, the time in the water and a second GPS point were recorded. Velocity was determined by dividing the straight line distance between the points by the measured time. |
Example Data Records
| Site_Name,Day of
Year,Time,Latitude,Longitude,Temperature,SpCond,Turbidity,Chl,CDOM,SSC,Secchi
disc depth,Velocity Chillowe's Cr,20110624,10:15,58.82257, -111.29728,20.46925926,231.6888889,18.81111111,,295.1333333,12,48,, Rochers Abv Chillowe's,20110624,10:49,58.80523, -111.285948,19.0206,194.222,137.978,9.0772,171.126,160.3571429,21,, Dog Camp Island, 20110624,13:56,58.65019, -111.30891,18.69754717,248.1150943,179.3018868,8.86490566,196.0924528,147.1428571,18,, ... L. Mamawi transect 9,20110706,13:12,58.634508, -111.456517,17.77815789,228.0789474,202.7736842,7.066315789,314.7473684,92.5,12,-99.99 L. Mamawi transect 10,20110706,13:19,58.634999, -111.444143,18.43578947,221.3842105,214.5184211,7.505789474,300.9210526,100.3571429,13,-99.99 L. Mamawi transect 12,20110706,13:36,58.635846, -111.42284,19.652,219.528,150.486,6.4208,342.056,102.5,15,-99.99 |
3. Measurement Sites and Spectral Reflectance from the Water Surface
Data file: pad_water_reflectance_2011.csv
This data set contains 177 in-situ measurements at 99 unique sites of spectral reflectance from the water surface measured at 1 nm intervals between 350 nm and 1025 nm. Each row represents the reflectance for one wavelength at each of the 177 sites.
Each column represents one site and contains the reflectance at 1 nm intervals from 350 to 1025.
Note that the collection points are the same as those in the 2011 water quality data set.
Missing data are indicated by -9999.
| Row Number | Row Heading | Units | Description |
|---|---|---|---|
| 1 | Site_Name | Local name for site sampled | |
| 2 | Date | YYYYMMDD | Date of acquisition |
| 3 | Time | hh:mm | Time of acquisition |
| 4-679 | 350, 351, 352… 1025 | These rows contain the reflectance at the given wavelength for each of the 177 locations |
Example Data Records
|
Site_Name,Date,Time,10:15,10:49,11:20,13:56,14:09,…. 350,0.023520052,0.025373763,0.02307774,0.303477921,0.046440164, …. 351,0.023671121,0.025989064,0.022632214,0.304745665,0.046423155, …. 352,0.023740484,0.02531411,0.023061875,0.306685921,0.047184005, …. … 1021,0.005639016,0.007755434,0.008466306,0.374401901,0.02111196… 1022,0.005265002,0.006747021,0.009532614,0.373767816,0.020544126… 1023,0.005156922,0.005259731,0.008315931,0.373469142,0.020713976… …. |
Site boundaries: (All latitude and longitude given in decimal degrees)
| Site (Region) | Westernmost Longitude | Easternmost Longitude | Northernmost Latitude | Southernmost Latitude | Geodetic Datum |
|---|---|---|---|---|---|
| Peace-Athabasca Delta, Canada | -111.92768 | -110.83898 | 58.99303 | 58.388069 | WGS 84 |
Time period:
- The data set covers the period 2010/06/21 to 2011/07/06.
3. Data Application and Derivation:
These data were originally collected for two main purposes. First, the data were used as a validation data set to test a compilation of published, site-specific models, which relate SSC to spectral reflectance measurements. Second, the data were used to further understanding of hydrologic recharge in the Peace-Athabasca Delta and understand how decreases in the input of river water may affect the small lakes throughout the delta.
4. Quality Assessment:
This data set can be considered final and has been checked for consistency within and across individual variables; however, a quantitative assessment of the data’s uncertainty has not been conducted.
5. Data Acquisition Materials and Methods:
In June and July of 2010 and 2011, fieldwork was conducted on the rivers, distributaries, and lakes in Wood Buffalo National Park and other nearby areas of the Peace-Athabasca Delta (PAD). We collected in-situ measurements of temperature (°C), color dissolved organic matter concentration (mg/L), turbidity (NTU), chlorophyll content (mg/L), and specific conductivity (mS/cm) using a Eureka Manta Multiprobe. Secchi disk depth (cm) and suspended sediment concentration (mg/L) were also measured. A total of 177 data points from 62 unique sites were collected in 2010, and 177 data points from 99 unique sites were collected in 2011. Velocity (m/s) was measured at most non-lake locations (99 total in 2010, 67 total in 2011), and water depth (m) was measured in 2010 for most points (144 total).
Multiprobe measurements were collected at two-second intervals for at least three minutes and averaged to obtain one value for each variable per site. Surface flow velocity was measured using a stopwatch, a handheld GPS, and a small drogue (following Pavelsky and Smith, 2009) (Figure 4). Suspended sediment concentrations were quantified using 275 mL water samples collected from the top ~15 cm of the water column. Water samples were filtered onto pre-weighed 1.2 mm Millipore cellulose filters using a vacuum filtration system (Figure 5). After filtration, the filters were dried in an oven at 100° C for 30 minutes and then reweighed on a high precision balance to determine the weight of total suspended matter. This weight divided by the sample volume yielded the suspended sediment concentration (mg/L).
Spectral reflectance from the water surface was measured at 1 nm intervals between 350 and 1025 nm at each of the 177 field sites using an ASD FieldSpec® 3 Portable Spectrometer with an attached OL 731 Smart Detector for solar irradiance measurements. A white reference measurement was obtained from a Spectralon® white standard at each location prior to collection of reflectance spectra to account for changes in lighting conditions between sites (Figure 6). Three reflectance measurements were collected at each location and then averaged to obtain one reflectance value per wavelength per site.
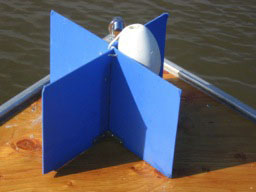
Figure 4. Drogue used to measure surface flow velocity.
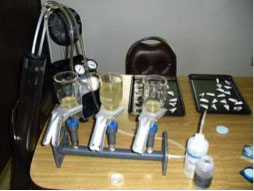
Figure 5. Vacuum filtration system used to quantify suspended sediment concentration in water samples.
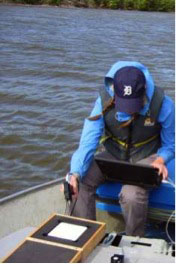
Figure 6. Spectrometer being used in the field to collect a white reference measurement.
6. Data Access:
This data is available through the Oak Ridge National Laboratory (ORNL) Distributed Active Archive Center (DAAC).
Data Archive Center:
Contact for Data Center Access Information:
E-mail: uso@daac.ornl.gov
Telephone: +1 (865) 241-3952
References
Long, C.M. and T.M. Pavelsky (2013), Remote sensing of suspended sediment concentration and hydrologic connectivity in a complex wetland environment, Remote Sensing of Environment, 129, 197-209, http://dx.doi.org/10.1016/j.rse.2012.10.019.
Pavelsky, T. M. and L. C. Smith (2009), Remote sensing of suspended sediment concentration, flow velocity, and lake recharge in the Peace-Athabasca Delta,
Canada, Water Resour. Res., 45, W11417, doi:10.1029/2008WR007424.
Pavelsky, T.M., and L.C. Smith. 2009. Surface Water Elevation and Quality, Peace-Athabasca Delta, Canada, 2006-2007. Data set. Available on-line [http://daac.ornl.gov] from Oak Ridge National Laboratory Distributed Active Archive Center, Oak Ridge,
Tennessee, U.S.A. http://dx.doi.org/10.3334/ORNLDAAC/935