Documentation Revision Date: 2025-01-24
Dataset Version: 2
Summary
There are 74,860 data files in HDF5 format (.h5) with this dataset.
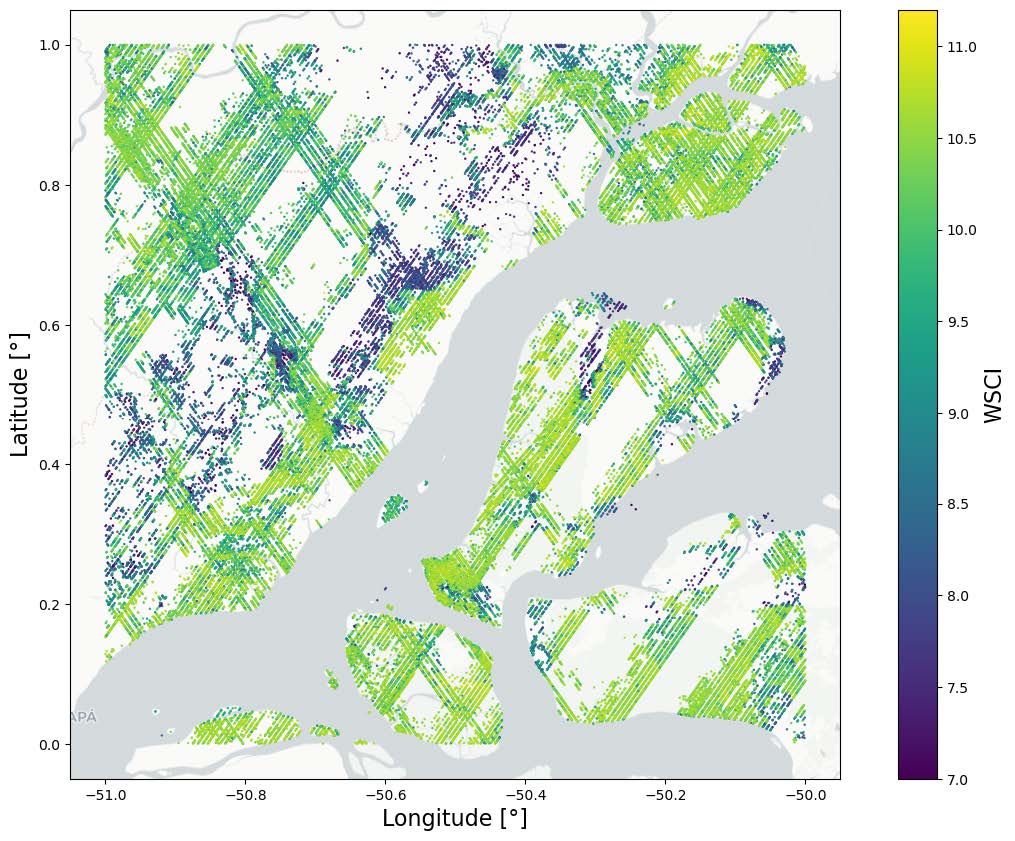
Figure 1. Example subset of the Waveform Structural Complexity Index (WSCI) predictions from the GEDI Level-4C footprint product over the Eastern Amazon.
Citation
De Conto, T., J. Armston, and R.O. Dubayah. 2024. GEDI L4C Footprint Level Waveform Structural Complexity Index, Version 2. ORNL DAAC, Oak Ridge, Tennessee, USA. https://doi.org/10.3334/ORNLDAAC/2338
Table of Contents
- Dataset Overview
- Data Characteristics
- Application and Derivation
- Quality Assessment
- Data Acquisition, Materials, and Methods
- Data Access
- References
- Dataset Revisions
Dataset Overview
This dataset contains GEDI Level 4C (L4C) predictions of the WSCI and estimates of prediction intervals at 95% confidence within each sampled geolocated laser footprint. The footprints are located within the global latitude band observed by the ISS, nominally 51.6 degrees N and S and reported for the period 2019-04-17 to 2023-03-16. The GEDI instrument consists of three lasers producing a total of eight beam ground transects, which instantaneously sample eight ~25 m footprints spaced approximately every 60 m along-track. The GEDI beam transects are spaced approximately 600 m apart on the Earth's surface in the cross-track direction, for an across-track width of ~4.2 km. Footprint WSCI estimates were derived from machine learning models that relate GEDI Level 2A (L2A) relative height (RH) metrics to measures of 3D structural complexity from GEDI intersected Airborne Laser Scanning (ALS) plots. The training dataset consisted of more than 800,000 collocated GEDI/ALS footprints, used to train four global WSCI models representing different PFTs (i.e., deciduous broadleaf trees, evergreen broadleaf trees, evergreen needleleaf trees and the combination of grasslands, shrubs, and woodlands).
Reported with the WSCI estimates for each of the eight beams are the associated uncertainty metrics, quality flags and other information about the GEDI L2A waveform for this selected algorithm setting group. Also provided are footprint geolocation variables and land cover input data including PFTs and the land cover type identifiers. Additional model outputs include the WSCI predictions for each of the six GEDI L2A algorithm setting groups with associated prediction intervals for each GEDI L2A algorithm setting group. Providing these ancillary data products will allow users to evaluate and select alternative algorithm setting groups.
Project: Global Ecosystem Dynamics Investigation (GEDI)
The Global Ecosystem Dynamics Investigation (GEDI) produces high resolution laser ranging observations of the 3D structure of the Earth. GEDI’s precise measurements of forest canopy height, canopy vertical structure, and surface elevation greatly advance our ability to characterize important carbon and water cycling processes, biodiversity, and habitat. GEDI was funded as a NASA Earth Ventures Instrument (EVI) mission. It was launched to the International Space Station in December 2018 and completed initial orbit checkout in April 2019.
Related Publication
Dubayah, R., J.B. Blair, S. Goetz, L. Fatoyinbo, M. Hansen, S. Healey, M. Hofton, G. Hurtt, J. Kellner, S. Luthcke, J. Armston, H. Tang, L. Duncanson, S. Hancock, P. Jantz, S. Marselis, P.L. Patterson, W. Qi, and C. Silva. 2020. The Global Ecosystem Dynamics Investigation: High-resolution laser ranging of the Earth’s forests and topography. Science of Remote Sensing 1:100002. https://doi.org/10.1016/j.srs.2020.100002
de Conto, T., Armston, J. & Dubayah, R. Characterizing the structural complexity of the Earth’s forests with spaceborne lidar. Nat Commun 15, 8116 (2024). https://doi.org/10.1038/s41467-024-52468-2
Related Datasets
Level 1B, Level 2A, and Level 2B data from GEDI are available from the Land Processes Distributed Active Archive Center at https://lpdaac.usgs.gov/.
Acknowledgements
This work was funded with a NASA Earth Ventures Instrument (EVI) supporting the GEDI mission (contract NNL15AA03C) , and FINESST, grant number NNH21ZDA001N.
Data Characteristics
Spatial Coverage: Global within a latitude extent of -53 to +54 degrees
Spatial Resolution: ~25 m footprints in diameter
Temporal Coverage: 2019-04-17 to 2023-03-16
Temporal Resolution: One-time estimates
Study Area: Latitude and longitude are given in decimal degrees
| Site | Westernmost Longitude | Easternmost Longitude | Northernmost Latitude | Southernmost Latitude |
|---|---|---|---|---|
| Global | -180 | 180 | 54 | -53 |
Data File Information
There are 74,860 data files in HDF5 format (.h5), and one companion file with this dataset. The companion file, GEDI_L4C_WSCI_Data_Dictionary.pdf, provides a data dictionary for the variables in the data files. This data dictionary is also included in this guide document.
Data file naming convention:
The files are named GEDI04_C_YYYYDDDHHMMSS_O[orbit_number]_[granule_number]_T[track_number]_[PPDS_type]_ [release_number]_[production_version]_V[version_number].h5 (e.g., GEDI04_C_2019349001415_O05699_04_T03266_02_001_01_V002.h5), where:
GEDI04_C = product short name representing GEDI Level 4C data,
YYYYDDDHHMMSS = date and time of acquisition in Julian day of year, hours, minutes, and seconds format,
[orbit_number] = orbit number,
[granule_number] = sub-orbit granule (or file) number,
[track_number] = track number,
[PPDS_type] = positioning and pointing determination system (PPDS) type (00 is "predict", 01 is "rapid", 02 and higher is "final"),
[release_number] = release number (001), representing the SOC SDS (software) release used to generate this L4C dataset,
[production_version] = granule production version , e.g., a particular data granule (or file) may have been regenerated multiple times,
[version_number] = L4C dataset production version (002), corresponding to the ORNL DAAC's dataset version number, and
.h5 = file extension, HDF5 format.
Table 1. Data Dictionary
| Dimension Variable | Description |
| MT | Number of shots |
| Group:/ | ||||
| short_name | (Attribute) | GEDI04_C | ||
| Group:/METADATA/Dataset Identification | ||||
| abstract | (Attribute) | The GEDI04_C standard data product contains predictions of the Waveform Structural Complexity Index (WSCI) within each laser footprint | ||
| characterSet | (Attribute) | utf8 | ||
| creationDate | (Attribute) | File creation date | ||
| credit | (Attribute) | The software that generates the WSCI product was implemented at the Department of Geographical Sciences at the University of Maryland (UMD) | ||
| fileName | (Attribute) | Original file name | ||
| language | (Attribute) | Eng | ||
| Originator Organization Name | (Attribute) | GEDI Science Data Processing System and University of Maryland | ||
| PGEVersion | (Attribute) | Product generating executive SDPS release ID | ||
| purpose | (Attribute) | The purpose of the WSCI dataset is to provide an estimate of forest structural complexity, similarly to what is measured by airborne LiDAR in the 3D space, using GEDI waveforms | ||
| shortName | (Attribute) | GEDI04_C | ||
| spatialRepresentationType | (Attribute) | Along-track | ||
| status | (Attribute) | On Going | ||
| topicCategory | (Attribute) | Geoscientific Information | ||
| uuid | (Attribute) | Universally unique identifier (UUID) for this file | ||
| VersionID | (Attribute) | SDPS DAAC release ID | ||
| gedi_wsci_githash | (Attribute) | Git commit hash of the software used to create the WSCI file | ||
| Group:/BEAMXXXX | ||||
| Label | Datatype (Dimensions) |
long_name | Units source |
Description |
| algorithm_run_flag | UINT8 MT |
Algorithm run flag | - | The WSCI algorithm is run if this flag is set to 1. This flag selects data which have sufficient waveform fidelity for WSCI estimation. |
| beam | UINT16 MT |
Beam | - L2A |
Beam identifier |
| channel | UINT8 MT |
Channel | - L2A |
Channel identifier |
| degrade_flag | UINT8 MT |
Degrade flag | - L2A |
Flag indicating degraded state of pointing and/or positioning information |
| delta_time | FLOAT64 MT |
Delta time | s L2A |
Time delta since Jan 1 00:00 2018. |
| elev_lowestmode | FLOAT32 MT |
Elevation of the lowest mode | m L2A |
Elevation of center of lowest mode relative to reference ellipsoid |
| elev_outlier_flag | UINT8 MT |
Elevation outlier flag | - L4B |
Flag indicating shot is from a section of an orbit with L2A canopy elevation metrics classified as large outliers relative to reference data |
| fhd_normal | FLOAT64 MT |
Foliage Height Diversity | m L2B |
Foliage height diversity index calculated by vertical foliage profile normalized by total plant area index |
| l2_quality_flag | UINT8 MT |
L2A quality flag | - L2A |
Flag identifying the most useful L2A data for WSCI predictions |
| lat_lowestmode | FLOAT64 MT |
Latitude of the lowest mode | degrees L2A |
Latitude of center of lowest mode |
| lon_lowestmode | FLOAT64 MT |
Longitude of the lowest mode | degrees L2A |
Longitude of center of lowest mode |
| master_frac | FLOAT64 MT |
Fraction component of shot time | s L2A |
Master time, fractional part. master_int+master_frac is equivalent to /BEAMXXXX/delta_time. |
| master_int | UINT32 MT |
Integer component of shot time | s L2A |
Master time, integer part. Seconds since master_time_epoch. master_int+master_frac is equivalent to /BEAMXXXX/delta_time. |
| selected_algorithm | UINT8 MT |
Selected algorithm setting group | - L2A |
Selected algorithm setting group |
| sensitivity | FLOAT32 MT |
Beam sensitivity | - L2A |
Maximum canopy cover that can be penetrated considering the SNR of the waveform |
| shot_number | UINT64 MT |
Shot number | - L2A |
Shot number |
| solar_elevation | FLOAT32 MT |
Solar elevation | degrees L2A |
Solar elevation angle |
| surface_flag | UINT8 MT |
Surface flag | - L2A |
Indicates elev_lowestmode is within 300m of Digital Elevation Model (DEM) or Mean Sea Surface (MSS) elevation |
| wsci | FLOAT32 MT |
Waveform Structural Complexity Index | - | Predicted 3D canopy entropy from the corresponding Plant Functional Type (PFT) model |
| wsci_pi_lower | FLOAT32 MT |
Waveform Structural Complexity Index lower prediction interval | - | Lower prediction interval at 95% confidence |
| wsci_pi_upper | FLOAT32 MT |
Waveform Structural Complexity Index upper prediction interval | - | Upper prediction interval at 95% confidence |
| wsci_quality_flag | UINT8 MT |
WSCI quality flag | - | Flag simplifying selection of most useful WSCI predictions |
| wsci_xy | FLOAT32 MT |
Horizontal Structural Complexity | - | Predicted WSCI horizontal term over the XY plane within the footprint |
| wsci_xy_pi_lower | FLOAT32 MT |
Horizontal Structural Complexity lower prediction interval | - | Lower prediction interval at 95% confidence |
| wsci_xy_pi_upper | FLOAT32 MT |
Horizontal Structural Complexity upper prediction interval | - | Upper prediction interval at 95% confidence |
| wsci_z | FLOAT32 MT |
Vertical Structural Complexity | - | Predicted WSCI vertical term along the Z axis within the footprint |
| wsci_z_pi_lower | FLOAT32 MT |
Vertical Structural Complexity lower prediction interval | - | Lower prediction interval at 95% confidence |
| wsci_z_pi_upper | FLOAT32 MT |
Vertical Structural Complexity upper prediction interval | - | Upper prediction interval at 95% confidence |
| Group:/BEAMXXXX/geolocation | ||||
| Label | Datatype (Dimensions) |
long_name | Units source |
Description |
| elev_lowestmode_aN | FLOAT32 MT |
Elevation of the lowest mode | m L2A |
Elevation of center of lowest mode relative to reference ellipsoid |
| lat_lowestmode_aN | FLOAT64 MT |
Latitude of the lowest mode | degrees L2A |
Latitude of center of lowest mode |
| lon_lowestmode_aN | FLOAT64 MT |
Longitude of the lowest mode | degrees L2A |
Longitude of center of lowest mode |
| sensitivity_aN | FLOAT32 MT |
Beam sensitivity | - L2A |
Maximum canopy cover that can be penetrated considering the SNR of the waveform |
| shot_number | UINT64 MT |
Shot number | - L2A |
Shot number |
| stale_return_flag | UINT8 MT |
Stale return flag | - L2A |
Flag from digitizer indicating the real-time pulse detection algorithm did not detect a return signal above its detection threshold within the entire 10 km search window. The pulse location of the previous shot was used to select the telemetered waveform. |
| Group:/BEAMXXXX/land_cover_data | ||||
| Label | Datatype (Dimensions) |
long_name | Units source |
Description |
| landsat_treecover | FLOAT64 MT |
Landsat tree canopy cover | percent L2A |
Tree cover in the year 2010, defined as canopy closure for all vegetation taller than 5m in height (Hansen et al., 2013). Encoded as a percentage per output grid cell. |
| landsat_water_persistence | UINT8 MT |
25 m Landsat water persistence | percent L2A |
The percent UMD GLAD Landsat observations with classified surface water between 2018 and 2019. Values > 80 usually represent permanent water while values < 10 represent permanent land. |
| leaf_off_doy | INT16 | 1 km VIIRS leaf-off day-of-year | days L4A |
GEDI 1 km EASE 2.0 grid leaf-off start day-of-year derived from the NPP VIIRS Global Land Surface Phenology Product. |
| leaf_off_flag | UINT8 MT |
1 km VIIRS leaf-off flag | - L4A |
GEDI 1 km EASE 2.0 grid flag derived from leaf_off_doy, leaf_on_doy and pft_class, indicating if the observation was recorded during leaf-off conditions in deciduous needleleaf or broadleaf forests and woodlands. 1 = leaf-off and 0 = leaf-on. |
| leaf_on_cycle | UINT8 | 1 km VIIRS leaf-on cycle number | - L4A |
Flag that indicates the vegetation growing cycle for leaf-on observations. Values are 0 (leaf-off conditions), 1 (cycle 1) or 2 (cycle 2). |
| leaf_on_doy | INT16 | 1 km VIIRS leaf-on day-of-year | - L4A |
GEDI 1 km EASE 2.0 grid leaf-on start day-of-year derived from the NPP VIIRS Global Land Surface Phenology Product. |
| pft_class | UINT8 | 1 km MODIS Plant Functional Type class | - L2A |
GEDI 1 km EASE 2.0 grid Plant Functional Type (PFT) derived from the MODIS MCD12Q1v006 Product. Values follow the Land Cover Type 5 Classification scheme. |
| region_class | UINT8 MT |
1 km geographic region class | - L2A |
GEDI 1 km EASE 2.0 grid world continental regions (0: Water, 1: Europe, 2: North Asia, 3: Australasia, 4: Africa, 5: South Asia, 6: South America, 7: North America). |
| shot_number | UINT64 MT |
Shot number | - L2A |
Shot number |
| urban_focal_window_size | UINT8 MT |
Urban focal window size | pixels L4A |
The focal window size used to calculate urban_proportion. Values are 3 (3x3 pixel window size) or 5 (5x5 pixel window size). |
| urban_proportion | UINT8 MT |
25 m TDX urban percentage | percent L4A |
The percentage proportion of land area within a focal area surrounding each shot that is urban land cover. Urban land cover is derived from the DLR 12 m resolution TanDEM-X Global Urban Footprint Product. |
| worldcover_class | INT32 MT |
ESA landcover class | - | Land cover class from the European Space Agency WorldCover v200 product |
| Group:/BEAMXXXX/wsci_prediction | ||||
| Label | Datatype (Dimensions) |
long_name | Units source |
Description |
| algorithm_run_flag_aN | UINT8 MT |
Algorithm run flag | - | The algorithm is run if this flag is set to 1. This flag selects data which have sufficient waveform fidelity for WSCI estimation. |
| l2_quality_flag_aN | UINT8 MT |
Level 2 quality flag | - L2A |
Flag identifying the most useful L2A data for WSCI predictions |
| shot_number | UINT64 MT |
Shot number | - L2A |
Shot number |
| wsci_aN | FLOAT32 MT |
Waveform Structural Complexity Index | - | Waveform Structural Complexity Index |
| wsci_pi_lower_aN | FLOAT32 MT |
Waveform Structural Complexity Index lower prediction interval | - | Lower prediction interval at 95% confidence |
| wsci_pi_upper_aN | FLOAT32 MT |
Waveform Structural Complexity Index upper prediction interval | - | Upper prediction interval at 95% confidence |
| wsci_quality_flag_aN | UINT8 MT |
WSCI quality flag | - | Flag simplifying selection of most useful WSCI predictions |
| wsci_xy_aN | FLOAT32 MT |
Horizontal Structural Complexity | - | Horizontal Structural Complexity |
| wsci_xy_pi_lower_aN | FLOAT32 MT |
Horizontal Structural Complexity lower prediction interval | - | Lower prediction interval at 95% confidence |
| wsci_xy_pi_upper_aN | FLOAT32 MT |
Horizontal Structural Complexity upper prediction interval | - | Upper prediction interval at 95% confidence |
| wsci_z_aN | FLOAT32 MT |
Vertical Structural Complexity | - | Vertical Structural Complexity |
| wsci_z_pi_lower_aN | FLOAT32 MT |
Vertical Structural Complexity lower prediction interval | - | Lower prediction interval at 95% confidence |
| wsci_z_pi_upper_aN | FLOAT32 MT |
Vertical Structural Complexity upper prediction interval | - | Upper prediction interval at 95% confidence |
Application and Derivation
The WSCI is the first product aiming at describing 3D structural complexity consistently on a near-global scale. Recent studies mapping forest structural complexity from lidar were limited to sites where airborne or terrestrial laser scanning point clouds were available. To expand estimates of 3D complexity to a global scale we developed relationships between GEDI and over 800,000 collocated ALS point cloud samples across the globe where 3D complexity was measured. Those paired GEDI/ALS samples were used to develop 4 global models to predict structural complexity on a PFT basis, using all GEDI RH percentiles from each footprint to predict 3D canopy entropy (CExyz), a surrogate for structural complexity measured from ALS point clouds, using XGBoost regression. The modeling framework relied on a rigorous grid search spatial cross-validation regime to ensure (1) optimal hyperparameter tuning, (2) model generalization (i.e. robustness against overfitting) and (3) geographical transferability of all models.
Quality Assessment
We used 816,276 collocated GEDI/ALS samples from 229 ALS surveys distributed around the world. Those sites were split into training and calibration sets, containing the samples from 80% and 20% of the sites, respectively. The training set was used to fit the WSCI models through XGBoost regression, applying grid search hyperparameter tuning with 5-fold spatial cross-validation. The best model was chosen based on the optimal combination of hyperparameters that minimized the root mean squared error (RMSE) loss function in the validation folds, while maintaining a difference of less than 5% between training and validation folds in terms of RMSE and R2, thus enforcing model generalization. Since each fold contained data from different geographical locations, the validation folds measured the model performance on sites unseen during model training, granting geographical transferability of the selected models. The calibration set was used to train conformal predictors (Vovk et al., 2005) for each WSCI model, enabling uncertainty estimation for every model prediction based on paired GEDI/ALS samples never seen during training of the XGBoost models. Uncertainty estimates are provided as prediction intervals at 95% confidence for every footprint.
Data Acquisition, Materials, and Methods
The GEDI instrument is aboard the International Space Station (ISS) and its mission aims to characterize ecosystem structure and dynamics to enable improved quantification and understanding of the Earth’s carbon cycle and biodiversity. GEDI is led by the University of Maryland in collaboration with NASA Goddard Space Flight Center. GEDI science data algorithms and products are created by the GEDI Science Team.
The GEDI instrument produces high-resolution laser ranging observations of the 3-dimensional structure of the Earth. GEDI was launched on December 5, 2018, and is attached to the ISS. GEDI collects data globally at the highest resolution and densest sampling of any light detection and ranging (lidar) instrument in orbit to date. The GEDI instrument consists of 3 lasers producing a total of 8 beam ground transects, which consist of ~25 m footprint samples spaced approximately every 60 m along-track. The GEDI beam transects are spaced approximately 600 m apart on the Earth’s surface in the cross-track direction, for an across-track width of ~4.2 km.
The GEDI WSCI models were trained on a database of 816,276 collocated GEDI/ALS samples over from all major continental regions, with a fraction of 24%, 32%, 24% and 20% of those footprints registered in DBT, EBT, ENT and GSW, respectively. The ALS data used in the model development are part of the GEDI Calibration and Validation (Cal/Val) database and were provided by research partners or downloaded from open data initiatives, such as the NEON (NEON, 2023) in the United States, the INPE-EBA (Ometto et al., 2023) in Brazil. With more ALS data sets becoming available allied to the GEDI mission extension, expected to stay operational until the end of the life cycle of the International Space Station, we plan to expand the WSCI training database and keep updating its underlying models.
Prior to training the models, the GEDI footprints were collocated to ALS point clouds to correct for geolocation error in the Cal/Val processing, ensuring that both datasets were matched as precisely as possible and represented the exact same plot over the land surface. 3D Canopy Entropy (CExyz) measurements were then extracted from 25-m diameter ALS point clouds, matching the GEDI footprints in position and area. The CExyz metric was developed by Liu et al. (2022), and leverages entropy planes on the horizontal and vertical directions of a forest plot to account for 3D structural complexity of the forest canopy, capturing variations in features related to tree density and vertical layering simultaneously.
Footprint WSCI is derived from extreme gradient boosted trees (XGBoost) regression models (Chen and Guestrin, 2016) relating GEDI L2A relative height metrics to CExyz measured from ALS point clouds. The XGBoost models were trained on a PFT basis, assigned to each GEDI footprint in the L2A product and extracted from an error-corrected and infilled 1-km grid derived from the Type 5 classification in the MODIS MCD12Q1 V006 data product (Friedl et al., 2010). WSCI estimates are derived from four different models trained on footprints registered over deciduous broadleaf trees (DBT), evergreen broadleaf trees (EBT), evergreen needleleaf trees (ENT), and combinations of woodlands, grasslands, and shrubs (GSW).
We used all available GEDI RH metrics as input in the regression models, allowing the XGBoost algorithm to choose the best predictors of CExyz in a data driven fashion. RH percentiles within close ranges from each other are highly correlated, and although the XGBoost is an efficient machine learning method robust to overfitting, we applied a rigorous regime of hyperparameter tuning and spatial cross-validation to guarantee model generalization and geographical transferability.
On-orbit predictions of WSCI are made using the GEDI02_A elevation and height metric data product as input. The algorithms used by GEDI for generating these are described in the ATBD for GEDI Transmit and Receive Waveform Processing for L1 and L2 Products (Hofton and Blair, 2020). The L4C product contains estimates from all algorithm group settings available in L2A, which apply slightly different methods to calculate the RH metrics, thus affecting WSCI estimates, accompanied by prediction intervals and quality flags for every footprint.
How are the GEDI04_C estimates geolocated?
The GEDI04_C product uses the ground position as the location of each shot and WSCI estimate (elev_lowestmode, lat_lowestmode, lon_lowestmode). Additional waveform ranging points are available in the GEDI02_A product (e.g., elev_highestreturn, lat_highestreturn, lon_highestreturn) and may be joined to GEDI04_C using the shot_number dataset.
What quality metrics and flags should I use to filter the data?
WSCI is predicted for every shot where GEDI02_A algorithm was successfully run and RH metrics are provided, as indicated by the algorithm_run_flag dataset. The GEDI04_C product provides multiple quality flags and metrics that may be used to subset the predictions to the most useful observations for a particular application or region. The l2_quality_flag encapsulates a number of GEDI02_A quality metrics to identify land surface shots with waveforms of high fidelity for WSCI estimation. The wsci_quality_flag applies more strict filters on top of l2_quality_flag to identify shots with a higher likelihood of occurring over tree covered land surfaces, matching the domain for which the WSCI models were developed. More specifically, the wsci_quality_flag applied more strict filters for water and urban surfaces, higher sensitivity thresholds, targeting higher penetration rate on denser forest canopies, and only included footprints flagged as tree cover class in the ESA worldcover v200 product (Zanaga et al., 2022), provided as the worldcover_class dataset in the land_cover_data group of each laser beam in the L4C product.
What are the units and range for the WSCI estimates?
The WSCI estimates are equivalent to CExyz measured on ALS point clouds of 25-m diameter, matching the GEDI’s footprint size. The WSCI estimates 3D entropy, which does not have a physically meaningful unit, but rather ranges from low to high values. Globally, WSCI ranges approximately from 7 to 11.4 on forest landscapes, with WSCI < 8 corresponding to barely vegetated areas, where little to no forest structural complexity is observed. On the other extreme, WSCI > 10.5 represents high structural complexity, such as tall, dense, undisturbed forests in the tropics. Again, these values are given on a global context, and the WSCI ranges and their interpretations may change on local contexts or when comparing forest types of similar structure (e.g. within a given canopy height interval). Therefore, which WSCI values represent low or high structural complexity depends on the local context of each study and should be assessed accordingly.
Data Access
These data are available through the Oak Ridge National Laboratory (ORNL) Distributed Active Archive Center (DAAC).
GEDI L4C Footprint Level Waveform Structural Complexity Index, Version 2
Contact for Data Center Access Information:
- E-mail: uso@daac.ornl.gov
- Telephone: +1 (865) 241-3952
References
Chen, T., and C. Guestrin. 2016. XGBoost: A Scalable Tree Boosting System. Proceedings of the 22nd ACM SIGKDD International Conference on Knowledge Discovery and Data Mining, 785–794. https://doi.org/10.1145/2939672.2939785
de Conto, T., Armston, J. & Dubayah, R. Characterizing the structural complexity of the Earth’s forests with spaceborne lidar. Nat Commun 15, 8116 (2024). https://doi.org/10.1038/s41467-024-52468-2
Friedl, M.,and D. Sulla-Menashe. 2022. MODIS/Terra+Aqua Land Cover Type Yearly L3 Global 500m SIN Grid V061. NASA EOSDIS Land Processes Distributed Active Archive Center. https://doi.org/10.5067/MODIS/MCD12Q1.061
Hofton, M.A., and J.B. Blair. 2020. Algorithm Theoretical Basis Document (ATBD) for GEDI Transmit and Receive Waveform Processing for L1 and L2 Products. Goddard Space Flight Center, Greenbelt, MD. https://doi.org/10.5067/DOC/GEDI/GEDI_WF_ATBD.001
Liu, X., Q. Ma, X. Wu, T. Hu, Z. Liu, L. Liu, Q. Guo, and Y. Su. 2022. A novel entropy-based method to quantify forest canopy structural complexity from multiplatform lidar point clouds. Remote Sensing of Environment, 282, 113280. https://doi.org/10.1016/j.rse.2022.113280
NEON (National Ecological Observatory Network). 2023. Discrete return LiDAR point cloud. NEON (National Ecological Observatory Network). https://doi.org/10.48443/xxby-5a18
Ometto, J., E.B. Gorgens, F.R. de Sousa Pereira, L. Sato, M.L.R. Assis, R. Cantinho, M. Longo, A.D. Jacon, and M. Keller. 2023. L1A - Discrete airborne LiDAR transects collected by EBA in the Brazilian Amazon (Roraima e Amapá) (Version v20230301). Zenodo. https://doi.org/10.5281/zenodo.7689693
Vovk, V., A. Gammerman, and G. Shafer (Eds.). 2005. Conformal prediction. In Algorithmic Learning in a Random World (pp. 17–51). Springer US. https://doi.org/10.1007/0-387-25061-1_2
Zanaga, D., R. Van De Kerchove, D. Daems, W. De Keersmaecker, C. Brockmann, G. Kirches, J. Wevers, O. Cartus, M. Santoro, S. Fritz, M. Lesiv, M. Herold, N.-E Tsendbazar, P. Xu, F. Ramoino, and O. Arino. 2022. ESA WorldCover 10 m 2021 v200 (Version v200). Zenodo. https://doi.org/10.5281/ZENODO.7254221
Dataset Revisions
This dataset was updated on January 27th, 2025. In this update, 23 granules from 6 orbits were renamed to reflect corrected reference ground track (RGT) numbers. No science data was affected. Specifically, granules with track number 01461 (T01461) from orbit 09360 (O09360) were renamed to track number 01614 (T01614). For example, the granule GEDI04_C_2020220033908_O09360_02_T01461_02_001_01_V002.h5 was renamed to GEDI04_C_2020220033908_O09360_02_T01614_02_001_01_V002.h5. Additionally, the following tracks were renamed: track T11164 from orbit O16529 was renamed to T11011, track T08166 from orbit O16530 was renamed to T09436, track T06592 from orbit O16532 was renamed to T10861, track T08016 from orbit O16533 was renamed to T09286, and track T10863 from orbit O16534 was renamed to T06441.