Documentation Revision Date: 2025-04-10
Dataset Version: 2.1
Summary
There are 85,064 data files in HDF5 (*.h5) format included in this dataset and eight companion files that provide additional details regarding the product model development and variable descriptions. Companion files must be downloaded separately from the dataset.
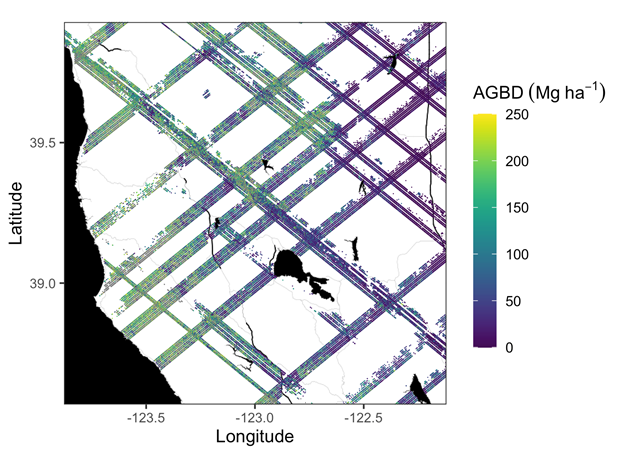
Figure 1. Example subset of aboveground biomass density (AGBD; Mg ha-1) predictions from the GEDI Level-4A footprint product over Northern California, U.S., spanning April to July 2019. GEDI footprints are spaced 60m along-track and 600m across-track.
Citation
Dubayah, R.O., J. Armston, J.R. Kellner, L. Duncanson, S.P. Healey, P.L. Patterson, S. Hancock, H. Tang, J.M. Bruening, M.A. Hofton, J.B. Blair, and S.B. Luthcke. 2022. GEDI L4A Footprint Level Aboveground Biomass Density, Version 2.1. ORNL DAAC, Oak Ridge, Tennessee, USA. https://doi.org/10.3334/ORNLDAAC/2056
Table of Contents
- Dataset Overview
- Data Characteristics
- Application and Derivation
- Quality Assessment
- Data Acquisition, Materials, and Methods
- Data Access
- References
- Dataset Revisions
Dataset Overview
This dataset contains Global Ecosystem Dynamics Investigation (GEDI) Level 4A (L4A) Version 2 predictions of the aboveground biomass density (AGBD; in Mg/ha) and estimates of the prediction standard error within each sampled geolocated laser footprint. The granules in this version 2 dataset are in sub-orbits. The algorithm setting group selection used for GEDI02_A Version 2 has been modified for Evergreen Broadleaf Trees in South America to reduce false-positive errors resulting from the selection of waveform modes above ground elevation as the lowest mode. The footprints are located within the global latitude band observed by the International Space Station (ISS), nominally 51.6 degrees N and S, and reported for the period 2019-04-17 to 2024-11-27. No acquisitions occurred while the GEDI instrument was in storage on the International Space Station (ISS) from March 2023 to April 2024. The GEDI instrument consists of three lasers producing a total of eight beam ground transects, which instantaneously sample eight ~25 m footprints spaced approximately every 60 m along-track. The GEDI beam transects are spaced approximately 600 m apart on the Earth's surface in the cross-track direction, for an across-track width of ~4.2 km. Footprint AGBD was derived from parametric models that relate simulated GEDI Level 2A (L2A) waveform relative height (RH) metrics to field plot estimates of AGBD. Height metrics from simulated waveforms associated with field estimates of AGBD from multiple regions and plant functional types (PFT) were compiled to generate a calibration dataset for models representing the combinations of world regions and PFTs (i.e., deciduous broadleaf trees, evergreen broadleaf trees, evergreen needleleaf trees, deciduous needleleaf trees, and the combination of grasslands, shrubs, and woodlands).
Uncertainty metrics, quality flags, and model inputs are reported with the AGBD estimates for each of the eight beams. Model inputs include the scaled and transformed GEDI L2A RH metrics and other information about the GEDI L2A waveform for this selected algorithm setting group. Also provided are model inputs for each of the eight beams including footprint geolocation variables, land cover input data including PFTs, and the world region identifiers. Additional model outputs include the AGBD predictions for each of the six GEDI L2A algorithm setting groups with AGBD in natural and transformed units and associated prediction uncertainty. These ancillary data products allow users to evaluate and select alternative algorithm setting groups. The outputs of parameters and variables from the L4A models used to generate AGBD predictions are also provided; these outputs serve as input to the GEDI04_B algorithm to generate 1-km gridded products.
Project: Global Ecosystem Dynamics Investigation
The Global Ecosystem Dynamics Investigation (GEDI) produces high resolution laser ranging observations of the 3D structure of the Earth. GEDI’s precise measurements of forest canopy height, canopy vertical structure, and surface elevation greatly advance our ability to characterize important carbon and water cycling processes, biodiversity, and habitat. GEDI was funded as a NASA Earth Ventures Instrument (EVI) mission. It was launched to the International Space Station in December 2018 and completed initial orbit checkout in April 2019.
Related Publication
Kellner, J.R., J. Armston, and L. Duncanson. 2022. Algorithm theoretical basis document for GEDI footprint aboveground biomass density. Earth and Space Science, 9, e2022EA002516. https://doi.org/10.1029/2022EA002516
Dubayah, R., J.B. Blair, S. Goetz, L. Fatoyinbo, M. Hansen, S. Healey, M. Hofton, G. Hurtt, J. Kellner, S. Luthcke, J. Armston, H. Tang, L. Duncanson, S. Hancock, P. Jantz, S. Marselis, P.L. Patterson, W. Qi, and C. Silva. 2020. The Global Ecosystem Dynamics Investigation: High-resolution laser ranging of the Earth’s forests and topography. Science of Remote Sensing 1:100002. https://doi.org/10.1016/j.srs.2020.100002
Duncanson, L., Kellner, J.R., Armston, J., Dubayah, R., Minor, D.M., Hancock, S., Healey, S.P., Patterson, P.L., Saarela, S., Marselis, S. and Silva, C.E., 2022. Aboveground biomass density models for NASA’s Global Ecosystem Dynamics Investigation (GEDI) lidar mission. Remote Sensing of Environment, 270, p.112845. https://doi.org/10.1016/j.rse.2021.112845
Related Datasets
Dubayah, R.O., J. Armston, J.R. Kellner, L. Duncanson, S.P. Healey, P.L. Patterson, S. Hancock, H. Tang, M.A. Hofton, J.B. Blair, and S.B. Luthcke. 2022. GEDI L4A Footprint Level Aboveground Biomass Density, Golden Weeks, Version 1. ORNL DAAC, Oak Ridge, Tennessee, USA. https://doi.org/10.3334/ORNLDAAC/2028
Dubayah, R.O., S.B. Luthcke, T.J. Sabaka, J.B. Nicholas, S. Preaux, and M.A. Hofton. 2021. GEDI L3 Gridded Land Surface Metrics, Version 2. ORNL DAAC, Oak Ridge, Tennessee, USA. https://doi.org/10.3334/ORNLDAAC/1952
Level 1B, Level 2A, and Level 2B data from GEDI are available from the Land Processes Distributed Active Archive Center at https://lpdaac.usgs.gov/
Acknowledgments
This work was funded by NASA contract #NNL 15AA03C to the University of Maryland for the development and execution of the GEDI mission (Dubayah, Principal Investigator). We thank the NASA Terrestrial Ecology Program and Hank Margolis for supporting the GEDI mission, and the University of Maryland for providing independent financial support. We thank Jamis Bruening, Suzanne Marselis, David Minor, and Carlos E. Silva for contributing to the development and management of the GEDI Forest Structure and Biomass Database. We gratefully acknowledge the GEDI Science Team and numerous collaborators who generously contributed field estimates of AGBD, stem maps, and airborne lidar data. These people include Katharine Abernethy, Hans-Erik Andersen, Paul Aplin, Timothy R. Baker, Nicolas Barbier, Jean Francois Bastin, Pascal Boeckx, Jan Bogaert, Luigi Boschetti, Peter Brehm Boucher, Doreen S. Boyd, Patrick Burns, David F.R.P. Burslem, Sofia Calvo-Rodriguez, Jérôme Chave, Robin L. Chazdon, David B. Clark, Deborah A. Clark, Warren B. Cohen, David A. Coomes, Piermaria Corona, K.C. Cushman, Mark E. J. Cutler, James William Dalling, Michele Dalponte, Sergio de-Miguel, Songqiu Deng, Peter Woods Ellis, Barend Erasmus, Michael Falkowski, Temilola Fatoyinbo, Patrick A. Fekety, Alfredo Fernández-Landa, Antonio Ferraz, Rico Fischer, Adrian G. Fisher, Antonio García-Abril, Terje Gobakken, Scott J. Goetz, Jonathan A. Greenberg, Jorg M. Hacker, Matt Hansen, Marco Heurich, Ross A. Hill, Sören Holm, Chris Hopkinson, Chengquan Huang, Huabing Huang, Stephen P. Hubbell, Andrew T. Hudak, George Hurtt, Andreas Huth, Benedikt Imbach, Patrick Jantz, Kathryn Jeffery, Masato Katoh, Elizabeth Kearsley, Natascha Kljun, Nikolai Knapp, Kamil Král, Martin Krucek, Nicolas Labrière, Seung-kuk Lee, Simon L. Lewis, Marcos Longo, Richard M. Lucas, Scott Luthcke, Russell Main, Jose A. Manzanera, Suzanne Marselis, Rodolfo Vásquez Martínez, Renaud Mathieu, Victoria Meyer, Paul Montesano, Felix Morsdorf, Erik Næsset, Laven Naidoo, Reuben Nilus, Michael J. O'Brien, David A. Orwig, Geoffrey Parker, Paul Patterson, Christopher Philipson, Oliver L. Phillips, Jan Pisek, Jim Pontius, John R. Poulsen, Wenlu Qi, Christoph Rüdiger, Svetlana Saarela, Sassan Saatchi, Arturo Sanchez-Azofeifa, Nuria Sanchez-Lopez, Crystal B. Schaff, Marc Simard, Andrew Kerr Skidmore, Göran Ståhl, Krzysztof Sterenczak, Chiara Torresan, Rubén Valbuena, Hans Verbeeck, Tomas Vrska, Konrad Wessels, Joanne C. White, and Carlo Zgraggen.
Data Characteristics
Spatial Resolution: Footprints ~25 m in diameter
Temporal Coverage: 2019-04-17 to 2024-11-27
Temporal Resolution: One-time estimate
Study Area: Latitude and longitude are given in decimal degrees.
| Site | Westernmost Longitude | Easternmost Longitude | Northernmost Latitude | Southernmost Latitude |
|---|---|---|---|---|
| Global | -180 | 180 | 53.99333 | -52.20456 |
Data File Information
There are 85,064 data files in HDF5 (*.h5) format included in this dataset. Each file provides multiple datasets/groups for each of the eight beams with valid data (i.e., 0000, 0001, 0010, 0011, 0101, 0110, 1000, 1011). There are also eight companion files that provide additional details regarding the product model development and variable descriptions. Companion files must be downloaded separately from the dataset.
The files are named GEDI04_A_YYYYDDDHHMMSS_O[orbit_number]_[granule_number]_T[track_number]_[PPDS_type]_ [release_number]_[production_version]_V[version_number].h5 (e.g., GEDI04_A_2021188232338_O14550_04_T08520_02_002_02_V002.h5), where:
GEDI04_A = product short name representing GEDI Level 4A data,
YYYYDDDHHMMSS = date and time of acquisition in Julian day of year, hours, minutes, and seconds format,
[orbit_number] = orbit number,
[granule_number] = sub-orbit granule (or file) number,
[track_number] = track number,
[PPDS_type] = positioning and pointing determination system (PPDS) type (00 is "predict", 01 is "rapid", 02 and higher is "final"),
[release_number] = release number (002), representing the SOC SDS (software) release used to generate this L4A dataset, The granules with a release number <=’002’ were processed by the GEDI Science Team at the University of Maryland. Those with a release number >=’003’ were processed by the Science Operations Center (SOC) at Goddard Space Flight Center. The SOC started processing GEDI L4A granules in mission week 163 (2022-01-20).
[production_version] = granule production version , e.g., a particular data granule (or file) may have been regenerated multiple times,
[version_number] = L4A dataset production version (002), corresponding to the ORNL DAAC’s dataset version number, and
.h5 = file extension, HDF5 format.
Table 1. File names and descriptions.
| File Name | Description |
|---|---|
| Data Files | |
| GEDI04_A_2021188232338_O14550_04_T08520_02_002_02_V002.h5 | Each contains information and data in METADATA and BEAMXXXX groups and three ANCILLARY group datasets. |
| Companion Files | |
| GEDI_ATBD_L4A_v1.0.pdf | Algorithm Theoretical Basis Document (ATBD) for GEDI L4A Footprint Aboveground Biomass Density Product (current dataset). |
| GEDI_L4A_AGB_Density_V2_1.pdf | A PDF version of this user guide. |
| GEDI_L4A_V2_Common_Queries.pdf | Common data questions and answers on how to use and interpret the GEDI L4A product. This information is also provided in Section 5 of this user guide. |
| GEDI_L4A_V2_Product_Data_Dictionary.pdf | Data product dictionary that provides detailed information about each variable included in the data files. |
| list_of_deleted_files_mw_163_182.txt | List of files removed from this dataset for mission weeks 163 through 182 on February 9, 2023. |
| list_of_revised_files_mw_163_182.txt | List of replacement files in this dataset for mission weeks 163 through 182 published on February 9, 2023. |
list_of_deleted_files_orbits_17591_09899.txt |
List of granules removed from this dataset from the orbits 9899 and 17591 on November 3rd, 2023. |
list_of_revised_files_orbits_17591_09899.txt |
List of revised granules from the orbits 9899 and 17591 published on November 3rd, 2023. |
File Organization
Each GEDI04_A granule contains information in METADATA and BEAMXXXX groups in addition to three compound datasets.
The METADATA group contains data set identification information.
The BEAMXXXX root group (Table 2) contains the AGBD prediction, associated uncertainty metrics, quality flags, and model inputs including the scaled and transformed GEDI02_A RH metrics and other information about the waveform for the selected algorithm setting group.
There is one BEAMXXXX group for each of the eight beams with valid data. The GEDI04_A Version 2 product uses GEDI02_A Version 2 as input, however, the algorithm setting group selection used for GEDI02_A Version 2 has been modified for Evergreen Broadleaf Trees in South America to reduce false-positive errors resulting from the selection of waveform modes above ground elevation as the lowest mode. The BEAMXXXX root group contains the AGBD prediction, associated uncertainty metrics, quality flags, the scaled and transformed GEDI02_A RH metrics, and other information about the waveform for the selected algorithm setting group.
- The BEAMXXXX / geolocation group (Table 3) contains elevation, latitude, longitude, and other information for each algorithm selection group (i.e., 1, 2, 3, 4, 5, 6, and 10).
- The BEAMXXXX / land_cover_data group (Table 4) The BEAMXXXX / land_cover_data group contains land cover data extracted from external data sources, including Landsat tree cover, Landsat water persistence, a modified version of MCD12Q1 V006 PFT, the world region identifier, the TanDEM-X global urban footprint classification, and leaf-off and leaf-on flags. The PFT and world region identifier used in L4A have been updated from the GEDI04_A Version 1 data.
- The BEAMXXXX / agbd_prediction group (Table 5) contains ancillary information, AGBD predictions in natural and transformed units, and associated prediction uncertainty for each algorithm setting group. Providing these data allows the user to evaluate and select alternative algorithm setting groups.
The ANCILLARY / model_data group (Table 6) in the GEDI04_A data provides parameters and variables from the L4A models used to generate predictions. All the model parameters and uncertainty estimates (e.g. variance-covariance matrix of the model parameters) required as input to the GEDI04_B algorithm are also provided.
ANCILLARY / pft_lut (Table 7) and ANCILLARY / region_lut (Table 8) are look-up tables that link a numeric value from gridded PFT or world region to a descriptive text name.
What is the algorithm setting group?
Investigators applied a sophisticated post-processing algorithm to the received waveforms from the GEDI instrument to detect weaker waveform signals. The “algorithm setting group” defines the specific set of parameters used in an algorithm run. There are six (i.e., 1, 2, 3, 4, 5, 6, and 10¥) defined groups.
Each algorithm run's output and externally-set parameters are available in the L2A data product, within the ‘rx_processing_a<n>’ subgroup. For details refer to Hofton and Blair (2020).
In the L4A data products, the geolocation group and the agbd_prediction group report footprint data for each “algorithm setting group”. The variables are *_aN, where N is 1, 2, 3, 4, 5, 6, or 10¥. In the BEAMXXXX root group, the reported AGBD prediction value is for the selected algorithm setting group. The selected “algorithm setting group” is contained in the selected_algorithm variable. The selected AGBD value is reported in the agbd_prediction group dataset.
¥ Note that a value of 10 indicates algorithm setting group 5 has been used, but that the lowest detected mode is likely a noise detection. When this occurs, a higher mode has been used to calculate RH metrics (Hofton and Blair, 2020).
Variables in the L4A Footprint Data Files
Data are inputs from L2A (Source L2A) and outputs of the GEDI04_A algorithm, descriptors, and quality flags. Data files are provided for each beam.
Table 2. Variable names and descriptions in the Aboveground Biomass Density group. These variables include the AGBD prediction, associated uncertainty metrics, quality flags, the scaled and transformed GEDI02_A RH metrics, and other information about the waveform for the selected algorithm setting group. Input variables from the GEDI02_A data product are marked with "L2A" as the source.
| Variable | Units (Source) | Description |
|---|---|---|
| agbd | Mg/ha | Predicted aboveground biomass density (Mg/ha) |
| agbd_pi_lower | Mg/ha | Lower prediction interval (see alpha attribute for the level) |
| agbd_pi_upper | Mg/ha | Upper prediction interval (see alpha attribute for the level) |
| agbd_se | Mg/ha | Aboveground biomass density (Mg/ha) prediction standard error |
| agbd_t | Model prediction in fit units | |
| agbd_t_se | Model prediction standard error in fit units (needed for calculation of custom prediction intervals) | |
| algorithm_run_flag | The L4A algorithm is run if this flag is set to 1. This flag selects data that have sufficient waveform fidelity for AGBD estimation. | |
| beam | (L2A) | Beam identifier |
| channel | (L2A) | Channel identifier |
| degrade_flag | (L2A) | Flag indicating degraded state of pointing and/or positioning information |
| delta_time | s (L2A) | Time since Jan 1 00:00 2018. |
| elev_lowestmode | m (L2A) | Elevation of center of lowest mode relative to reference ellipsoid |
| l2_quality_flag | Flag identifying the most useful L2 data for biomass predictions | |
| l4_quality_flag | Flag simplifying selection of most useful biomass predictions | |
| lat_lowestmode | degrees (L2A) | Latitude of center of lowest mode |
| lon_lowestmode | degrees (L2A) | Longitude of center of lowest mode |
| master_frac | s (L2A) | Master time, fractional part. master_int+master_frac is equivalent to /BEAMXXXX/delta_time. |
| master_int | s (L2A) | Master time, integer part. Seconds since master_time_epoch. master_int+master_frac is equivalent to /BEAMXXXX/delta_time. |
| predict_stratum | Prediction stratum identifier. Character ID of the prediction stratum name for the 1 km cell | |
| predictor_limit_flag | Predictor value is outside the bounds of the training data (0=in bounds; 1=lower bound; 2=upper bound) | |
| response_limit_flag | Prediction value is outside the bounds of the training data (0=in bounds; 1=lower bound; 2=upper bound) | |
| selected_algorithm | (L2A) | Selected algorithm setting group |
| selected_mode | (L2A) | ID of mode selected as lowest non-noise mode |
| selected_mode_flag | (L2A) | Flag indicating status of selected_mode |
| sensitivity | (L2A) | Beam sensitivity. Maximum canopy cover that can be penetrated considering the SNR of the waveform |
| shot_number | (L2A) |
Unique identifier used to link observations between groups and between data products. The shot number format is OOOOOBBRRGNNNNNNNN, where OOOOO is the orbit number, BB is the beam number, RR is reserved for the future and G is the sub-orbit number,and NNNNNNNN is the shot number within the beam. |
| solar_elevation | degrees (L2A) | Solar elevation angle |
| surface_flag | (L2A) | Indicates elev_lowestmode is within 300m of Digital Elevation Model (DEM) or Mean Sea Surface (MSS) elevation |
| xvar | Predictor variables (offset and transformation have been applied) |
Table 3. Variable names and descriptions in the Geolocation group. This group contains elevation, latitude, longitude, and other information for each algorithm selection group (i.e., 1, 2, 3, 4, 5, 6, and 10). Input variables from the GEDI02_A data product are marked with "L2A" as the source.
| Variable | Units (Source) | Description |
|---|---|---|
| elev_lowestmode_aN | m (L2A) | Elevation of center of lowest mode relative to the reference ellipsoid. |
| lat_lowestmode_aN | degrees (L2A) | Latitude of center of lowest mode. |
| lon_lowestmode_aN | degrees (L2A) | Longitude of center of lowest mode. |
| sensitivity_aN | (L2A) | Maximum canopy cover that can be penetrated considering the SNR of the waveform. |
| shot_number | (L2A) | Shot number. |
| stale_return_flag | (L2A) | Flag from digitizer indicating the real-time pulse detection algorithm did not detect a return signal above its detection threshold within the entire 10 km search window. The pulse location of the previous shot was used to select the telemetered waveform. |
Table 4. Variable names and descriptions in the Landcover group. This group contains land cover data extracted from external data sources, including Landsat tree cover, Landsat water persistence, a modified version of MCD12Q1 V006 PFT, the world region identifier, the TanDEM-X global urban footprint classification, and leaf-off and leaf-on flags. The PFT and world region identifier used in L4A are described further in Section 5 of this document. Input variables from the GEDI02_A data product are marked with "L2A" as the source.
| Variable | Units (Source) | Description |
|---|---|---|
| landsat_treecover | percent (L2A) | Tree cover in the year 2010, defined as canopy closure for all vegetation taller than 5 m in height (Hansen et al., 2013) and encoded as a percentage per output grid cell. |
| landsat_water_persistence | percent | The percent UMD GLAD Landsat observations with classified surface water between 2018 and 2019. Values >80 usually represent permanent water while values <10 represent permanent land. |
| leaf_off_doy | days | GEDI 1 km EASE 2.0 grid leaf-off start day-of-year derived from the NPP VIIRS Global Land Surface Phenology Product. |
| leaf_off_flag | GEDI 1 km EASE 2.0 grid flag derived from leaf_off_doy, leaf_on_doy, and pft_class, indicating if the observation was recorded during leaf-off conditions in deciduous needleleaf or broadleaf forests and woodlands. 1=leaf-off, 0=leaf-on. | |
| leaf_on_cycle | Flag that indicates the vegetation growing cycle for leaf-on observations. Values are 0=leaf-off conditions, 1=cycle 1, 2=cycle 2. | |
| leaf_on_doy | GEDI 1 km EASE 2.0 grid leaf-on start day- of-year derived from the NPP VIIRS Global Land Surface Phenology product. | |
| pft_class | GEDI 1 km EASE 2.0 grid Plant Functional Type (PFT) derived from the MODIS MCD12Q1v006 product. Values follow the Land Cover Type 5 Classification scheme. | |
| region_class | GEDI 1 km EASE 2.0 grid world continental regions (0=Water, 1=Europe, 2=North Asia, 3=Australasia, 4=Africa, 5=South Asia, 6=South America, 7=North America). | |
| shot_number | (L2A) | Shot number |
| urban_focal_window_size | pixels | The focal window size used to calculate urban_proportion. Values are 3 (3x3 pixel window size) or 5 (5x5 pixel window size). |
| urban_proportion | percent | The percentage proportion of land area within a focal area surrounding each shot that is urban land cover. Urban land cover was derived from the DLR 12 m resolution TanDEM-X Global Urban Footprint Product. |
Table 5. Variable names and descriptions in the Aboveground Biomass Prediction group. This group contains ancillary information, AGBD predictions in natural and transformed units, and associated prediction uncertainty for each algorithm setting group (i.e., 1, 2, 3, 4, 5, 6, and 10). Providing these data allows the user to evaluate and select alternative algorithm setting groups.
| Variable | Units | Description |
|---|---|---|
| pft_grid_version | 1 km Plant Functional Type grid version | |
| pft_infilled_grid_version | 1 km Plant Functional Type prediction strata grid version | |
| region_ grid_version | 1 km geographic region prediction strata grid version | |
| phenology_grid_version | 1 km phenology metrics grid version | |
| urban_grid_version | 25 m urban proportion grid version | |
| water_grid_version | 25 m water persistence grid version | |
| predictor_offset | Offset applied to predictors before model fitting | |
| response_offset | Offset applied to the response before model fitting | |
| l2a_alg_count | Number of L2A algorithm setting groups used for L4A | |
| max_nvar | Maximum number of predictors in L4A models | |
| alpha | Alpha value used for calculation of prediction intervals | |
| agbd_aN | Mg/ha | Above ground biomass density; Geolocation latitude lowestmode (_aN=a1, 2, 3, 4, 5, 6, and a10). |
| agbd_pi_lower_aN | Mg/ha | Above ground biomass density lower prediction interval (_aN=a1, 2, 3, 4, 5, 6, and a10). |
| agbd_pi_upper_aN | Mg/ha | Above ground biomass density upper prediction interval (_aN=a1, 2, 3, 4, 5, 6, and a10). |
| predictor_limit_flag_aN | Predictor value is outside the bounds of the training data (_aN=a1, 2, 3, 4, 5, 6, and a10). | |
| agbd_se_aN | Mg/ha | Aboveground biomass density (Mg/ha) prediction standard error (_aN=a1, 2, 3, 4, 5, 6, and a10). |
| selected_mode_aN | ID of mode selected as lowest non-noise mode (_aN=a1, 2, 3, 4, 5, 6, and a10). | |
| selected_mode_flag_aN | Flag indicating status of selected mode (_aN=a1, 2, 3, 4, 5, 6, and a10). | |
| xvar_aN | Predictor variables (_aN=a1, 2, 3, 4, 5, 6, and a10). | |
| agbd_t_aN | Mg/ha | Aboveground biomass density model prediction in transform space (_aN=a1, 2, 3, 4, 5, 6, and a10). |
| agbd_t_pi_lower_aN | Mg/ha | Lower prediction interval in transform space (_aN=a1, 2, 3, 4, 5, 6, and a10). |
| agbd_t_pi_upper_aN | Mg/ha | Upper prediction interval in transform space (_aN=a1, 2, 3, 4, 5, 6, and a10). |
| agbd_t_se_aN | Model prediction standard error in fit units (_aN=a1, 2, 3, 4, 5, 6, and a10). | |
| algorithm_run_flag_aN | Algorithm run flag-this algorithm is run if this flag is set to 1. This flag selects data that have sufficient waveform fidelity for AGBD estimation (_aN=a1, 2, 3, 4, 5, 6, and a10). | |
| l2_quality_flag_aN | Flag identifying the most useful L2 data for biomass predictions (_aN=a1, 2, 3, 4, 5, 6, and a10). | |
| l4_quality_flag_aN | Flag simplifying selection of most useful biomass predictions (_aN=a1, 2, 3, 4, 5, 6, and a10). | |
| response_limit_flag_aN | Prediction value is outside the bounds of the training data (_aN=a1, 2, 3, 4, 5, 6, and a10). | |
| shot_number |
Unique identifier used to link observations between groups and between data products. The shot number format is OOOOOBBRRGNNNNNNNN, where OOOOO is the orbit number, BB is the beam number, RR is reserved for the future and G is the sub-orbit number,and NNNNNNNN is the shot number within the beam. |
Table 6. Variable names and descriptions in the Ancillary group: Model data. This group provides parameters and variables from the L4A models used to generate predictions. All the model parameters and uncertainty estimates (e.g. variance-covariance matrix of the model parameters) required as input to the GEDI04_B algorithm are also provided.
| Variable | Units | Description |
|---|---|---|
| predict_stratum | Prediction stratum (e.g., DBT_Af=Deciduous Broadleaf Tree, Africa) | |
| model_group | Model group (1= all predictors considered, 2 = no RH metrics below RH50, 3 = forced inclusion of RH98, 4 = forced inclusion of RH98 and no RH metrics below RH50) | |
| model_name | Model name (prediction stratum used for the fit data) | |
| model_id | Model rank used for the prediction stratum | |
| bias_correction_name | Back-transform bias correction method (Snowdon, Baskerville) | |
| bias_correction_value | Back-transform bias correction value | |
| dof | Degrees of freedom | |
| fit_stratum | Fit stratum | |
| par | Model parameters (coefficients) | |
| npar | Number of model parameters (coefficients) | |
| predictor_id | Predictor identifier | |
| predictor_max_value | Maximum value of predictor in transform space used to train the model | |
| response_max_value | Mg/ha | Maximum value of Mg/ha used to train the model |
| rh_index | Index of RH metric to use as a predictor | |
| rse | Residual Standard Error | |
| vcov | Variance-covariance matrix of model parameters | |
| x_transform | Predictor transform (sqrt, log, none) | |
| y_transform | Response transform (sqrt, log) |
Table 7. Variable names and descriptions in the Ancillary / pft_lut group. This group provides look-up tables that link a numeric value from gridded PFTs to a descriptive text name.
| Variable | Description |
|---|---|
| pft_class | MCD12Q1 Type 5 plant functional type (PFT) class |
| pft_name | L4A Plant Functional Type strata |
Table 8. Variable names and descriptions in the Ancillary / region_lut group. This group provides look-up tables that link a numeric value from the gridded world region to a descriptive text name.
| Variable | Description |
|---|---|
| region_class | L4A geographical region identifier |
| region_name | L4A geographical region strata |
Application and Derivation
Most previous efforts have developed site-specific or regional relationships between AGBD and remote sensing measurements (Drake et al., 2002). In contrast, GEDI requires models and algorithms designed to perform well throughout the entire observation domain of the ISS. Locally developed or regional relationships between AGBD and height are unlikely to perform well at locations outside the limited geographic extent of training data unless procedures are developed specifically to ensure transferability beyond the extent of calibration measurements. The GEDI L4A algorithm and product currently addresses two important components of transferability: (1) geographic transferability, meaning that the models can be extrapolated to locations outside the geographic extent of training data; and (2) transferability from simulated to recorded GEDI waveforms.
Quality Assessment
The GEDI Forest Structure and Biomass Database (FSBD) contained 31,414 simulated GEDI waveforms co-located with field plot estimates of AGBD. After excluding projects that are not analysis-ready or otherwise inappropriate for GEDI (e.g., variable radius plots), the unfiltered GEDI04_A calibration dataset contained 12,140 simulated GEDI waveforms. Quality control filters designed to flag observations that are likely to be erroneous (e.g., incongruence between height and AGBD) or that do not meet the requirements of the waveform simulator were then applied. The filtered GEDI04_A calibration dataset used to develop the second version of the GEDI04_A data product contained 8,587 simulated waveforms from 21 countries on all continents within the GEDI domain.
To quantify geographic transferability candidate models were evaluated within sets of 5-degree grid cells that contain simulated GEDI waveforms with coincident field data. Our approach sets aside data from one grid cell for testing and trains the model using data within the remaining grid cells. This model is used to predict AGBD within the held-out grid cell, and the process is repeated for all grid cells within each stratum for all models under consideration.
See the GEDI04_A ATBD (Kellner et al., 2022) for further details on the uncertainty/calibration analysis applied.
Data Acquisition, Materials, and Methods
The GEDI instrument is aboard the International Space Station (ISS) and its mission aims to characterize ecosystem structure and dynamics to enable improved quantification and understanding of the Earth’s carbon cycle and biodiversity. GEDI is led by the University of Maryland in collaboration with NASA Goddard Space Flight Center. GEDI science data algorithms and products are created by the GEDI Science Team.
The GEDI instrument produces high-resolution laser ranging observations of the 3-dimensional structure of the Earth. GEDI was launched on December 5, 2018, and is attached to the ISS. GEDI collects data globally at the highest resolution and densest sampling of any light detection and ranging (lidar) instrument in orbit to date. The GEDI instrument consists of 3 lasers producing a total of 8 beam ground transects, which consist of ~25 m footprint samples spaced approximately every 60 m along-track. The GEDI beam transects are spaced approximately 600 m apart on the Earth’s surface in the cross-track direction, for an across-track width of ~4.2 km.
Footprint AGBD is derived from linear parametric models that relate GEDI L2A waveform relative height metrics to aboveground biomass estimates from co-located field plots. The GEDI approach to footprint model selection is data-driven. Candidate models are stratified by plant functional type (PFT) and continental region, with natural logarithm or square root transformations on the response and predictor variables. The GEDI footprint models represent the following combination of PFT’s—deciduous broadleaf trees, evergreen broadleaf trees, evergreen and deciduous needleleaf trees, and combinations of woodlands, grasslands, and shrubs.
GEDI footprint AGBD is an L4A data product (GEDI04_A). Models to produce GEDI04_A were developed using field estimates of AGBD colocated with simulated GEDI waveforms derived from discrete-return airborne lidar (Blair and Hofton, 1999; Hancock et al., 2019). The justification for using simulated GEDI waveforms is that few locations on the land surface are associated with field estimates of AGBD that could be used to train GEDI models. Because GEDI is a sampling mission and most field plots are small, GEDI data will not intersect most of these locations during the mission life. Simulated GEDI waveforms are processed to GEDI02_A equivalent relative height (RH) metrics, which are defined as the percentage of the received laser waveform intensity that is less than a given height, where height is computed relative to the elevation of the lowest mode in the waveform (Fig. 2).
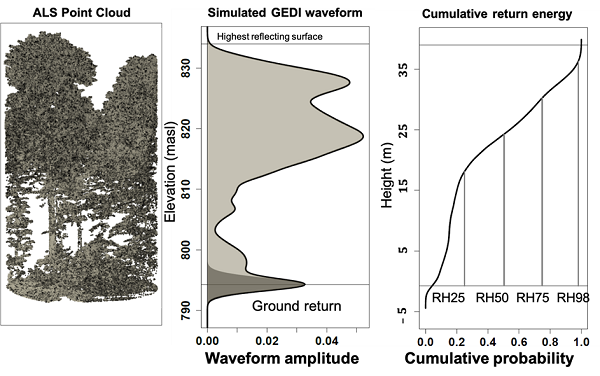
Figure 2. Relative height (RH) metrics were calculated as the height relative to ground elevation under which a certain percentage of waveform energy has been returned. RH50, for example, is the height relative to the ground elevation below which 50% of waveform energy has been returned.
The GEDI approach to developing footprint AGBD models considers multiple candidates stratified by world region and PFT with different functional forms. The models were developed using a quality-filtered calibration dataset that contains 8,587 simulated waveforms in 21 countries. These data were contributed by numerous researchers and standardized into the GEDI FSBD, which is a living data archive that grows over time as new datasets are assimilated and improvements are made to existing records.
The GEDI04_A models are stratified by world region and PFT (Fig. 3). Important regions are under-represented in the GEDI FSBD, including the forests of continental Asia, the evergreen broadleaf forests throughout the islands of Southeast Asia and north of Australia, and the worldwide distribution of savannas and deciduous tropical forests.
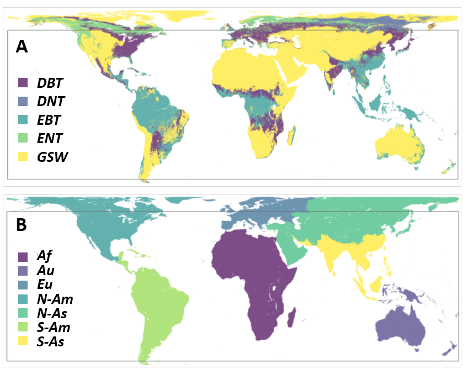
Figure 3. The GEDI04_A global stratification of plant functional types (PFT) (A) and world region (B) used to produce GEDI footprint AGBD models. The box inset is the GEDI observation domain of 51.6 degrees N to S latitude. PFT: DBT (deciduous broadleaf trees), DNT (deciduous needleleaf trees), EBT (evergreen broadleaf trees), ENT (evergreen needleleaf trees), GSW (grasses, shrubs, and woodlands). Regions: Af (Africa), Au (Australia and Oceania), Eu (Europe), N-Am (North America north of southern Mexico), N-As (North Asia), S-Am (South America, Central America, and southern Mexico, and the Caribbean), S-As (South Asia).
GEDI04_A world region includes the geologically defined continents of Africa and Europe. The South America world region is the continent of South America, Central America and the Caribbean islands, and geological North America south of southern Mexico. The Australia and Oceania world region is geological Australia and the island regions north of Australia on the east side of the Wallace line, which defines the floral and faunal boundary between Australia and Asia during the Pleistocene (Mayr, 1944). The islands of Micronesia, Melanesia, and Polynesia are associated with the Australia and Oceania world region regardless of political affiliation. The North American world region includes geological North America north of southern Mexico. The continent of Asia was divided into north and south regions that approximately correspond to temperate and tropical forests.
GEDI04_A PFTs are assigned using an error-corrected and infilled 1 km grid derived from the Type 5 classification in the MODIS MCD12Q1 V006 data product (Friedl et al., 2002; 2010). These are deciduous broadleaf trees (DBT; class 4), deciduous needleleaf trees (DNT; class 3), evergreen broadleaf trees (EBT; class 2), evergreen needleleaf trees (ENT; class 1), and grasses, shrubs, and woodlands (GSW; classes 5 and 6).
On-orbit predictions of AGBD are made using the GEDI02_A elevation and height metric data product as input. The algorithms used by GEDI for generating these are described in the ATBD for GEDI Transmit and Receive Waveform Processing for L1 and L2 Products (Hofton and Blair, 2020). The L4A product contains the information necessary to reproduce the AGBD prediction for individual GEDI shots from L2A data; the algorithm setting group selection used in Version 2 GEDI02_A data is applied to these data on a per footprint basis.
The GEDI04_A algorithm is described in detail in the ATBD for L4 GEDI aboveground biomass density (Kellner et al., 2022), and the development of GEDI04_A models will be described in forthcoming publications. The algorithm generates a predicted value of AGBD in units of megagrams per hectare (Mg ha-1) for every valid GEDI02_A waveform. The algorithm uses the latitude and longitude of the lowest mode to lookup the PFT from a modified version of MCD12Q1 V006 PFT classification and a world region grid. It then gets the selected estimator for the given combination of PFT and world region and predicts AGBD after scaling and transforming GEDI02_A RH metrics. Prediction intervals and the standard error of the prediction are generated and written to files.
Common Queries on How to Use and Interpret the GEDI04_A Data Product
This section is also provided in the companion file GEDI_L4A_V2_Common_Queries.pdf.
How are the GEDI04_A biomass estimates geolocated?
The GEDI04_A product uses the ground position as the location of each shot and AGBD estimate (elev_lowestmode, lat_lowestmode, lon_lowestmode). Additional waveform ranging points are available in the GEDI02_A product (e.g., elev_highestreturn, lat_highestreturn, lon_highestreturn) and may be joined to GEDI04_A using the shot_number dataset.
Note that the Version 2 GEDI04_A product is derived from the Version 2 GEDI02_A product (PGE Version 1), therefore has the same geolocation. Release 2 (PGE Version 3) GEDI02_A data product files are both available through the LP DAAC.
What quality metrics and flags should I use to filter the data?
AGBD is predicted for every shot where it is possible to run the GEDI04_A algorithm, as indicated by the algorithm_run_flag dataset (see Table 2). The GEDI04_A product provides multiple quality flags and metrics that may be used to subset the predictions to the most useful observations for a particular application or region.
The l2_quality flag encapsulates a number of GEDI02_A quality metrics to identify land surface shots with waveforms of high fidelity for AGBD estimation. The l4_quality_flag identifies shots that may be considered as samples of the population of which the applied models are representative. For example, GEDI04_A models for deciduous forests are only calibrated using GEDI waveforms simulated from leaf-on ALS data; therefore, we can only apply the derived models to on-orbit GEDI waveforms acquired under similar conditions.
The l2_quality flag uses a beam sensitivity threshold of 0.9 to match what is used for the Level 2 products. The l4_quality_flag uses a beam sensitivity threshold of 0.95, which was selected based on analysis of GEDI02_A and GEDI04_A on-orbit data. Beam sensitivity is an estimate of the maximum canopy cover that can be penetrated considering the signal-to-noise ratio of the waveform. For dense tropical forests, users may consider raising the beam sensitivity threshold (e.g., 0.98) to minimize measurement error in the RH metrics. In future versions, quality filtering will be improved by using the beam sensitivity together with the expected level of canopy cover for each shot.
Some users may wish to also evaluate the predictor_limit_flag and response_limit_flag. These identify shots with RH metrics or AGBD predictions, respectively, that are outside the observed range of values used to train the GEDI04_A models. Care should be taken when using such observations.
What are the units of xvar, and why doesn’t xvar match the relative height metrics in a corresponding GEDI02_A file?
The variables called xvar in the BEAMXXXX group and xvar_aN in the BEAMXXXX/agbd_prediction group are the scaled and transformed RH metrics used to generate the AGBD prediction for a given estimator and prediction stratum. GEDI_04A estimators are linear statistical models with a square root or natural logarithm transformation on the response or predictor variables. The appropriate transformation for the given estimator has been applied to GEDI_02A RH metrics to generate xvar and is indicated by the x_transform and y_transform variables in the ANCILLARY / model_data compound dataset. This transformation is applied after adding predictor_offset to the RH metrics. The predictor_offset is added because RH metrics can be negative when a large percentage of waveform energy is within the ground return. Because the square root and natural logarithm of a negative number are undefined, adding a large positive constant is necessary. For example, if a given estimator used a square root transformation, predictor_offset = 100, and the true RH metric had a value of 20, the number in xvar would be:
xvar = √ (20+100)
What is the relationship between rh_index, predictor_id, and par in the ANCILLARY / model_data compound dataset?
The vector par contains coefficients of the linear model used to predict AGBD, where the first element is the intercept and subsequent elements are slope coefficients. The vector rh_index is the height percentile associated with the given RH metric. The variable predictor_id provides a mapping between rh_index and par. For example, if predictor_id is:
predictor_ id = [1, 2, 3, 3, 0]
and rh_index is:
rh_ index = [50, 98, 50, 70, 0]
the associated estimator (ignoring transformations) would be:
AGBD = par[0] + par[1] x RH50 + par[2] x RH98 + par[3] x RH50 x RH70
Note that when the same predictor_id is associated with two rh_index values, it indicates that the product of two RH metrics was used in the given linear model. Note also that par[0] is always the intercept term.
How can I derive prediction intervals at a different confidence level?
The GEDI L4A product provides the standard error of the prediction and the lower/upper prediction intervals for every estimate. The default confidence level used for these intervals is 90%; however, some users may wish to specify their own confidence level. The general formula of a prediction interval for a new observation is:
estimate ± (standard error x t-multiplier)
where the estimate is the sample prediction in transform space (agbd_t in Table 1) and standard error is the standard error of the prediction in transform space (see agbd_t_se in Table 1). The t-multiplier (t1-α/2,dof) can be derived using standard libraries in R or Python and depends on: (1) the degrees-of-freedom for the applied model (dof), which is provided in the L4A product (ANCILLARY / model_data / dof); and (2) the t-distribution probability (α) which is specified by the BEAMXXXX / agbd_prediction group attribute alpha and may be modified by the user. For example, an alpha value of 0.1 is used for a 90% confidence level and 0.05 for a 95% confidence level.
Note that the prediction intervals described above are in transform space and need to be back-transformed to place estimates in units of aboveground biomass density. A correction also needs to be applied to account for bias introduced by a transformation of the response variable (agbd). For example, if ANCILLARY / model_data/y_transform is “sqrt” and ANCILLARY / model_data/bias_correction_name is “Snowdon”, then
agbd = agbd_t2 * ANCILLARY/model_data/bias_correction_value
If ANCILLARY/model_data/y_transform is “exp” and ANCILLARY/model_data/bias_correction_name is “Baskerville”, then
agbd=exp(agbd_t) * exp(ANCILLARY/model_data/bias_correction_value)
Data Access
These data are available through the Oak Ridge National Laboratory (ORNL) Distributed Active Archive Center (DAAC).
GEDI L4A Footprint Level Aboveground Biomass Density, Version 2.1
Contact for Data Center Access Information:
- E-mail: uso@daac.ornl.gov
- Telephone: +1 (865) 241-3952
References
Blair, J.B., and M.A. Hofton. 1999. Modeling laser altimeter return waveforms over complex vegetation using high-resolution elevation data. Geophysical Research Letters 26:2509–2512. https://doi.org/10.1029/1999GL010484
Drake, J.B., R.O. Dubayah, R.G. Knox, D.B. Clark, and J.B. Blair. 2002. Sensitivity of large-footprint lidar to canopy structure and biomass in a neotropical rainforest. Remote Sensing of Environment 81:378–392. https://doi.org/10.1016/S0034-4257(02)00013-5
Dubayah, R., J.B. Blair, S. Goetz, L. Fatoyinbo, M. Hansen, S. Healey, M. Hofton, G. Hurtt, J. Kellner, S. Luthcke, J. Armston, H. Tang, L. Duncanson, S. Hancock, P. Jantz, S. Marselis, P.L. Patterson, W. Qi, and C. Silva. 2020. The Global Ecosystem Dynamics Investigation: High-resolution laser ranging of the Earth’s forests and topography. Science of Remote Sensing 1:100002. https://doi.org/10.1016/j.srs.2020.100002
Friedl, M.A., D.K. McIver, J.C.F. Hodges, X.Y. Zhang, D. Muchoney, A.H. Strahler, C.E. Woodcock, S. Gopal, A. Schneider, A. Cooper, A. Baccini, F. Gao, and C. Schaaf. 2002. Global land cover mapping from MODIS: algorithms and early results. Remote Sensing of Environment 83:287–302. https://doi.org/10.1016/S0034-4257(02)00078-0
Friedl, M.A., D. Sulla-Menashe, B. Tan, A. Schneider, N. Ramankutty, A. Sibley, and X. Huang. 2010. MODIS Collection 5 global land cover: Algorithm refinements and characterization of new datasets. Remote Sensing of Environment 114:168–182. https://doi.org/10.1016/j.rse.2009.08.016
Hancock, S., J. Armston, M. Hofton, X. Sun, H. Tang, L.I. Duncanson, J.R. Kellner, and R. Dubayah. 2019. The GEDI Simulator: A Large–Footprint Waveform Lidar Simulator for Calibration and Validation of Spaceborne Missions. Earth and Space Science 6:294–310. https://doi.org/10.1029/2018EA000506
Hansen, M.C., P.V. Potapov, R. Moore, M. Hancher, S.A. Turubanova, A. Tyukavina, D. Thau, S.V. Stehman, S.J. Goetz, T.R. Loveland, and A. Kommareddy. 2013. High-resolution global maps of 21st-century forest cover change. Science, 342(6160):850-853. https://doi.org/10.1126/science.1244693
Hofton, M.A., and J.B. Blair. 2020. Algorithm Theoretical Basis Document (ATBD) for GEDI Transmit and Receive Waveform Processing for L1 and L2 Products. Goddard Space Flight Center, Greenbelt, MD. https://doi.org/10.5067/DOC/GEDI/GEDI_WF_ATBD.001
Kellner, J.R., J. Armston, and L. Duncanson. 2022. Algorithm theoretical basis document for GEDI footprint aboveground biomass density. Earth and Space Science, 9, e2022EA002516. https://doi.org/10.1029/2022EA002516
Mayr, E., 1944. Wallace’s Line in the Light of Recent Zoogeographic Studies. The Quarterly Review of Biology 19:1–14. https://doi.org/10.1086/394684
Dataset Revisions
| Version | Release Date | Description |
|---|---|---|
| 2.1 | 2025-04-10 | This release adds new files for mission weeks 281 through 311 (2024-04-26 through 2024-11-27). No acquisitions occurred while the GEDI instrument was in storage on the International Space Station (ISS) from March 2023 to April 2024. |
| 2.1 | 2025-01-29 | In this update, 23 granules from 6 orbits were renamed to reflect corrected reference ground track (RGT) numbers. No science data was affected. Specifically, granules with track number 01461 (T01461) from orbit 09360 (O09360) were renamed to track number 01614 (T01614). For example, the granule GEDI04_A_2020220033908_O09360_02_T01461_02_002_02_V002.h5 was renamed to GEDI04_A_2020220033908_O09360_02_T01614_02_002_02_V002.h5. Additionally, the following tracks were renamed: track T11164 from orbit O16529 was renamed to T11011, track T08166 from orbit O16530 was renamed to T09436, track T06592 from orbit O16532 was renamed to T10861, track T08016 from orbit O16533 was renamed to T09286, and track T10863 from orbit O16534 was renamed to T06441. |
| 2.1 | 2023-11-03 | A processing issue affected 8 granules from the orbits 9899 and 17591. This release replaces the affected granules (listed in the companion file list_of_deleted_files_orbits_17591_09899.txt) with revised ones. The revised granules are indicated with a different production version and listed in the companion file list_of_revised_files_orbits_17591_09899.txt |
| 2.1 | 2023-09-07 | This release adds new files for mission weeks 211 through 223 (2022-12-22 through 2023-03-16). |
| 2.1 | 2023-04-02 | This release adds new files for mission weeks 203 through 210 (2022-10-26 through 2022-12-22). |
| 2.1 | 2023-03-04 | This release adds new files for mission weeks 195 through 202 (2022-09-02 through 2022-10-25). |
| 2.1 | 2023-02-22 | This release adds new files for mission weeks 183 through 194 (2022-06-09 to 2022-09-01). |
| 2.1 | 2023-02-09 | A processing issue affected 376 granues from mission weeks 163 through 182, which caused the geolocation iteration refinement not to be applied. This release replaces the affected granules (listed in the companion file list_of_deleted_files_mw_163_182.txt) with revised ones. The revised granules are indicated with a different production version and listed in the companion file list_of_revised_files_mw_163_182.txt |
| 2.1 | 2022-11-07 |
This release adds new files for mission weeks 175 through 182 (2022-04-14 to 2022-06-09). |
| 2.1 | 2022-08-26 |
This release adds new files for mission week 167 (2022-02-17 to 2022-02-23) and mission weeks 170 through 174 (2022-03-17 to 2022-04-13). |
| 2.1 | 2022-08-02 |
This release adds new files for mission weeks 163 through 170 (2022-01-20 to 2022-03-17) except for mission week 167. The GEDI Science Operations Center (SOC) at Goddard started processing GEDI L4A granules starting mission week 163. Previously, they were processed at the University of Maryland. |
| 2.1 | 2022-05-29 |
This release adds new files for mission weeks 155 through 162 (2021-11-26 to 2022-01-20). |
| 2.1 | 2022-03-17 |
This release provides corrected estimates of aboveground biomass density (AGBD) and other associated variables for algorithm setting group 10 reported by some shots in the previous release, and also fixes the issue with duplicate shots affecting granules for selected days (2020-297 to 2020-300, 2020-365, and 2021-106) |
| 2.0 | 2021-12-15 | In this release, the algorithm setting group selection was modified for Evergreen Broadleaf Trees in South America to reduce false-positive errors resulting from the selection of waveform modes above ground elevation as the lowest mode. The region class has been updated to correct boundary errors and to include the islands of Micronesia and Polynesia in the Australia and Oceania region class. Also, the granules are in suborbits. In Version 1, one orbit was one file. It is not straightforward to link Version1 and Version 2 data granules because the variable shot_number format changed, and the number of shots in a granule changed as a result of the switch to sub-orbit granules and removal of laser off periods in Version 2 |
| 1.1 | 2022-02-15 | This dataset consists of the golden weeks (misson weeks 19, 32, 34, and 38) data from the GEDI L4A Version 1 dataset |
| 1.0 | 2019-09-09 | Initial release of the GEDI L4A data. Superseded and available only upon request |