Documentation Revision Date: 2020-08-25
Dataset Version: 1
Summary
Pre-Delta-X was a joint airborne and field campaign in the MRD beginning Spring 2015 and continuing through Fall 2016. The Pre-Delta-X campaign conducted airborne (remote sensing) observations and field (in situ) measurements to characterize delta hydrology, water quality (e.g., total suspended solids), and vegetation structure. These data facilitate the continued development of sampling methods, algorithms, and models to support the upcoming airborne and field campaigns (2021–2023) in support of the Delta-X mission.
There are 10 data files with this dataset in comma-separated value (.csv) format.

Figure 1. Water level pressure transducer field deployment. a) A total pressure transducer (TPT) to measure water level changes (Solinst; 6.25 in long). b) Installation of a TPT in shallow water within a PVC pipe. The pipe is embedded into the sediment with the TPT 20 cm above the bottom of the channel. c) Installation of a TPT in deep water attached to a concrete block. The TPT is protected inside the small black PVC pipe. The TPT must be above the block once sitting on the bottom of the channel. The rope is attached to a nearby tree or post for later retrieval. Source: Thomas et al. 2019
Citation
Simard, M., M.W. Denbina, D.J. Jensen, and R. Lane. 2020. Pre-Delta-X: Water Levels across Wax Lake Outlet, Atchafalaya Basin, LA, USA, 2016. ORNL DAAC, Oak Ridge, Tennessee, USA. https://doi.org/10.3334/ORNLDAAC/1801
Table of Contents
- Dataset Overview
- Data Characteristics
- Application and Derivation
- Quality Assessment
- Data Acquisition, Materials, and Methods
- Data Access
- References
Dataset Overview
This dataset provides absolute water level elevations derived for 10 locations across the Wax Lake Delta, Atchafalaya Basin, in Southern Louisiana, USA, within the Mississippi River Delta (MRD) floodplain. Field measurements were made during the Pre-Delta-X campaign on October 13–20, 2016. Relative water level measurements were recorded every five minutes during a one-week period using in situ pressure transducers (Solinst) to measure water surface elevation change with millimeter accuracy. The Solinst system combines a total pressure transducer (TPT) and a temperature detector. Once underwater, the TPT measures the sum of the atmosphere and water pressure above the sensor. Atmospheric pressure fluctuations must be accounted for to obtain the height of the water column above the TPT. An absolute elevation correction was applied to the water level data using an iterative approach with the USGS Calumet Station water level height and Airborne Snow Observatory (ASO) lidar water level profiles. These Pre-Delta-X water level measurements served to calibrate and validate the campaign's remote sensing observations and hydrodynamic models.
Pre-Delta-X was a joint airborne and field campaign in the MRD beginning Spring 2015 and continuing through Fall 2016. The Pre-Delta-X campaign conducted airborne (remote sensing) observations and field (in situ) measurements to characterize delta hydrology, water quality (e.g., total suspended solids), and vegetation structure. These data facilitate the continued development of sampling methods, algorithms, and models to support the upcoming airborne and field campaigns (2021–2023) in support of the Delta-X mission.
Project: Delta-X
The Delta-X mission is a NASA Earth Venture Suborbital-3 mission to study the Mississippi River Delta in the United States, which is growing and sinking in different areas. River deltas and their wetlands are drowning as a result of sea level rise and reduced sediment inputs. The Delta-X mission will determine which parts will survive and continue to grow, and which parts will be lost. Delta-X begins with airborne and in situ data acquisition and carries through data analysis, model integration, and validation to predict the extent and spatial patterns of future deltaic land loss or gain.
Related Publication
Thomas, N., M. Simard, E. Castañeda-Moya, K. Byrd, L. Windham-Myers, A. Bevington, and R.R. Twilley. 2019. High-resolution mapping of biomass and distribution of marsh and forested wetlands in southeastern coastal Louisiana. International Journal of Applied Earth Observation and Geoinformation, 80:257–267. https://doi.org/10.1016/j.jag.2019.03.013
Related Datasets
Additional Pre-Delta-X datasets are available on the ORNL DAAC Delta-X project page.
Acknowledgment
This work was supported by the Delta-X mission (funded under the NASA Earth Venture Suborbital-3 program) and Jet Propulsion Laboratory Strategic Research and Technology Development (JPL-R&TD) FY17–19.
Data Characteristics
Spatial Coverage: Wax Lake and Atchafalaya Deltas, Mississippi River Delta (MRD) floodplain, southern coast of Louisiana, USA
Spatial Resolution: Points
Temporal Coverage: 2016-10-13 to 2016-10-20
Temporal Resolution: One-time measurements
Site Boundaries: Latitude and longitude are given in decimal degrees.
| Site | Westernmost Longitude | Easternmost Longitude | Northernmost Latitude | Southernmost Latitude |
|---|---|---|---|---|
| Atchafalaya Basin | -91.44601111 | -91.3573 | 29.74290002 | 29.5057003 |
Data File Information
There are 10 data files in comma-separated value (.csv) format. The files provide water level measurements at 10 locations along the Wax Lake Delta in Louisiana. The files are named PreDeltaX_WaterLevel_Atchafalaya_WLZ.csv where Z is 01-10.
User Note: A few water level gauges needed to be moved partway through the measurement period; therefore, some gauges cover a smaller time range than others.
Table 1. Variable names and descriptions.
| Variable | Units | Description |
|---|---|---|
| basin | Atchafalaya | |
| site_id | Water gauge identification in order of installation (e.g., Wax_Lake_1) | |
| latitude | decimal degrees | Latitude of site |
| longitude | decimal degrees | Longitude of site |
| bias | m | Difference between GPS & TPT-derived water level in meters; missing values are denoted by -9999 |
| calibration_source | Lidar dataset ID, GPS ID, or both | |
| time | YYYY-MM-DD hh:mm:ss | Time of sampling in UTC; 5 min interval |
| absolute_water_level_NAVD88 | m | Absolute water level elevation in meters with respect to the orthometric NAVD88 vertical datum; the relative water level gauge measurements were corrected using the estimated offset between each gauge height and the NAVD88 vertical datum |
| absolute_water_level_WGS84 | m | Absolute water level elevation in meters with respect to the ellipsoidal WGS84 vertical datum; the relative water level gauge measurements were corrected using the estimated offset between each gauge height and the ellipsoidal WGS84 vertical datum |
Application and Derivation
The in situ locations for water level gauges were chosen to cover the geographical domains of the hydrodynamic models and represent a variety of settings in the channels. These water level measurements will serve to calibrate and validate Delta-X remote sensing observations and hydrodynamic models.
Quality Assessment
The TPT recorded relative water level within 1 mm, and the water level gauge data exhibited some small jitters in water level, generally less than 1 cm. To mitigate this, the data were smoothed in time (55 min) using a third-order Savitzky-Golay filter with a window of 11 samples. The TPT data were opened and processed within the Data Analysis Software, along with related barometric data to compensate for atmospheric pressure. The output was a time-series of relative water level changes. Three of the 10 water level gauges were also surveyed upon installation for bias with GPS. However, these data were not used for final calibration as lidar was found to be more stable.
Data Acquisition, Materials, and Methods
Study Area
The study area was the Atchafalaya and Terrebonne Basins on the southern coast of Louisiana within the Mississippi River Delta (MRD) floodplain (Figure 2). The Mississippi Delta formed as a series of overlapping lobes over the past 6000–7000 years and consists of two physiographic units, the Deltaic plain to the east and Chenier plain to the west. The deltaic plain contains the Atchafalaya River, a major distributary of the Mississippi River that dominates the study site and which terminates at the Wax Lake and Atchafalaya Deltas (Roberts, 1997). These deltas receive water and sediment discharge from the Atchafalaya River, which is maintained at 30% of the combined discharge of the Mississippi and Red Rivers. April is considered the early phase of the vegetation growing season and the peak of the spring river flood season. Several of the selected sites for field measurements are part of the Coastal Reference Monitoring System (CRMS, Steyer et al. 2003).
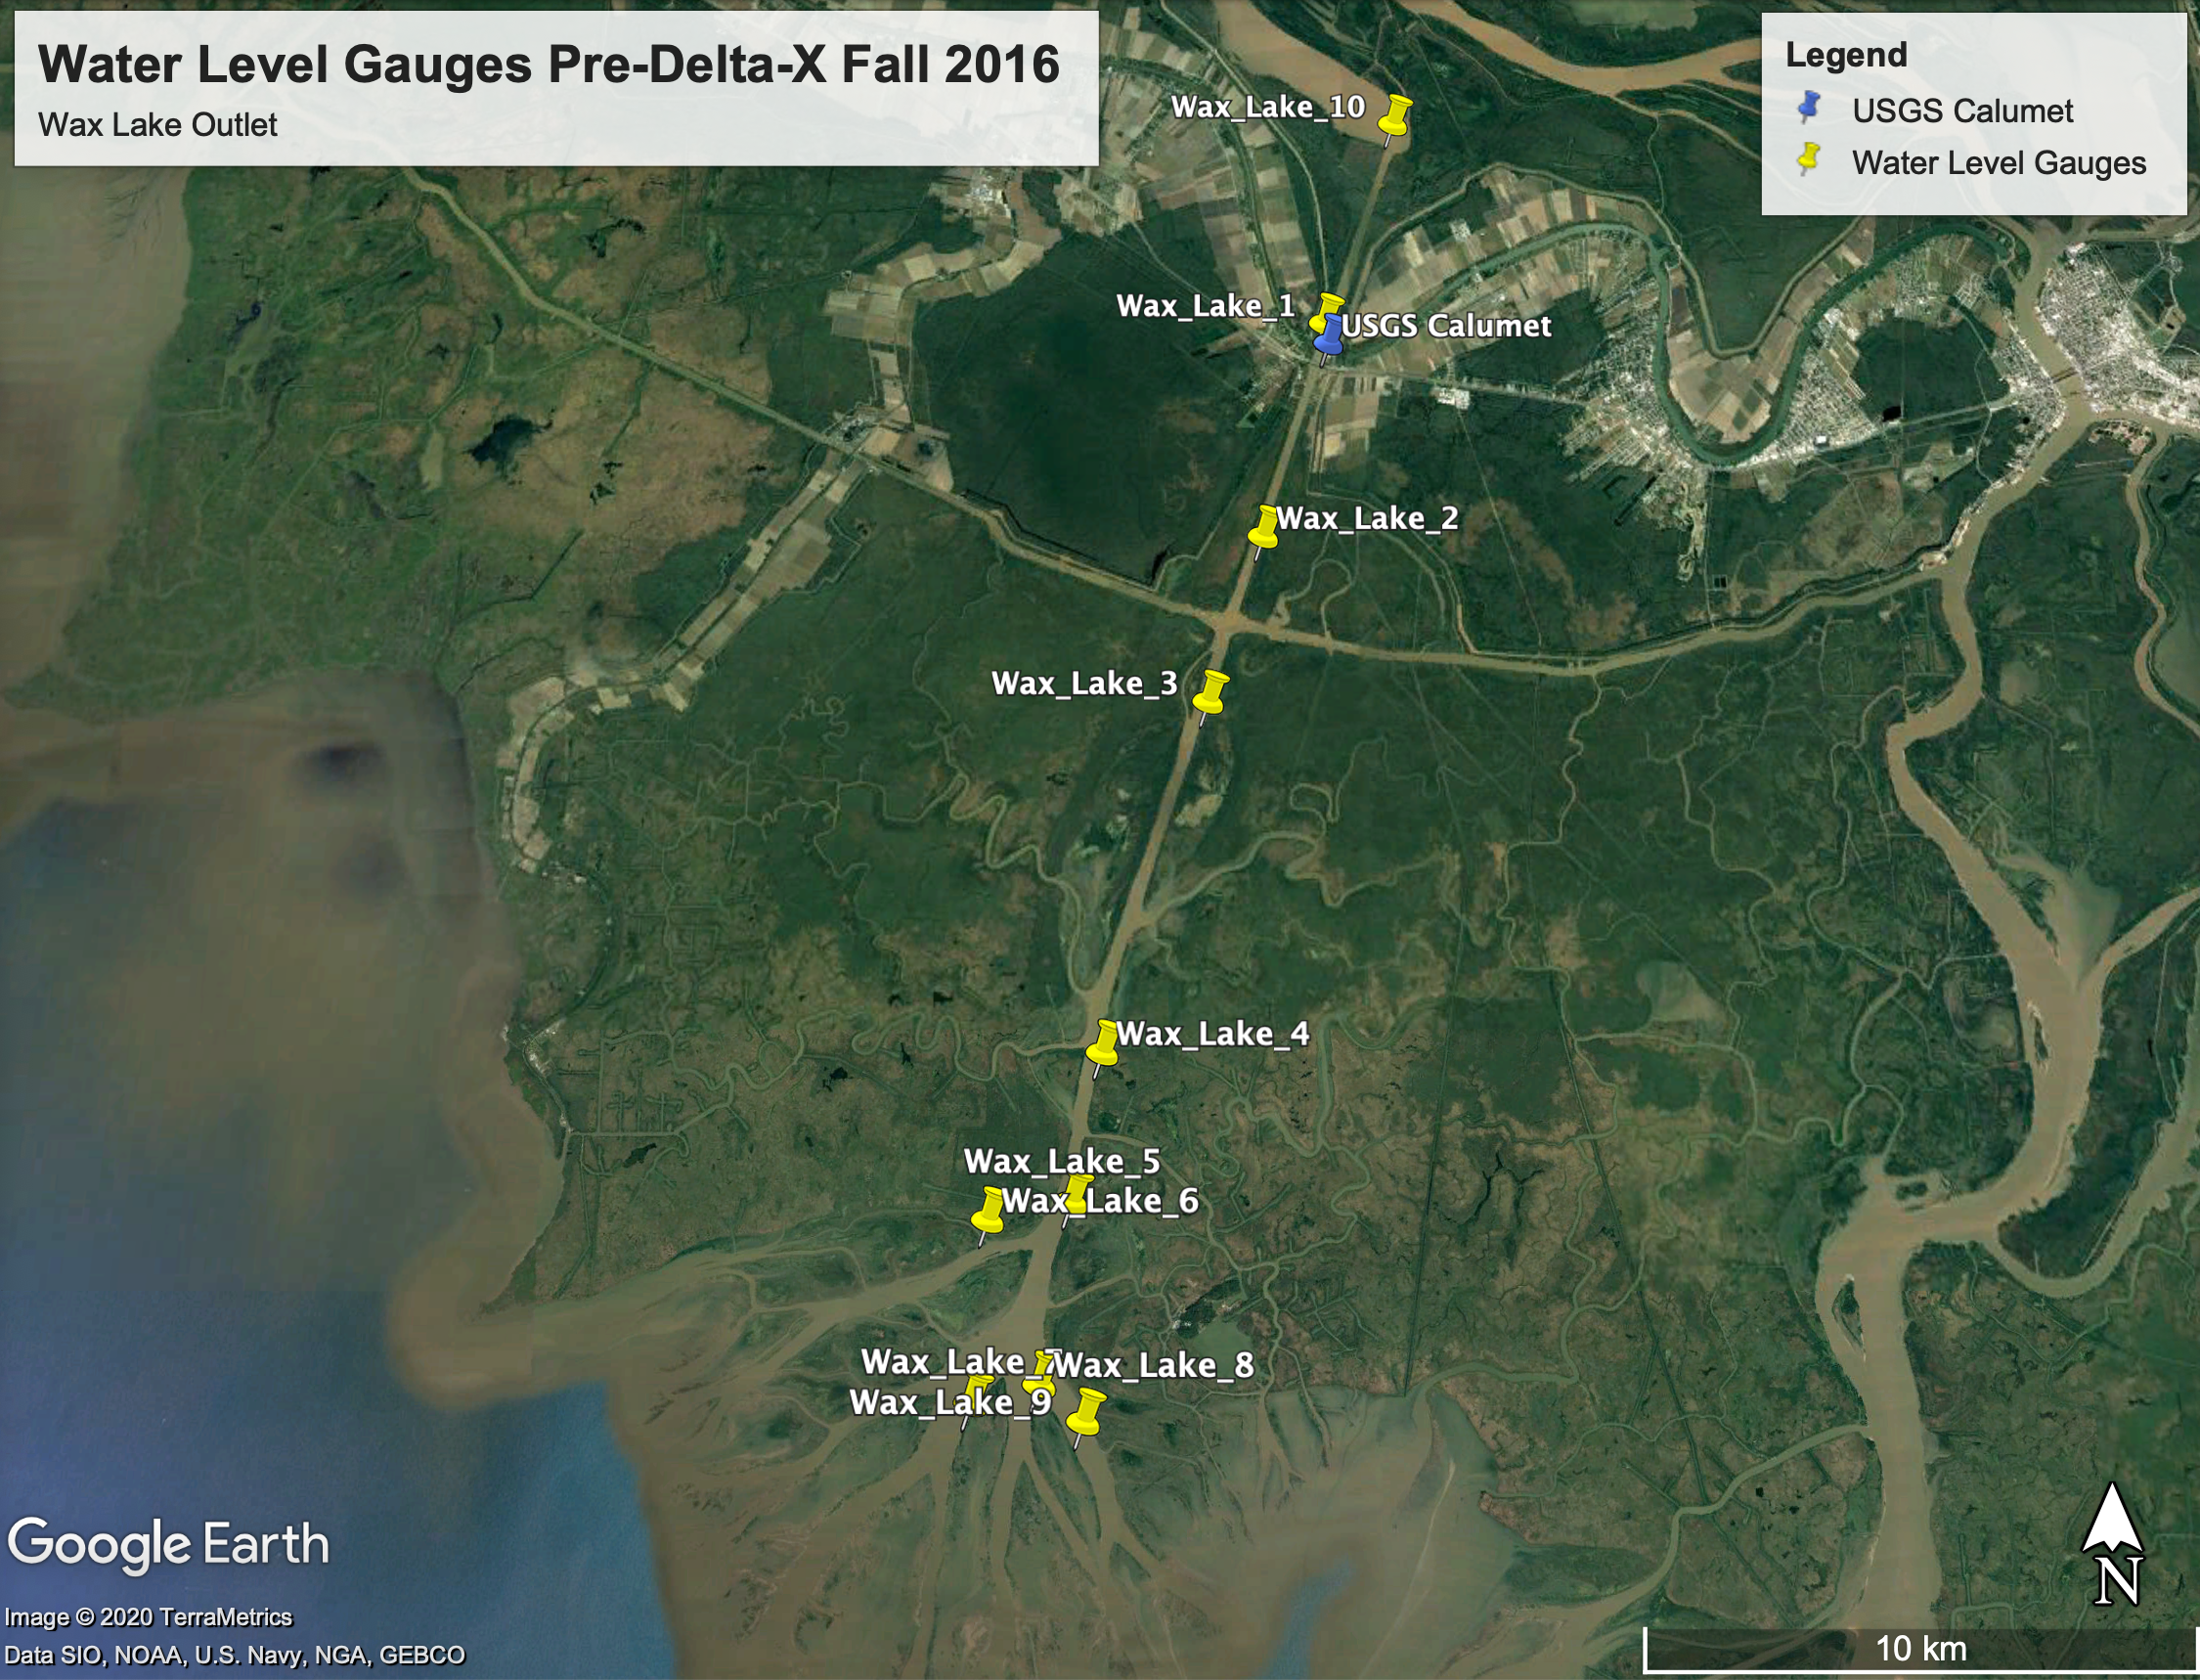
Figure 2. Map indicating the water level measurement locations.
Water Level Gauge System
The Pre-Delta-X campaign used a commercial water level gauge system from Solinst to measure variations in water level. Solinst’s water level gauge system measures water surface elevation changes with millimeter accuracy using pressure transducers and has four components: the underwater total pressure transducer or TPT (Levelogger EdgeTM 3001), an atmospheric barometer (BarologgerTM), a data extractor (Data Grabber TM) and analysis software (LeveloggerTM Software Data Compensation Wizard). The TPT combined a pressure sensor, temperature detector, 10-year lithium battery, and a datalogger to measure the sum of the atmosphere and water pressure above the sensor. To compensate for atmospheric fluctuations and obtain the height of the water column above the TPT, a barometer was installed above the maximum water level, typically attached with a rope in a tree, and measures the atmospheric pressure. A single barometer can be used to compensate for all TPT within tens of kilometers. The time-tagged TPT and barometer data were transferred with the data extractor device into a tablet or smartphone to be used in the analysis software. The barometer measurements were used to compensate for the TPT measurements within the analysis software.
Water Level Gauge Installation
The water level gauges were installed at 10 sites across the Wax Lake Outlet to make in situ field-measurements of water level changes during the campaign (Thomas et al., 2019) (Figure 1). The total pressure transducers or TPT were installed within a 4 in diameter and 7 ft long PVC pipe. Holes were drilled along the pipe to let water circulate. The PVC pipe was inserted about 3 ft deep into the soil. A rope passed through a hole drilled in a PVC screw-cap was used to hold the TPT about 20 cm above soil, while protecting the device against currents and bio-foul. TPTs installed in deeper channels were wrapped into a pipe insulant to restrain movements and inserted into a 2 in PVC pipe. A few water level gauges needed to be moved partway through the experiment, therefore, some gauges cover a smaller time range than others.
Absolute Water Height Correction
Data quality was assessed through global optimization based on the matrix of water level gauges and comparison with remotely sensed data collected at different times (Denbina and Simard, 2020). Water level gauge data indicate relative changes in water level height and are not referenced to a vertical datum. To find absolute water level or water level relative to the NAVD88 and WGS84 datums, the water level gauge measurements were corrected using the estimated offset between each gauge height and the desired vertical datum. The absolute water level calibration was performed by post-processing and comparison with 1) the USGS water level station at Calumet, and 2) multi-temporal Airborne Snow Observatory (ASO) lidar measurements collected during the Fall 2016 campaign. The USGS Calumet water level station data, as well as multiple ASO lidar measurements of water surface elevation, were used to solve for a global solution to determine the consistency of the absolute water level estimate through time. The USGS Calumet Station was used as a reference for absolute water level, and overlapping ASO lidar flight lines were corrected with Calumet data. In turn, the corrected lidar flight lines were used to estimate the gauge versus vertical datum offset for water level gauges within the coverage area of the corrected lidar data. This approach continued iteratively until all gauges and lidar lines were corrected with estimated offsets.
Data Access
These data are available through the Oak Ridge National Laboratory (ORNL) Distributed Active Archive Center (DAAC).
Pre-Delta-X: Water Levels across Wax Lake Outlet, Atchafalaya Basin, LA, USA, 2016
Contact for Data Center Access Information:
- E-mail: uso@daac.ornl.gov
- Telephone: +1 (865) 241-3952
References
Denbina, M., and M. Simard. 2020. Calibration of airborne measurements of water surface elevation in coastal wetlands. In preparation.
Roberts, H.H. 1997. Dynamic changes of the Holocene Mississippi River delta plain: The delta cycle. Journal of Coastal Research, 605–627. https://www.jstor.org/stable/4298659
Thomas, N., M. Simard, E. Castañeda-Moya, K. Byrd, L. Windham-Myers, A. Bevington, and R.R. Twilley. 2019. High-resolution mapping of biomass and distribution of marsh and forested wetlands in southeastern coastal Louisiana. International Journal of Applied Earth Observation and Geoinformation, 80:257–267. https://doi.org/10.1016/j.jag.2019.03.013