Documentation Revision Date: 2021-04-05
Dataset Version: 1
Summary
Pre-Delta-X was a joint airborne and field campaign in the Mississippi River Delta during Spring 2015 and Fall 2016. The Pre-Delta-X campaign conducted airborne remote sensing and field in situ measurements to observe hydrology, water quality (e.g., total suspended solids (TSS)), and vegetation structure. This data serves for the continued development of algorithms and models to support the upcoming Delta-X mission. The Delta-X algorithms are used to convert remote sensing observables to geophysical parameters, and the models are numerical hydrodynamic and ecological.
This dataset includes five files in geoTIFF (*.tiff) format.
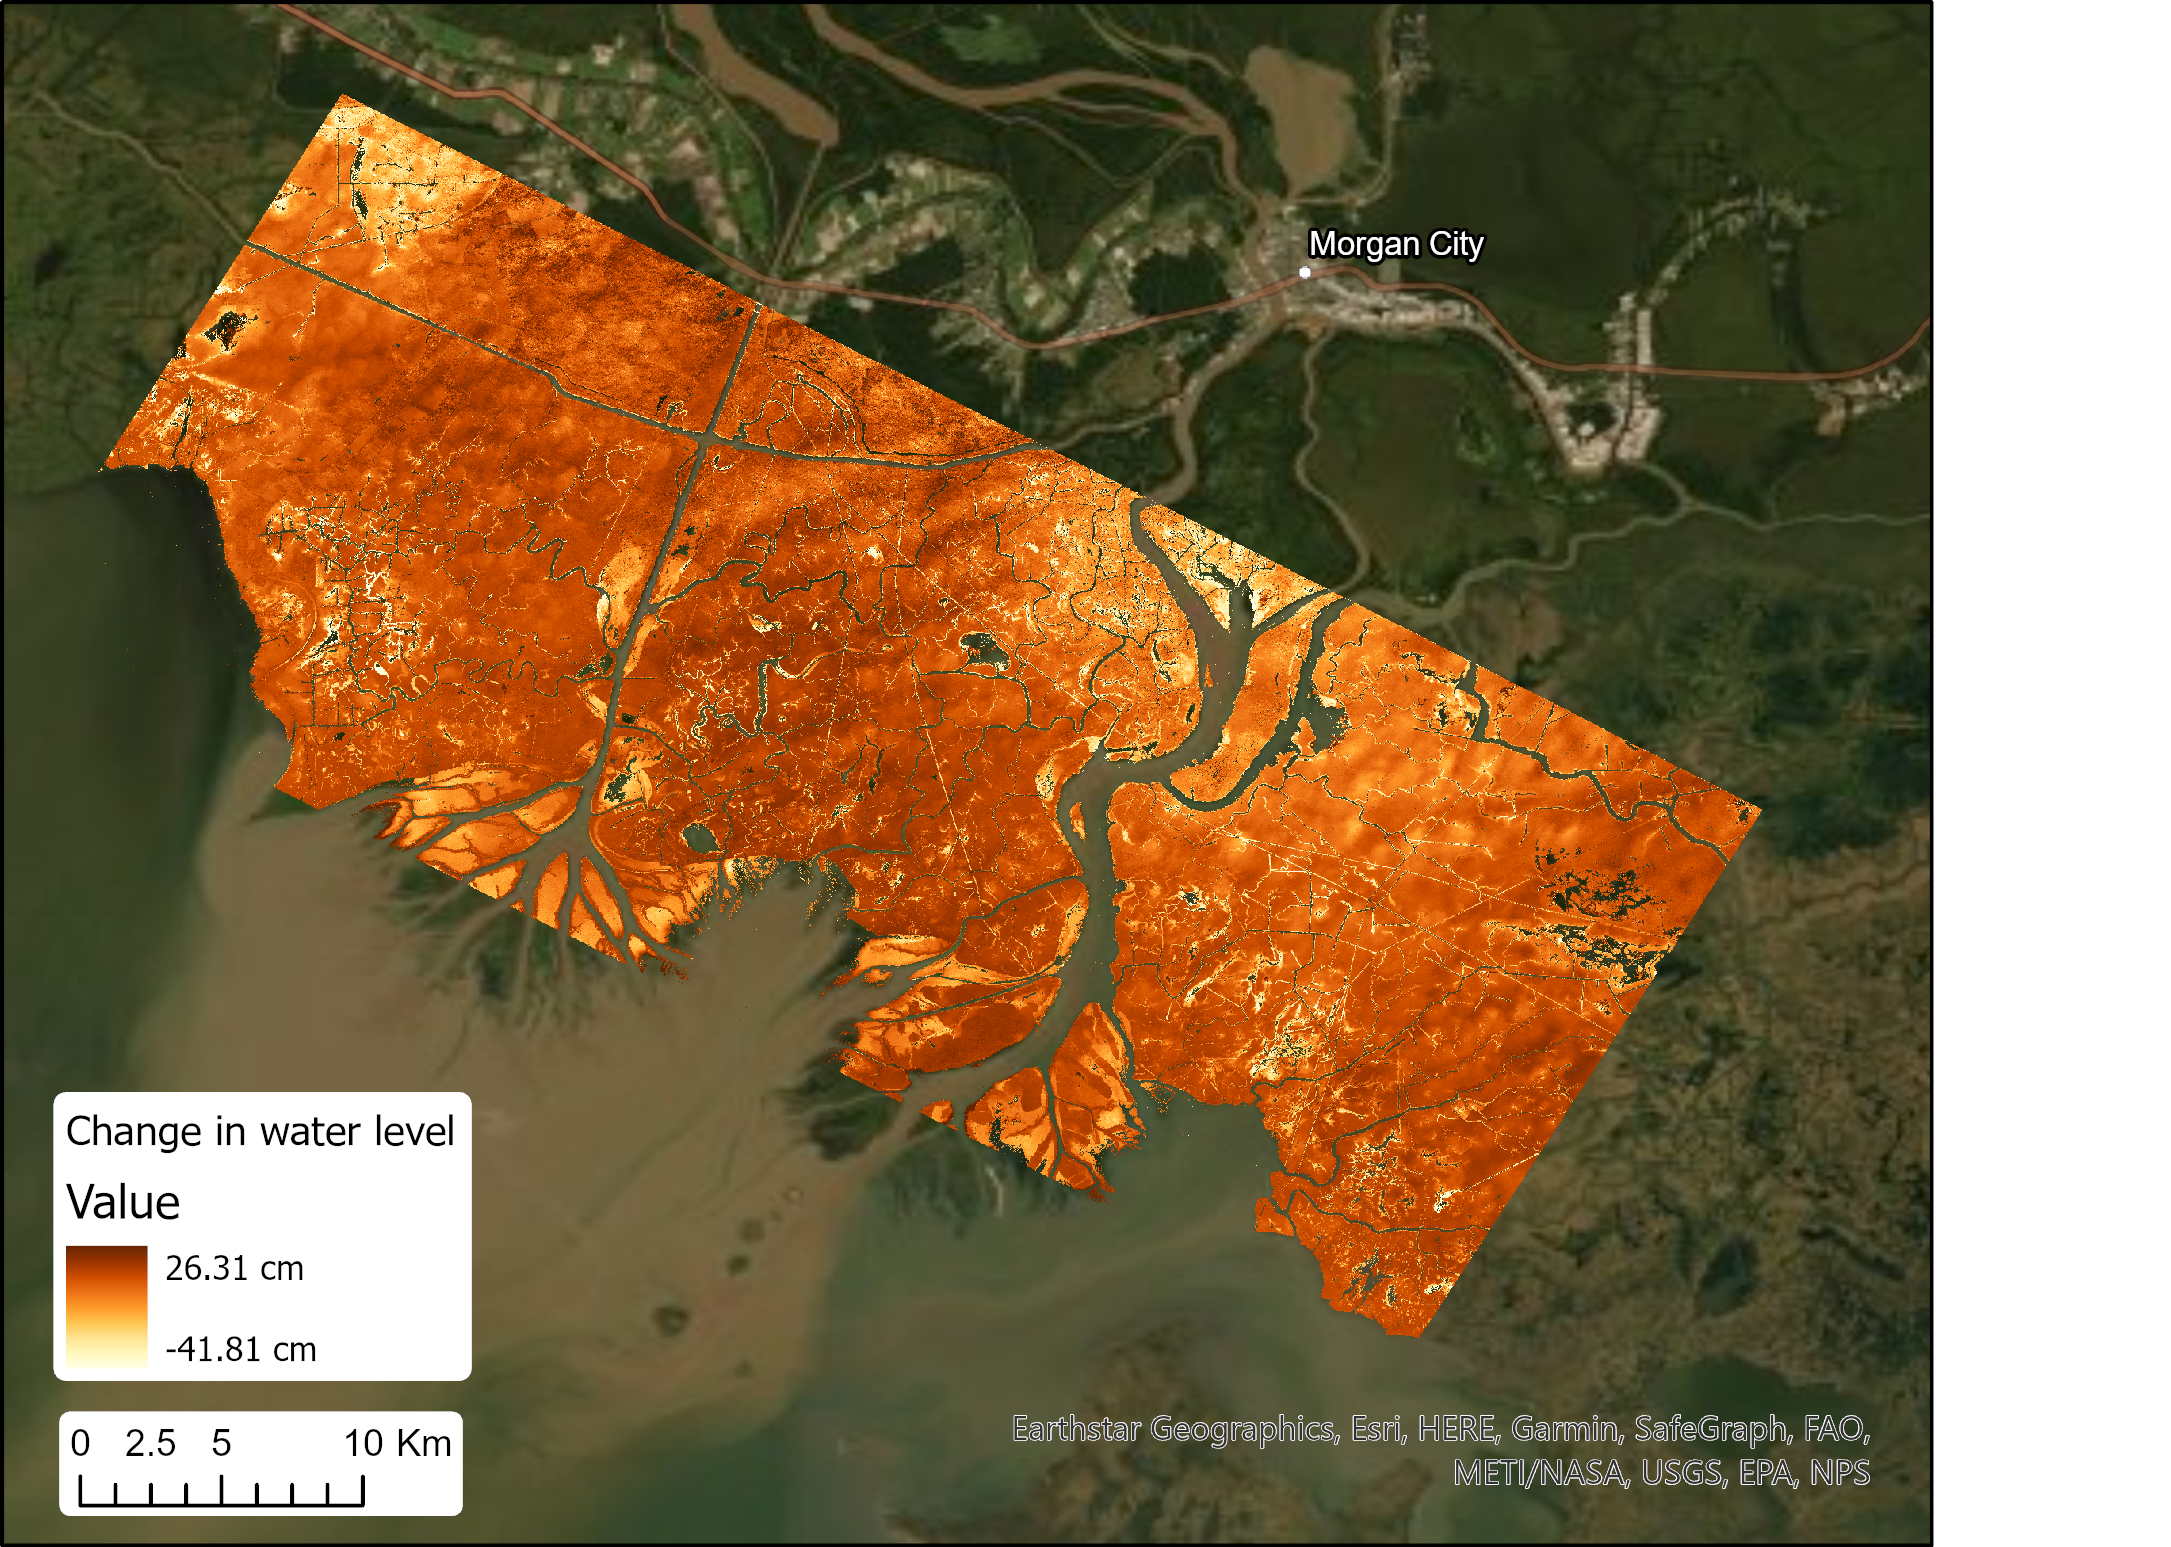
Figure 1. Map of water level changes based on water surface elevations measured by UAVSAR on October 16, 2016, at 14:08 and 16:37 UTC.
Citation
Jones, C., M. Simard, and Y. Lou. 2021. Pre-Delta-X: UAVSAR-derived Water Level Change Maps, Atchafalaya Basin, LA, USA, 2016. ORNL DAAC, Oak Ridge, Tennessee, USA. https://doi.org/10.3334/ORNLDAAC/1823
Table of Contents
- Dataset Overview
- Data Characteristics
- Application and Derivation
- Quality Assessment
- Data Acquisition, Materials, and Methods
- Data Access
- References
Dataset Overview
This dataset contains five maps of cumulative changes in water levels at 30-minute intervals over a 150-minute period on 2016-10-16 in the Atchafalaya Basin in Southern Louisiana, USA, within the Mississippi River Delta (MRD) floodplain. Water surface elevations were measured on six flights at 30-minute intervals, with the Uninhabited Aerial Vehicle Synthetic Aperture Radar (UAVSAR), a polarimetric L-band synthetic aperture radar (SAR) flown on the NASA Gulfstream-III aircraft. The five georeferenced maps at 6 m resolution show the cumulative change of water levels (cm) every 30 minutes relative to the first sampling flight. These Level 3 maps were generated using the InSAR time series Small Baseline Subsets (SBAS) algorithm implemented in the Generic InSAR Analysis Toolbox (GIAnT) toolbox and served to evaluate and compare hydrodynamic models.
Pre-Delta-X was a joint airborne and field campaign in the Mississippi River Delta during Spring 2015 and Fall 2016. The Pre-Delta-X campaign conducted airborne remote sensing and field in situ measurements to observe hydrology, water quality (e.g., total suspended solids (TSS)), and vegetation structure. This data serves for the continued development of algorithms and models to support the upcoming Delta-X mission (2019-2023). The Delta-X algorithms are used to convert remote sensing observables to geophysical parameters, and the models are numerical hydrodynamic and ecological models.
Project: Delta-X
The Delta-X mission is a 5-year NASA Earth Venture Suborbital-3 mission to study the Mississippi River Delta in the United States, which is growing and sinking in different areas. River deltas and their wetlands are drowning as a result of sea level rise and reduced sediment inputs. The Delta-X mission will determine which parts will survive and continue to grow, and which parts will be lost. Delta-X begins with airborne and in situ data acquisition and carries through data analysis, model integration, and validation to predict the extent and spatial patterns of future deltaic land loss or gain.
Related Publication
Jensen, D., K. C. Cavanaugh, M. Simard, G. S. Okin, E. Castañeda-Moya, A. McCall, and R. R. Twilley. 2019. Integrating imaging spectrometer and synthetic aperture radar data for estimating wetland vegetation aboveground biomass in coastal Louisiana. Remote Sensing 11(21):2533. https://doi.org/10.3390/rs11212533
Related Dataset
Simard, M., M.W. Denbina, D.J. Jensen, and R. Lane. 2020. Pre-Delta-X: Water Levels across Wax Lake Outlet, Atchafalaya Basin, LA, USA, 2016. ORNL DAAC, Oak Ridge, Tennessee, USA. https://doi.org/10.3334/ORNLDAAC/1801
Acknowledgment
This work was supported by Jet Propulsion Laboratory Research and Technology Development (JPL-R&TD) FY17–19 (grants 01STCR / R.17.231.069).
Data Characteristics
Spatial Coverage: Atchafalaya Basin, Mississippi River Delta (MRD) floodplain, southern coast of Louisiana, USA
Spatial Resolution: 0.000063 degrees (approximately 6 m)
Temporal Coverage: 2016-10-16
Temporal Resolution: Five estimates at 30-minute intervals
Site Boundaries: Latitude and longitude are given in decimal degrees.
| Site | Westernmost Longitude | Easternmost Longitude | Northernmost Latitude | Southernmost Latitude |
|---|---|---|---|---|
| Atchafalaya Basin | -91.6220 | -91.0576 | 29.7583 | 29.3562 |
Data File Information
There are five data files in geoTiFF (*.tif) format that provide the change in water levels relative to the initial measurement of water surface elevation. The files are named PreDeltaX_wlc_gulfco_121011_1610161408_BBBBBBBBBB_01.tif where
wlc = water level change,
gulfco_121011 = UAVSAR line
1610161408 = date and time of the initial sample in YYMMDDhhmm, and
BBBBBBBBBB = date and time of the subsequent sample.
Table 1. File names and descriptions.
User Note: Change was computed as the difference in water-surface elevations (i.e., elevation_B – elevation_A).
| File Name | Units | Description |
|---|---|---|
| PreDeltaX_wlc_gulfco_12011_1610161408_1610161438_01.tif | cm | Change after 30 min |
| PreDeltaX_wlc_gulfco_12011_1610161408_1610161508_01.tif | cm | Change after 60 min |
| PreDeltaX_wlc_gulfco_12011_1610161408_1610161538_01.tif | cm | Change after 90 min |
| PreDeltaX_wlc_gulfco_12011_1610161408_1610161607_01.tif | cm | Change after 120 min |
| PreDeltaX_wlc_gulfco_12011_1610161408_1610161637_01.tif | cm | Change after 150 min |
Data File Details
- Spatial reference system: WGS 84 (EPSG:4326)
- Missing data value: -9999
Application and Derivation
Water surface elevation was measured using UAVSAR, a synthetic aperture radar instrument. The UAVSAR data were used to measure hydrological parameters, and the Level 3 water level change maps served to evaluate models of hydrodynamics in this river delta system.
Quality Assessment
Data quality was assessed by comparing water elevation estimates with data from in situ water level gauges throughout the study area. Residual errors were assessed through a scene-wide comparison of elevation estimates for sites above the high-water level. Pixels that lack data or which failed quality tests were marked with a “no data” value.
Data Acquisition, Materials, and Methods
Changes in water levels were mapped by taking the difference in water surface elevation between an initial sample and samples collected over the same area on the same day.
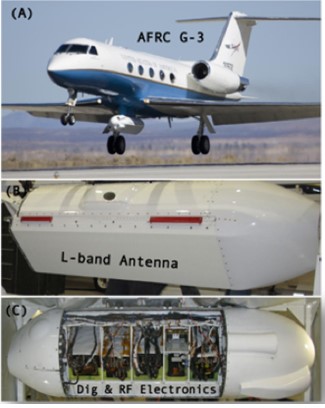
Figure 2. UAVSAR is flown on a Gulfstream-III aircraft, mounted in a pod hung below the fuselage.
UAVSAR is a polarimetric L-band synthetic aperture radar operating with 80 MHz bandwidth from 1217.5–1297.5 GHz designed for interferometry (InSAR) (Hensley et al., 2009). UAVSAR’s swath width is 22 km, which illuminates an area from 22°–67° incidence angle, with 3 m (cross-track average) by 1 m (along-track) single look ground resolution. The instrument was flown on a Gulfstream-III (C20) aircraft with the radar electronics and antenna housed in a pod mounted below the fuselage (Fig. 2).
The UAVSAR instrument was operated in its standard acquisition configuration, flown at an altitude of 12.5 km in quad-polarization mode, transmitting horizontally and vertically polarized radiation on alternate pulses and receiving both co-polarized (HH or VV) and cross-polarized (HV or VH) returns for each pulse.
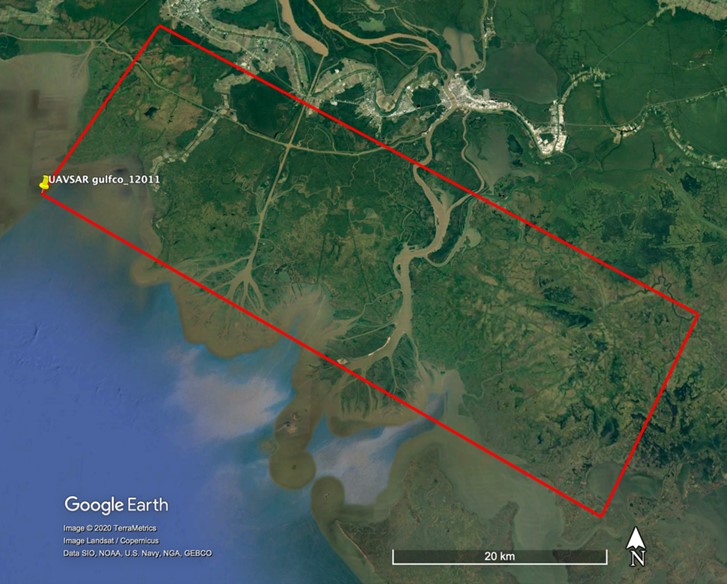
Figure 3. Map of the area sampled by UAVSAR on 2016-10-16.
On October 16, 2016, the UAVSAR line "gulfco_12011" was acquired 6 times in approximately 30-minute intervals (Fig. 3). This series of images was used to generate Level 3 water level change products. For the six acquisitions of this flight line, five water level change products were generated. The maps contain the cumulate water level change in centimeters between the first acquisition at time T1 and the nth acquisition at time Tn, where n = 2–6.
The unwrapped interferometric phase was generated using the open-source SNAPHU phase unwrapping code (Chen and Zebker, 2001), and georeferencing was done using code, provided by the UAVSAR processing team, that calls Geospatial Data Abstraction Library (GDAL) library functions (Warmerdam, 2008). The Level 3 water level change products were generated using the InSAR time series Small Baseline Subsets algorithm (Berardino et al., 2002) implemented in the GIAnT toolbox (Agram et al., 2013).
Data Access
These data are available through the Oak Ridge National Laboratory (ORNL) Distributed Active Archive Center (DAAC).
Pre-Delta-X: UAVSAR-derived Water Level Change Maps, Atchafalaya Basin, LA, USA, 2016
Contact for Data Center Access Information:
- E-mail: uso@daac.ornl.gov
- Telephone: +1 (865) 241-3952
References
Agram, P. S., R. Jolivet, B. Riel, Y. N. Lin, M. Simons, E. Hetland, M. Doin, and C. Lasserre. 2013. New Radar Interferometric Time Series Analysis Toolbox Released. Eos, Transactions American Geophysical Union 94:69–70. https://doi.org/10.1002/2013EO070001
Berardino, P., G. Fornaro, R. Lanari, and E. Sansosti. 2002. A new algorithm for surface deformation monitoring based on small baseline differential SAR interferograms. IEEE Transactions on Geoscience and Remote Sensing 40(11):2375–2383. https://doi.org/10.1109/TGRS.2002.803792
Chen, C. W. and H. A. Zebker. 2001. Two-dimensional phase unwrapping with use of statistical models for cost functions in nonlinear optimization. Journal of the Optical Society of America A 18:338. https://doi.org/10.1364/JOSAA.18.000338
Hensley, S., H. Zebker, C. Jones, T. Michel, R. Muellerschoen, and B. Chapman. 2009. First deformation results using the NASA/JPL UAVSAR instrument. Page 2009 2nd Asian-Pacific Conference on Synthetic Aperture Radar. IEEE. https://doi.org/10.1109/APSAR.2009.5374246
Jensen, D., K. C. Cavanaugh, M. Simard, G. S. Okin, E. Castañeda-Moya, A. McCall, and R. R. Twilley. 2019. Integrating imaging spectrometer and synthetic aperture radar data for estimating wetland vegetation aboveground biomass in coastal Louisiana. Remote Sensing 11(21):2533. https://doi.org/10.3390/rs11212533
Warmerdam, F. 2008. The Geospatial Data Abstraction Library. In G.B. Hall and M.G. Leahy (Eds). Open Source Approaches in Spatial Data Handling. Advances in Geographic Information Science 2. (pp. 87–104) Berlin, Heidelberg: Springer. https://doi.org/10.1007/978-3-540-74831-1_5