Documentation Revision Date: 2021-07-23
Dataset Version: 1
Summary
Pre-Delta-X was a joint airborne and field campaign in the MRD beginning Spring 2015 and continuing through Fall 2016. The Pre-Delta-X campaign conducted airborne remote sensing observations and field in situ measurements to characterize delta hydrology, water quality (e.g., total suspended solids), and vegetation structure. These data facilitate the continued development of sampling methods, algorithms, and models to support the upcoming airborne and field campaigns in support of the Delta-X mission.
This dataset consists of 48 files: 12 single look complex files (*.slc), 12 corresponding annotation files (*.ann), and 24 interferograms (*.int).
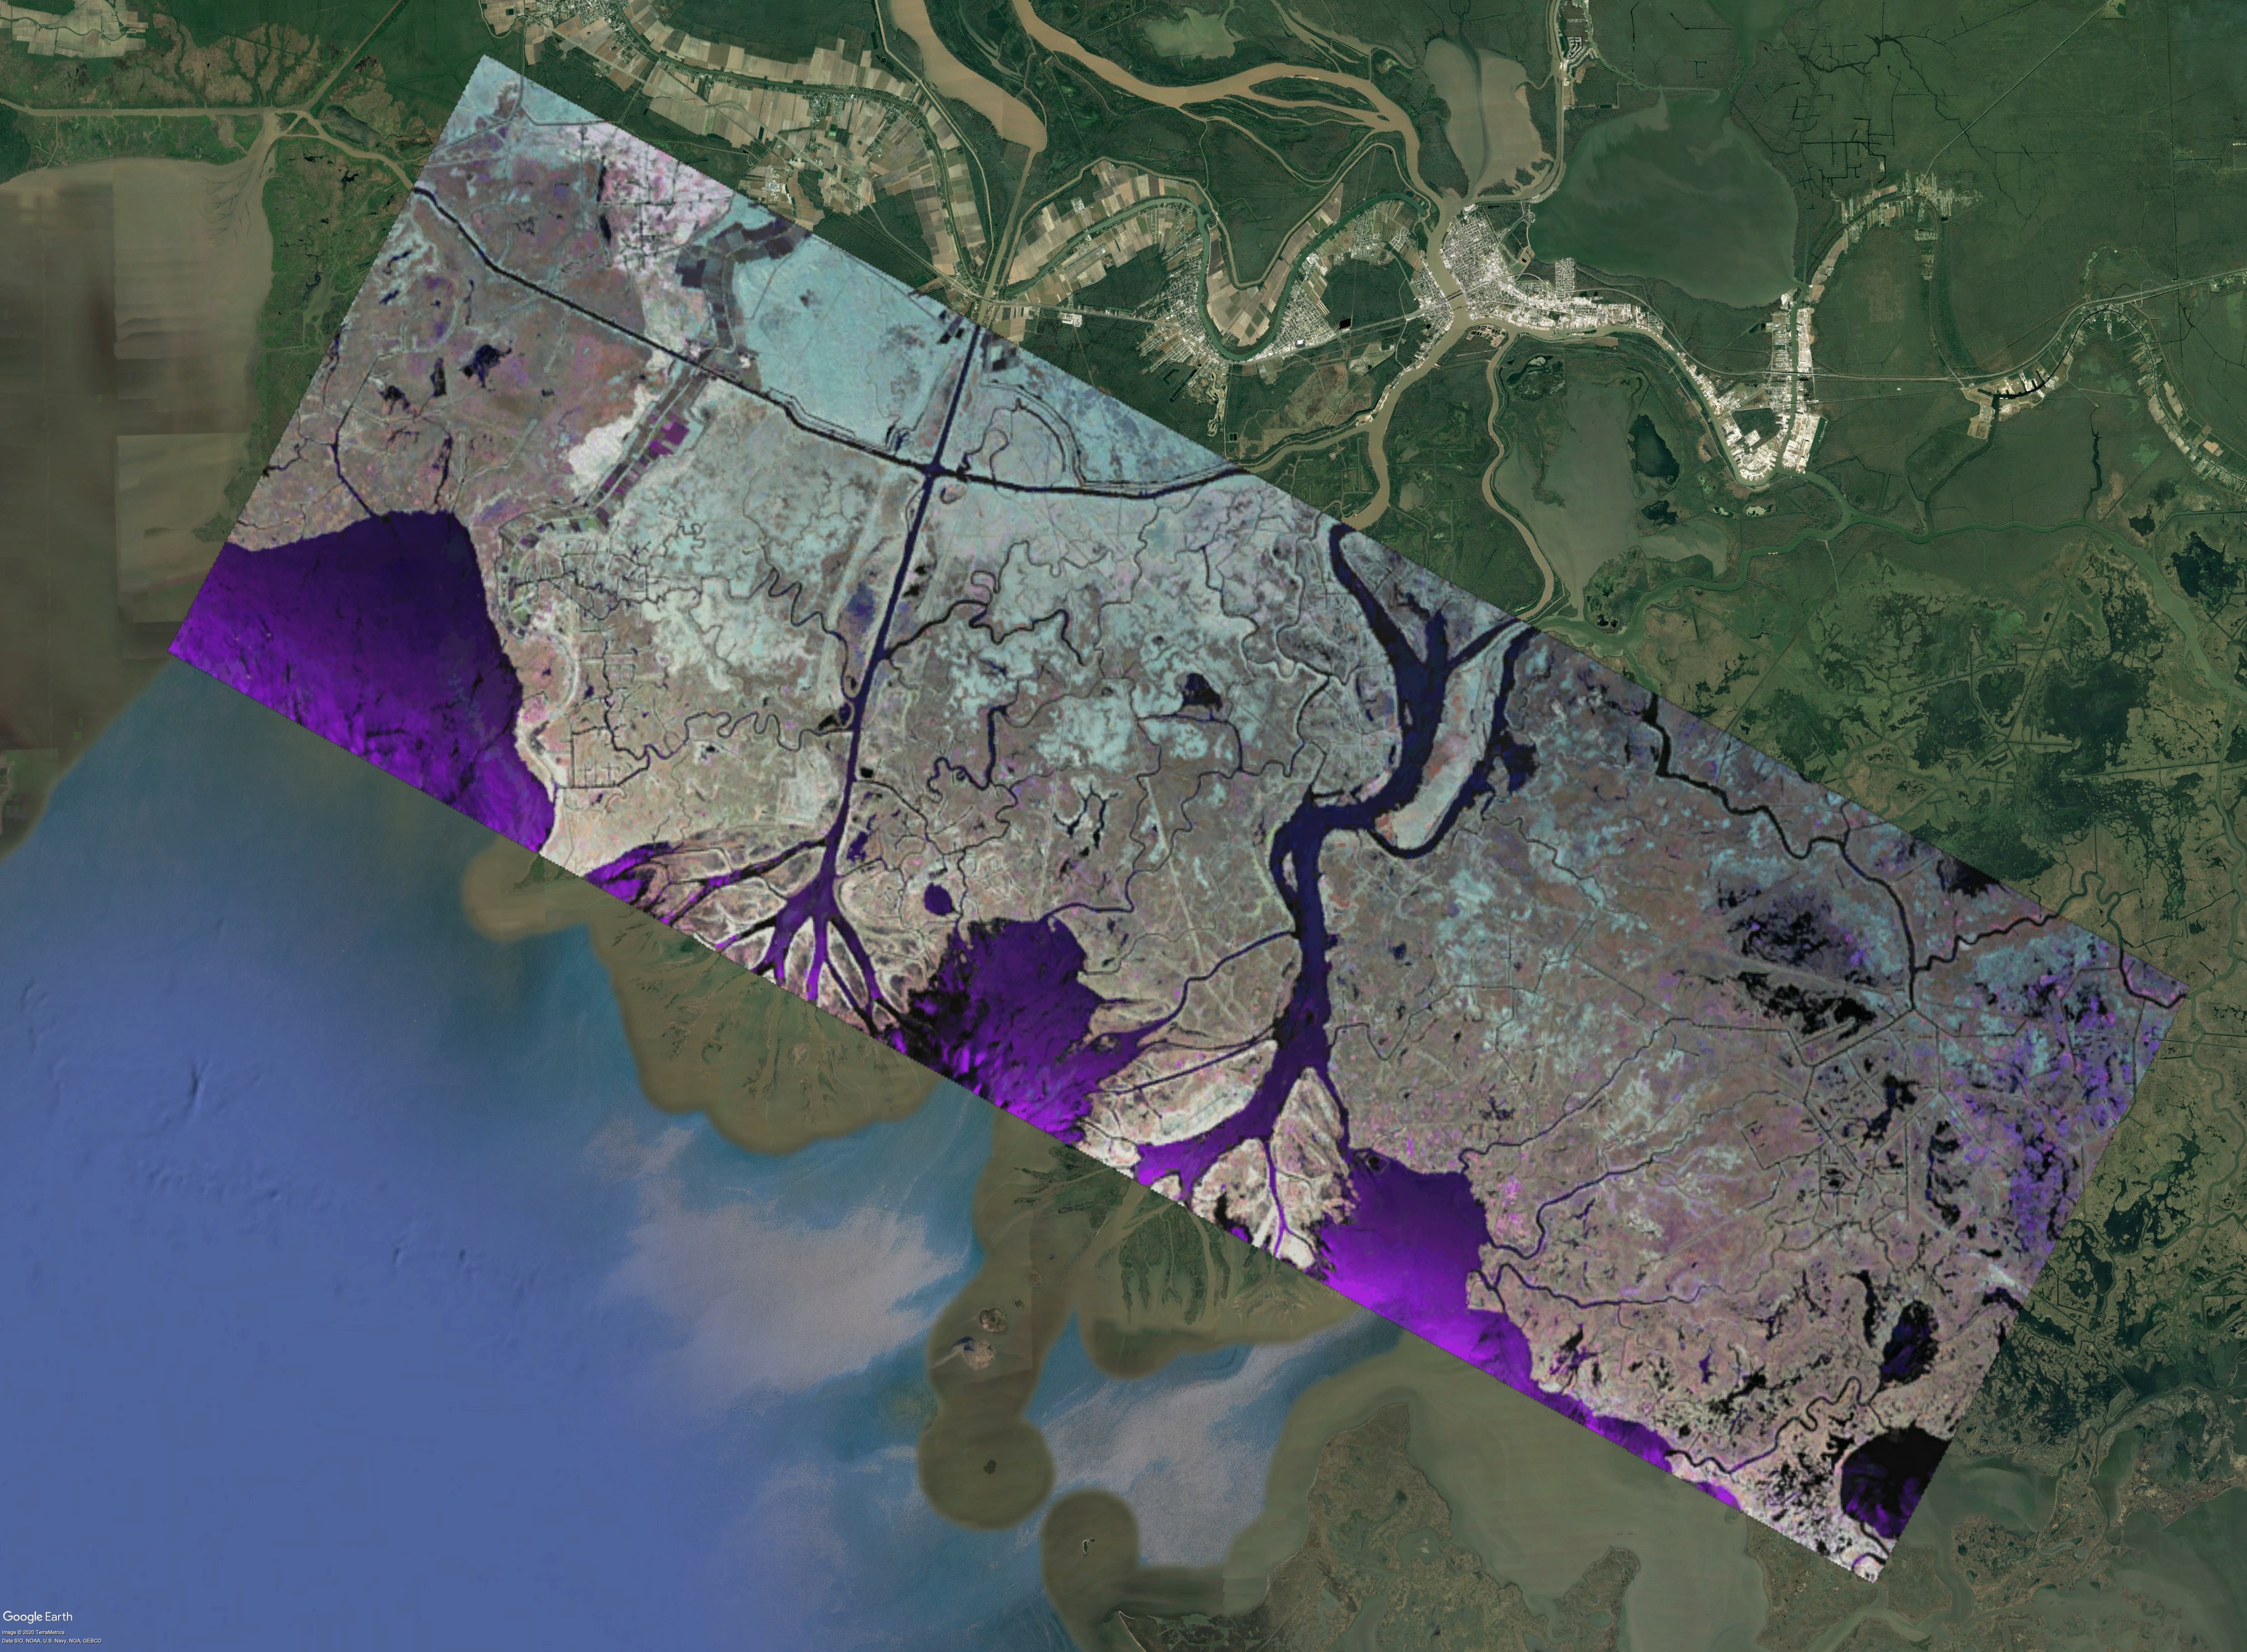
Figure 1. Region sampled by UAVSAR on flight line "gulfco_12011" on October 16, 2016, in coastal Louisiana. This flight line was sampled six times at approximately 30-minute intervals.
Citation
Jones, C., M. Simard, Y. Lou, and T. Oliver. 2021. Pre-Delta-X: L1 UAVSAR Single Look Complex and Interferograms, MRD, LA, USA, 2016. ORNL DAAC, Oak Ridge, Tennessee, USA. https://doi.org/10.3334/ORNLDAAC/1816
Table of Contents
- Dataset Overview
- Data Characteristics
- Application and Derivation
- Quality Assessment
- Data Acquisition, Materials, and Methods
- Data Access
- References
Dataset Overview
This Level 1 (L1) dataset includes single look complex (SLC) stack products and co-registered interferograms in the HH (horizontal transmit and horizontal receive) polarization for the Atchafalaya Basin, in Southern Louisiana, USA, within the Mississippi River Delta (MRD) floodplain. The data were collected in October 2016 by Uninhabited Aerial Vehicle Synthetic Aperture Radar (UAVSAR), a polarimetric L-band synthetic aperture radar flown on the NASA Gulfstream-III aircraft as part of the Pre-Delta-X campaign. A single study region, flight line "gulfco_12011", was sampled six times at approximately 30-minute intervals to monitor changing water levels. The SLC stack product is a standard UAVSAR product delivered by the UAVSAR processing team. The L1 interferograms were generated from the SLC stacks using a method described in Bekaert et al. (2019).
Pre-Delta-X was a joint airborne and field campaign in the MRD beginning Spring 2015 and continuing through Fall 2016. The Pre-Delta-X campaign conducted airborne remote sensing observations and field in situ measurements to characterize delta hydrology, water quality (e.g., total suspended solids), and vegetation structure. These data facilitate the continued development of sampling methods, algorithms, and models to support the upcoming airborne and field campaigns in support of the Delta-X mission.
Project: Delta-X
The Delta-X mission is a 5-year NASA Earth Venture Suborbital-3 mission to study the Mississippi River Delta in the United States, which is growing and sinking in different areas. River deltas and their wetlands are drowning as a result of sea level rise and reduced sediment inputs. The Delta-X mission will determine which parts will survive and continue to grow, and which parts will be lost. Delta-X begins with airborne and in situ data acquisition and carries through data analysis, model integration, and validation to predict the extent and spatial patterns of future deltaic land loss or gain.
Related Publication
Jensen, D., K.C. Cavanaugh, M. Simard, G.S. Okin, E. Castañeda-Moya, A. McCall, and R. R. Twilley. 2019. Integrating imaging spectrometer and synthetic aperture radar data for estimating wetland vegetation aboveground biomass in coastal Louisiana. Remote Sensing 11:2533. https://doi.org/10.3390/rs11212533
Related Datasets
Castaneda, E., A.I. Christensen, M. Simard, A. Bevington, R. Twilley, and A. Mccall. 2020. Pre-Delta-X: Vegetation Species, Structure, Aboveground Biomass, MRD, LA, USA, 2015. ORNL DAAC, Oak Ridge, Tennessee, USA. https://doi.org/10.3334/ORNLDAAC/1805
Jensen, D.J., T.M. Pavelsky, and C. Lion. 2020. Pre-Delta-X: Spectral Reflectance of Water Surface, Atchafalaya Basin, LA, USA, 2016. ORNL DAAC, Oak Ridge, Tennessee, USA. https://doi.org/10.3334/ORNLDAAC/1804
Simard, M., M.W. Denbina, D.J. Jensen, and R. Lane. 2020. Pre-Delta-X: Water Levels across Wax Lake Outlet, Atchafalaya Basin, LA, USA, 2016. ORNL DAAC, Oak Ridge, Tennessee, USA. https://doi.org/10.3334/ORNLDAAC/1801
Acknowledgments
This work was supported by Jet Propulsion Laboratory Research and Technology Development (JPL-R&TD) FY17-19 (grants 01STCR / R.17.231.069).
Data Characteristics
Spatial Coverage: Atchafalaya Basin, Mississippi River Delta (MRD) floodplain, southern coast of Louisiana, USA
Slant range pixel resolution: 1.6 m
Azimuth pixel resolution: 0.6 m
Temporal Coverage: 2016-10-16 to 2016-10-17
Temporal Resolution: Multiple samples over a two day period
Site Boundaries: Latitude and longitude are given in decimal degrees.
| Site | Westernmost Longitude | Easternmost Longitude | Northernmost Latitude | Southernmost Latitude |
|---|---|---|---|---|
| Atchafalaya Basin | -91.622 | -91.0577 | 29.7582 | 29.3562 |
Data File Information
This dataset consists of 48 files: 12 single look complex (SLC, *.slc) stack files, 12 corresponding annotation (*.ann) files, and 24 interferograms (INT, *.int).
This L1 dataset is intended for users who are familiar with data from synthetic aperture radar, especially products from UAVSAR (https://uavsar.jpl.nasa.gov/). Contact UAVSAR for detailed information on how to interpret the files (https://uavsar.jpl.nasa.gov/cgi-bin/contact.pl).
File Naming Convention
The SLC (.slc) and annotation (.ann) files are named according to the UAVSAR standard product file naming convention. Each SLC and annotation file name is in the following format:
{site name}{line ID}{flight ID}{data take counter}{acquisition date}{stack number}{band}{steering}{polarization}_{stack_version}... {baseline correction}{segment number}_{downsample factor}.slc
{site name}{line ID}{flight ID}{data take counter}{acquisition date}{stack number}{band}{steering}{polarization}_{stack_version}... {baseline correction}{segment number}_{downsample factor}.ann
The date and time of data acquisition are encoded in interferogram filenames as YYMMDDhhmm. L090HH_v01 indicates L-band radar at 90-degree antenna boresight angle and HH polarization, version 1.
Table 1. File names and descriptions.
| File Name | Description |
|---|---|
|
*.slc |
Single look complex (SLC) from gulfco_12011 flights in the HH polarization. All SLCs in this dataset have the same geographic footprint because the same area was sampled six times at approximately 30-minute intervals, and the samples were co-registered. The SLCs are corrected for residual baseline. The interferograms were derived directly from SLCs. |
| *.ann | Annotation files with metadata for SLC files, including date and time of image acquisition, bounding coordinates, flight line heading, and technical parameters pertinent to UAVSAR settings. Use the date and time provided in the file name to match annotation and SLC files.
Only the HH (horizontal-horizontal) polarization products at a sampling rate of 1x1 are included. The annotation files refer to multiple products from UAVSAR gulfco_12011 (the flight designator) that are not included in this dataset. Additional data files are available from NASA’s Jet Propulsion Laboratory (JPL) at https://uavsar.jpl.nasa.gov/cgi-bin/product.pl?jobName=gulfco_12011_01. The first comment in each annotation file lists a change of name from the SLC files on JPL’s website to the files included in this dataset. |
| *.int | Interferograms derived from two SLCs. Use the date and time provided in the file name to match the INTs and SLCs files.
The SLCs and interferograms are binary files and standard products from UAVSAR. JPL’s UAVSAR provides detailed Information about the data formats for SLC stacks and interferograms. |
Application and Derivation
The repeat-pass single look complex (SLC) stack products are co-registered time series data used to generate the higher-level UAVSAR interferometric products. The data provided a time series of water level change during the tidal cycle and were used to evaluate the performance of hydrodynamic models and to compare alternative model formulations.
Quality Assessment
Data quality was monitored during acquisition and processing. A minimum of two operators flew onboard the aircraft: one the radar operator and the other the Platform Precision Autopilot (PPA) operator. The system contained automated on-board track monitoring software that evaluated flight performance during science data collection based on a preplanned flight track. The PPA notified the operators when the aircraft deviated from the planned track beyond the bounds of accepted tolerances. The operator could request that the flight line be aborted and reacquired. The decision to repeat flight lines was made with consideration to line priority, aircraft fuel levels, and crew day limitations. During Pre-Delta-X flights, the UAVSAR flight crew included a mission scientist from the Pre-Delta-X team to make decisions about line priority and reacquiring lines in cases where a flight line is aborted. During processing, pixels that lack data or which failed data quality tests were marked with the value "NaN".
Data Acquisition, Materials, and Methods
Data Collection
During the Pre-Delta-X campaign, the UAVSAR instrument was operated in its standard acquisition configuration, operating at an altitude of 12.5 km in quad-polarization mode, transmitting horizontally and vertically polarized radiation on alternate pulses and receiving both co-polarized (HH or VV) and cross-polarized (HV or VH) returns for each pulse. These L1 products are in the HH polarization.
UAVSAR is a polarimetric L-band synthetic aperture radar operating with 80 MHz bandwidth from 1217.5–1297.5 GHz designed for interferometry (InSAR) (Hensley et al. 2009). UAVSAR’s swath width is 22 km, which illuminates an area from approximately 22°–67° incidence angle, with 3 m (cross-track average) by 1 m (along-track) single look ground resolution. The instrument was flown on a Gulfstream-III (C20) aircraft with the radar electronics and antenna housed in a pod mounted below the fuselage (Fig. 2). The active array antenna consists of 24 L-band transmit/receive modules that feed 48 radiating elements within the 0.5 m by 1.5 m arrays.
The radar instrument uses both an embedded GPS inertial navigation unit (EGI) and a differential GPS (DGPS) unit to derive the antenna position, attitude, and velocity in real-time. Waypoints for the desired flight paths are generated prior to flight by the Flight Planning Subsystem and loaded into the aircraft’s autopilot system and the radar’s automatic radar controller (ARC) along with radar command information for each waypoint. The ARC is designed to operate in a fully autonomous mode or to accept commands from the radar operator.
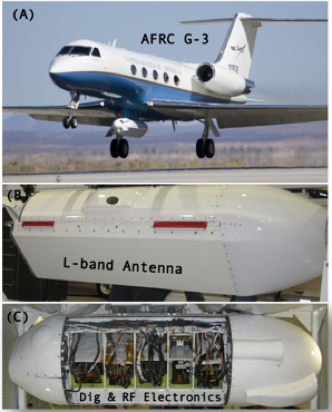
Figure 2. UAVSAR is flown on a Gulfstream-III aircraft (A) mounted in a pod hung below the fuselage. The antenna is left-side looking. The pod contains (B) the antenna (left-side looking) and (C) the digital and RF electronics. The recording media are housed within the fuselage.
The UAVSAR Gulfstream-III aircraft contains a Platform Precision Autopilot (PPA) system to control the aircraft position based upon high precision real-time position information provided by a DGPS unit that is part of the radar instrument. The aircraft typically flies within 5 m of the planned flight track. The antenna is electronically steered to compensate for variations in the yaw and pitch angles of the aircraft. The steering adjustments are designed to maintain a constant look direction and the adjustments are based on real-time attitude angle measurements derived from the EGI.
Data Processing
The L1 SLC stack products are a standard UAVSAR product delivered by the UAVSAR processing team. The SLC files were renamed for the dataset provided here, but the original filenames are included at the beginning of the annotation (*.ann) files. The L1 interferograms were generated using a method previously developed and tested for UAVSAR SLC stack processing (Bekaert et al. 2019).
Data Access
These data are available through the Oak Ridge National Laboratory (ORNL) Distributed Active Archive Center (DAAC).
Pre-Delta-X: L1 UAVSAR Single Look Complex and Interferograms, MRD, LA, USA, 2016
Contact for Data Center Access Information:
- E-mail: uso@daac.ornl.gov
- Telephone: +1 (865) 241-3952
References
Bekaert, D. S. P., C. E. Jones, K. An, and M.-H. Huang. 2019. Exploiting UAVSAR for a comprehensive analysis of subsidence in the Sacramento Delta. Remote Sensing of Environment 220:124-134. https://doi.org/10.1016/j.rse.2018.10.023.
Hensley, S., H. Zebker, C. Jones, T. Michel, R. Muellerschoen, and B. Chapman. 2009. First deformation results using the NASA/JPL UAVSAR instrument. Proceedings of the 2nd Asian-Pacific Conference on Synthetic Aperture Radar, pp. 1051–1055. https://doi.org/10.1109/APSAR.2009.5374246.
Jensen, D., K.C. Cavanaugh, M. Simard, G.S. Okin, E. Castañeda-Moya, A. McCall, and R. R. Twilley. 2019. Integrating imaging spectrometer and synthetic aperture radar data for estimating wetland vegetation aboveground biomass in coastal Louisiana. Remote Sensing 11:2533. https://doi.org/10.3390/rs11212533