Documentation Revision Date: 2021-04-03
Dataset Version: 1
Summary
Pre-Delta-X was a joint airborne and field campaign in the Mississippi River Delta during Spring 2015 and Fall 2016. The Pre-Delta-X campaign conducted airborne remote sensing and field in situ measurements to observe hydrology, water quality (e.g., total suspended solids (TSS)), and vegetation structure. This data serves for the continued development of algorithms and models to support the upcoming Delta-X mission. The Delta-X algorithms are used to convert remote sensing observables to geophysical parameters as well as hydrodynamic and ecological metrics.
This dataset includes nine data files in geoTIFF (*.tiff) format.
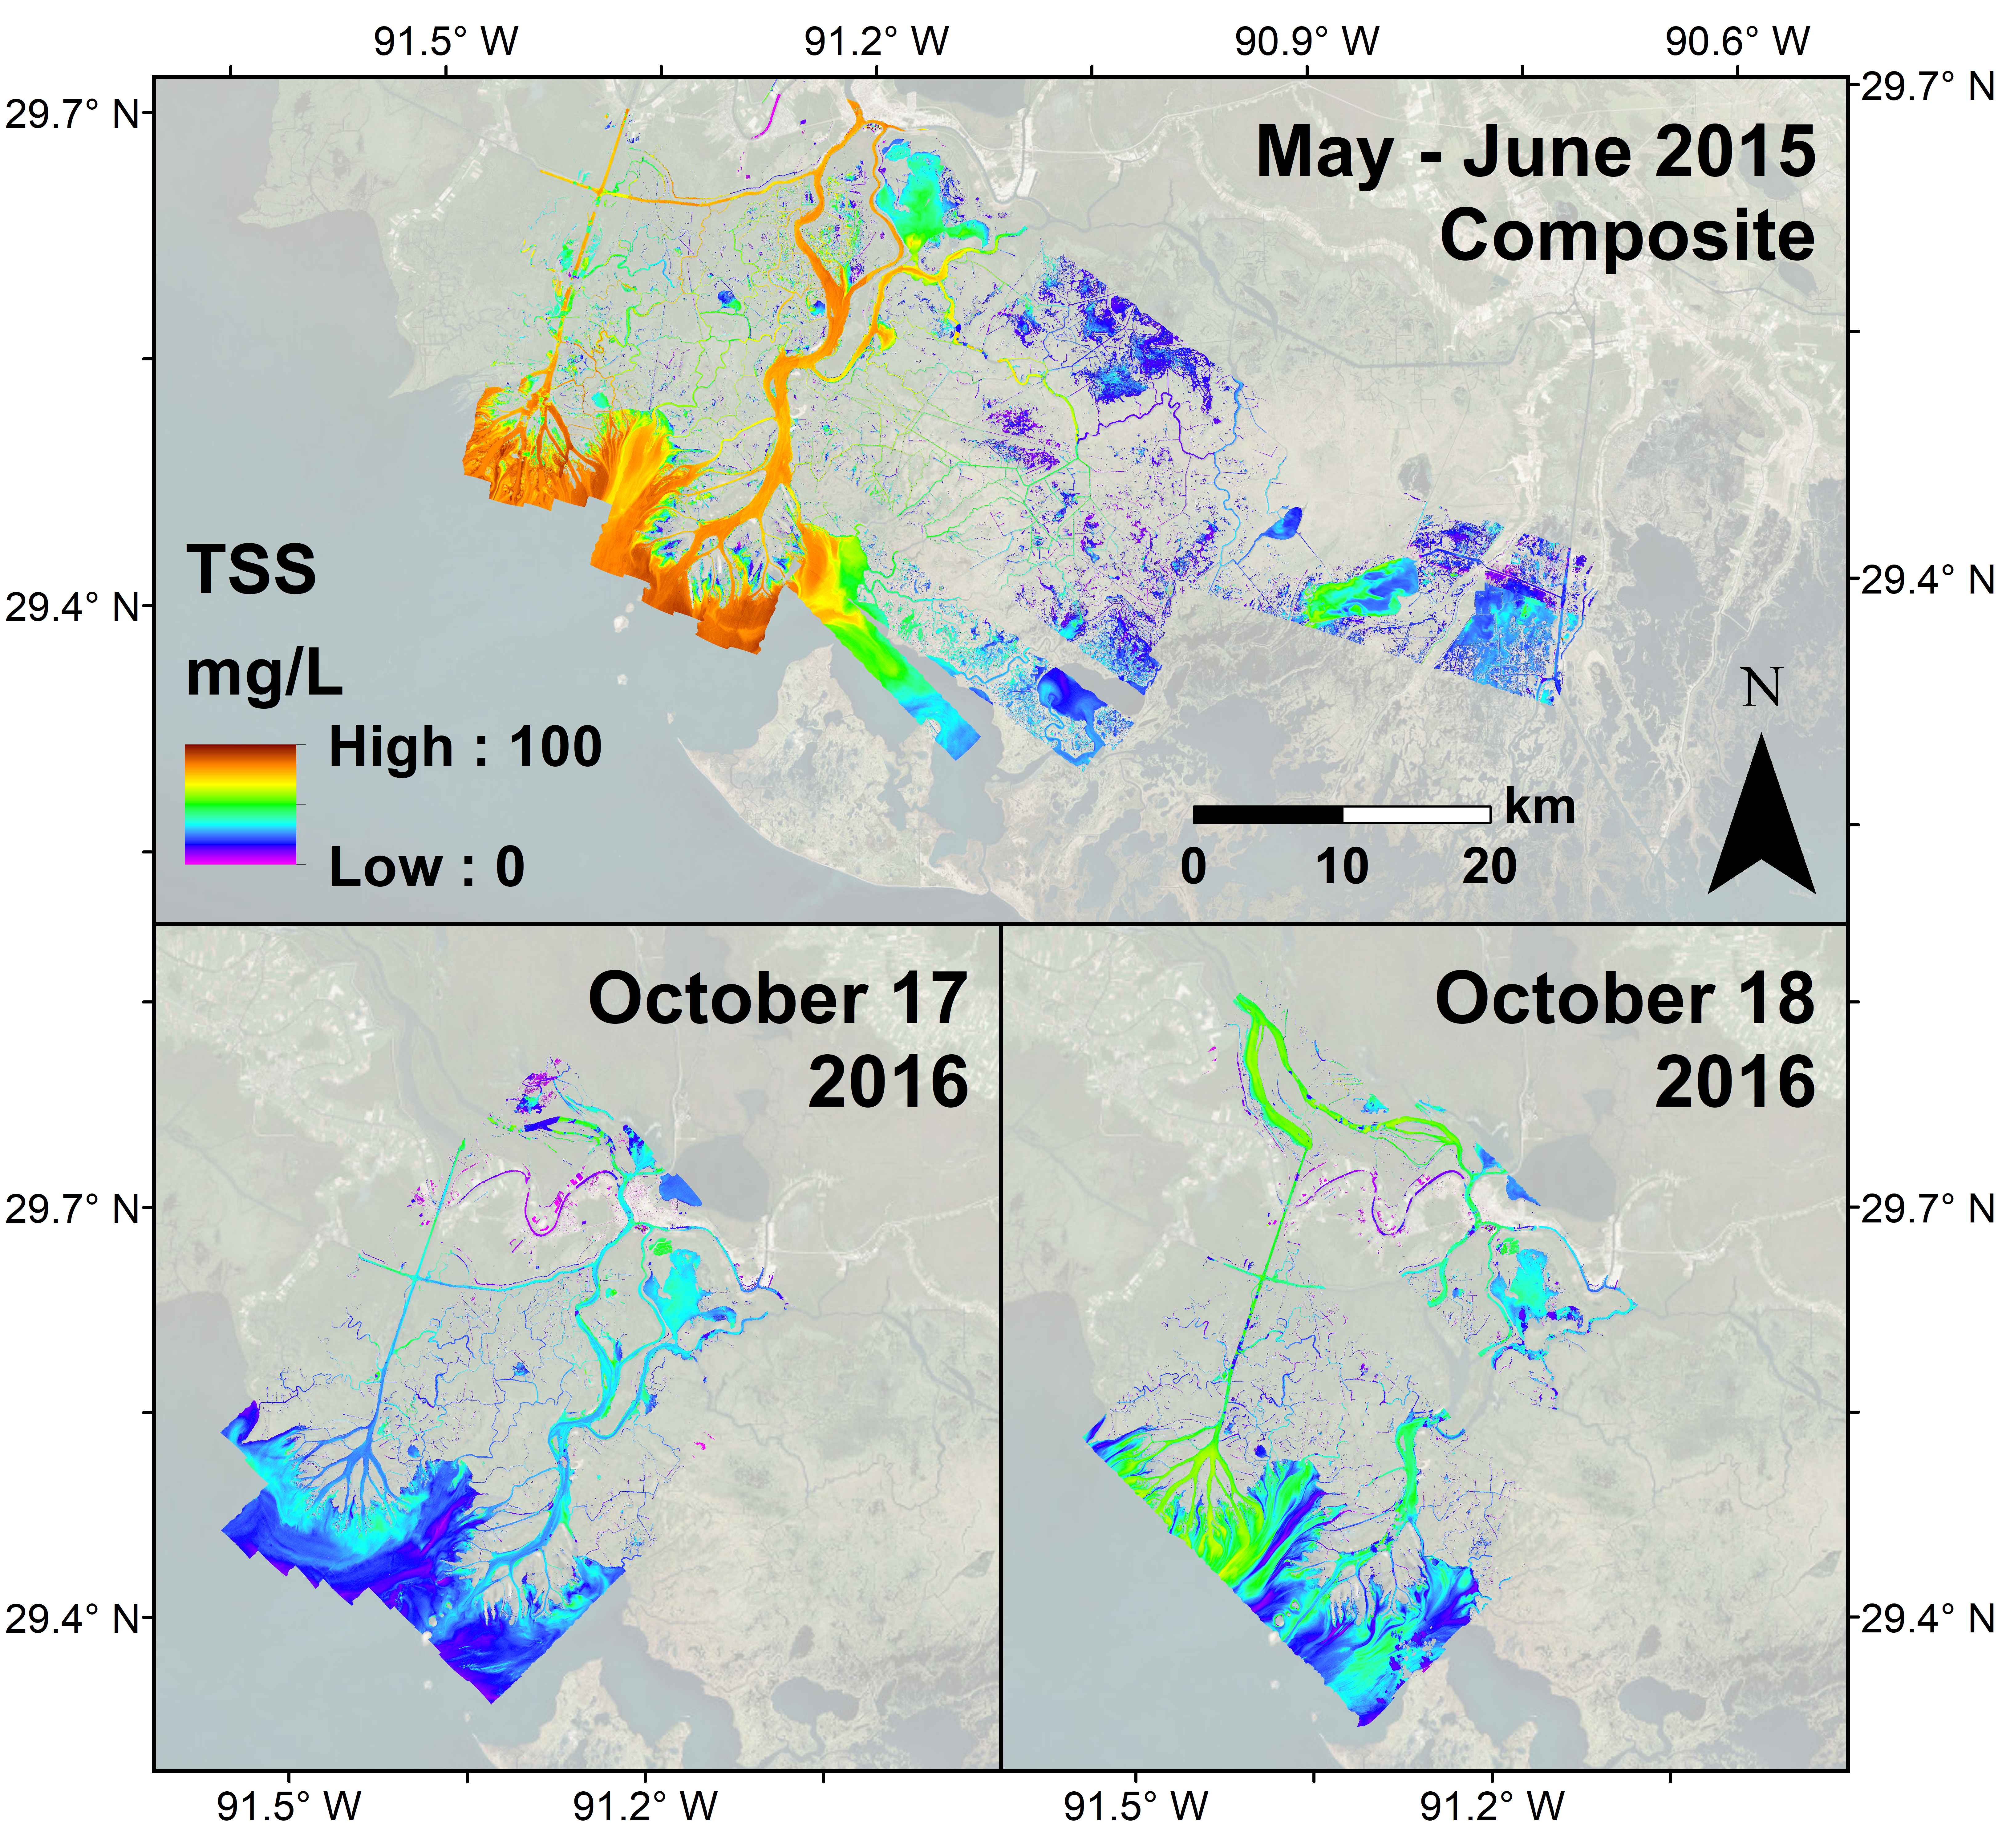
Figure 1. Maps of total suspended solids (mg/L) produced with the AVIRIS-NG data collected in coastal Louisiana in 2015 and 2016. Source: Jensen et al., (2019)
Citation
Jensen, D.J., M. Simard, C.G. Fichot, and T.M. Pavelsky. 2021. Pre-Delta-X: AVIRIS-derived Total Suspended Solids Maps for MRD, LA, USA, 2015-2016. ORNL DAAC, Oak Ridge, Tennessee, USA. https://doi.org/10.3334/ORNLDAAC/1822
Table of Contents
- Dataset Overview
- Data Characteristics
- Application and Derivation
- Quality Assessment
- Data Acquisition, Materials, and Methods
- Data Access
- References
Dataset Overview
This dataset includes total suspended solids (TSS) at the water surface across the Atchafalaya and Terrebonne Basins in Southern Louisiana, USA, within the Mississippi River Delta (MRD) floodplain. AVIRIS-NG, the Next Generation Airborne Visible to Infrared Imaging Spectrometer, acquired data over the study area in 2015 and 2016. The remote imageries were combined with coincident field measurements to develop and validate spatially explicit estimates at 3.7-5.4 m resolution of the concentration (mg/L) of TSS.
Pre-Delta-X was a joint airborne and field campaign in the Mississippi River Delta during Spring 2015 and Fall 2016. The Pre-Delta-X campaign conducted airborne remote sensing and field in situ measurements to observe hydrology, water quality (e.g., total suspended solids (TSS)), and vegetation structure. This data serves for the continued development of algorithms and models to support the upcoming Delta-X mission. The Delta-X algorithms are used to convert remote sensing observables to geophysical parameters as well as hydrodynamic and ecological metrics.
Project: Delta-X
The Delta-X mission is a 5-year NASA Earth Venture Suborbital-3 mission to study the Mississippi River Delta in the United States, which is growing and sinking in different areas. River deltas and their wetlands are drowning as a result of sea level rise and reduced sediment inputs. The Delta-X mission will determine which parts will survive and continue to grow, and which parts will be lost. Delta-X begins with airborne and in-situ data acquisition and carries through data analysis, model integration, and validation to predict the extent and spatial patterns of future deltaic land loss or gain.
Related Publication
Jensen, D., M. Simard, K. Cavanaugh, Y. Sheng, C.G. Fichot, T. Pavelsky, and R. Twilley. 2019. Improving the transferability of suspended solid estimation in wetland and deltaic waters with an empirical hyperspectral approach. Remote Sensing 1(13):1629. https://doi.org/10.3390/rs11131629
Related Datasets
Castaneda, E., A.I. Christensen, M. Simard, D.J. Jensen, R. Twilley, and R. Lane. 2020. Pre-Delta-X: Total Suspended Solids of Surface Water across MRD, LA, USA, 2015-2016. ORNL DAAC, Oak Ridge, Tennessee, USA. https://doi.org/10.3334/ORNLDAAC/1802
Acknowledgment
This work was supported by Jet Propulsion Laboratory Research and Technology Development (JPL-R&TD) FY17–19 (grant 01STCR / R.17.231.069).
Data Characteristics
Spatial Coverage: Atchafalaya and Terrebonne Basins, Mississippi River Delta (MRD) floodplain, southern coast of Louisiana, USA
Spatial Resolution: 3.7 m to 5.4 m
Temporal Coverage: 2015-06-02 to 2016-10-18
Temporal Resolution: Three seasonal estimates
Site Boundaries: Latitude and longitude are given in decimal degrees.
| Site | Westernmost Longitude | Easternmost Longitude | Northernmost Latitude | Southernmost Latitude |
|---|---|---|---|---|
| Atchafalaya and Terrebonne Basins | -91.5671 | -90.7105 | 29.8749 | 29.2896 |
Data File Information
There are nine data files in geoTIFF (*.tif) format, which include estimates of total suspended solids (TSS) in water. The files are named angYYYYMMDD_tss_VVV_BBB_X.tif where
ang = Airborne Visible/Infrared Imaging Spectrometer-Next Generation (AVIRIS-NG),
YYYYMMDD = sampling date,
tss = total suspended solids,
VVV = processing version marker,
BBB = basin (“Atcha” or “Terre”), and
_A or _B = identifier letter for when multiple mosaics were collected on the same day within the same basin. The absence of an identifier letter indicates that only one mosaics was collected on that date.
Table 1. File names and descriptions.
| File Name | Sample Date | Study Area |
|---|---|---|
| ang20150509_tss_v1e_Atcha.tif | 2015-05-09 | Atchafalaya Basin |
| ang20150602_tss_v1e_Atcha.tif | 2015-06-02 | Atchafalaya Basin |
| ang20150606_tss_v1e_Atcha.tif | 2015-06-06 | Atchafalaya Basin |
| ang20161017_tss_v1n2_Atcha.tif | 2016-10-17 | Atchafalaya Basin |
| ang20161018_tss_v1n2_Atcha.tif | 2016-10-18 | Atchafalaya Basin |
| ang20150506_tss_v1e_Terre.tif | 2015-05-06 | Terrebonne Basin |
| ang20150603_tss_v1e_Terre_A.tif | 2015-06-03 | Terrebonne Basin, A |
| ang20150603_tss_v1e_Terre_B.tif | 2015-06-03 | Terrebonne Basin, B |
| ang20150602_tss_v1e_Terre.tif | 2015-06-02 | Terrebonne Basin |
Data File Details
- TSS units: mg/L
- Spatial reference system: WGS 84 / UTM Zone 15N (EPSG:32615)
- Missing data value: -9999
Application and Derivation
This project demonstrated how remotely sensed data, calibrated with field data, can generate a variety of products for ecological monitoring and research. Remote imageries were collected by AVIRIS-NG, the Next Generation Airborne Visible to Infrared Imaging Spectrometer. A field team was deployed to the study area to measure water surface sediment concentration by taking water samples and by measuring reflectance with Analytical Spectral Devices (ASD) spectroradiometers in a similar spectral range to that measured by the AVIRIS-NG instrument. Sampling was conducted by ground teams in rivers, with a significant portion of the dataset acquired near-coincident with the overflight. These in-situ measurements were used to validate, and where necessary, adjust, AVIRIS-NG Level 1 and Level 2 data. Redundant data collection is useful for model development and permits cross-validation to assess performance and accuracy.
Quality Assessment
Field data on total suspended solids (TSS) and in situ spectral reflectances were used to develop a partial least squares regression (PLSR) model as part of a TSS estimation algorithm (Jensen et al., 2019). The model was then applied to the spectral reflectance measured by AVIRIS-NG in 2015 and 2016 and validated with in situ data from both years.
Of the original 35 pairs of in situ TSS and spectral measurements, 22 samples coincided spatially and temporally (within 1.5 h of the flight windows) with AVIRIS-NG flight lines; these field data were used for initial validation of the TSS maps. It should be noted that 2016 in situ spectrometer samples were included in the model parameterization and their coincident AVIRIS-NG pixel spectra were analyzed for validation. The 17 samples from 2015 provided independent validation and assessment of the model’s temporal transferability (i.e., the same site but different time period). The average TSS value in a 3×3 pixel window surrounding each sample point was extracted and compared to the in situ TSS measurements. These values were used to generate root mean square error (RMSE, mg/L), mean relative error (MRE, %), and validation R2 statistics for each year, as follows: 2015 RMSE = 12.69; 2016 RMSE = 6.34; 2015 MRE = 28.88; 2016 MRE = 14.87; 2015 R2 = 0.69; and 2016 R2 = 0.62.
Data Acquisition, Materials, and Methods
AVIRIS-NG Data Collection
Maps of TSS in surface waters were created by combining remote imagery and field measurements. Remote imagery was collected by AVIRIS-NG, the Next Generation Airborne Visible to Infrared Imaging Spectrometer. AVIRIS-NG is a push-broom spectral mapping system with a high signal-to-noise ratio, designed for tolerance and high-performance spectroscopy. AVIRIS-NG was developed as a successor to the Classic Airborne Visible Infrared Imaging Spectrometer (AVIRIS-C) (Green et al., 1998). The instrument covers the entire solar reflected spectrum from 380–2510 nm with a single Focal Plane Array, at a spectral sampling of approximately 5 nm. The AVIRIS-NG sensor has a 1 milliradian instantaneous field of view, providing altitude-dependent ground sampling distance ranging from sub-meter to 20 m scales. Its detector has a 640×480 pixel array, from which standard products are generated using the sensor’s 600 cross-track spatial samples and 425 spectral samples. Each acquisition is a flight line forming a continuous strip of push-broom data that typically takes 1–10 minutes to acquire. Multiple aircraft overflights cover the region of interest in these strips, accumulating a combined map of the target area.
For this campaign, AVIRIS-NG was implemented on a Dynamic Aviation King Air B200. The instrument has four components: 1) a sensor with its mount and camera glass mounted at a nadir port; 2) an onboard calibrator, mounted in the cabin next to the sensor; 3) a forward operator electronics rack, and 4) an aft thermal-control electronics rack.
AVIRIS-NG acquired data in its standard operating mode over regions of interest in the Atchafalaya and Terrebonne Basins. The area was provisionally split into multiple mosaics—a large “survey” covering the entire domain—which required multiple days to accomplish. Planned flight lines had a 15% overlap area at their margins in order to accommodate position and geometric sampling uncertainty. The precise direction of flight lines was adjusted to accommodate local time and weather conditions and to ameliorate sun glint effects. Because AVIRIS-NG cannot acquire data when clouds are present below or above the aircraft, the team scheduled flights based on the daily weather forecast.
In situ Field Data Collection and Processing
Field data were collected for model development and calibration (Castaneda et al., 2020). TSS were measured from in situ water samples collected throughout the Atchafalaya River, Wax Lake Outlet, and surrounding waterways. Water samples were collected just below the water surface and approximately in the middle of their given channels. Samples were stored on ice and transported to a laboratory, where they were filtered through pre-weighed, pre-combusted 0.7 µm glass-fiber filters. After being rinsed of salts, filters were dried at 110 degrees C until a constant weight was attained in order to derive volumetric TSS measurements accurate to hundredths mg/L following the ESS Method 340.2 protocol (EPA, 1993).
At each water sample location, reflectance spectra were collected using an ASD FieldSpec 3 spectrometer. To control for atmospheric moisture content and cloud activity in this coastal region, data were collected in Digital Number format and by alternating between the white reference calibration panel and the target water surface at nadir and away from the boat hull. Each set of in situ spectra was then processed to compile a table of reflectance data with which to model TSS. The ratio of above-water radiance over that of white-reference radiance was divided by Π and by the albedo of the white reference panel (~99%) to derive estimates of water-leaving radiance. The spectrometer data was truncated to the visible-near-infrared domain, ranging from 400–1000 nm, to excise shortwave infrared bands where water attenuates radiation. Following visual inspection of each spectrum for irregularities, the selected spectra were averaged together for each sample site to calculate a single water-leaving reflectance spectrum with 1 nm spectral resolution paired with each water sample’s TSS value. Estimates of skylight surface reflectance from Hydrolight simulations were subtracted from the spectra, and the spectra were then divided by Π to estimate remote sensing reflectance (Mobley et al., 2010).
TSS Modeling
Field data on TSS and in situ spectral reflectances were used to develop a PLSR model as part of a TSS estimation algorithm (Jensen et al., 2019). The resultant PLSR model (R2 = 0.83) was based on the first derivatives of the spectral reflectance, thereby providing the spectral slope at each relevant band. The model was then applied to the spectral reflectance measured by AVIRIS-NG in 2015 and 2016 and validated with in situ data from both years.
Data Access
These data are available through the Oak Ridge National Laboratory (ORNL) Distributed Active Archive Center (DAAC).
Pre-Delta-X: AVIRIS-derived Total Suspended Solids Maps for MRD, LA, USA, 2015-2016
Contact for Data Center Access Information:
- E-mail: uso@daac.ornl.gov
- Telephone: +1 (865) 241-3952
References
Castaneda, E., A.I. Christensen, M. Simard, D.J. Jensen, R. Twilley, and R. Lane. 2020. Pre-Delta-X: Total Suspended Solids of Surface Water across MRD, LA, USA, 2015-2016. ORNL DAAC, Oak Ridge, Tennessee, USA. https://doi.org/10.3334/ORNLDAAC/1802
EPA. 1993. ESS Method 340.2: Total suspended solids, mass balance (dried at 103-105 C) volatile suspended solids (ignited at 550 C). Environmental Protection Agency, Environmental Sciences Section; Madison, WI, USA.
Green, R.O., M.L. Eastwood, C.M. Sarture, T.G. Chrien, M. Aronsson, B.J. Chippendale, J.A. Faust, B.E. Pavri, C.J. Chovit, M. Solis, M.R. Olah, and O. Williams. 1998. Imaging spectroscopy and the Airborne Visible/Infrared Imaging Spectrometer (AVIRIS). Remote Sensing of the Environment 65(3):227-248. https://doi.org/10.1016/S0034-4257(98)00064-9
Jensen, D., M. Simard, K. Cavanaugh, Y. Sheng, C.G. Fichot, T. Pavelsky, and R. Twilley. 2019. Improving the transferability of suspended solid estimation in wetland and deltaic waters with an empirical hyperspectral approach. Remote Sensing 11(13):1629. https://doi.org/10.3390/rs11131629
Mobley, C., E. Boss, and C. Roesler. 2010. Ocean Optics WebBook. https://oceanopticsbook.info