Documentation Revision Date: 2021-04-03
Dataset Version: 1
Summary
Pre-Delta-X was a joint airborne and field campaign in the Mississippi River Delta during Spring 2015 and Fall 2016. The Pre-Delta-X campaign conducted airborne remote sensing and field in situ measurements to observe hydrology, water quality (e.g., total suspended solids (TSS)), and vegetation structure. This data serves for the continued development of algorithms and models to support the upcoming Delta-X mission. The Delta-X algorithms are used to convert remote sensing observables to geophysical parameters as well as hydrodynamic and ecological metrics.
This dataset includes three files in geoTIFF (*.tiff) format.
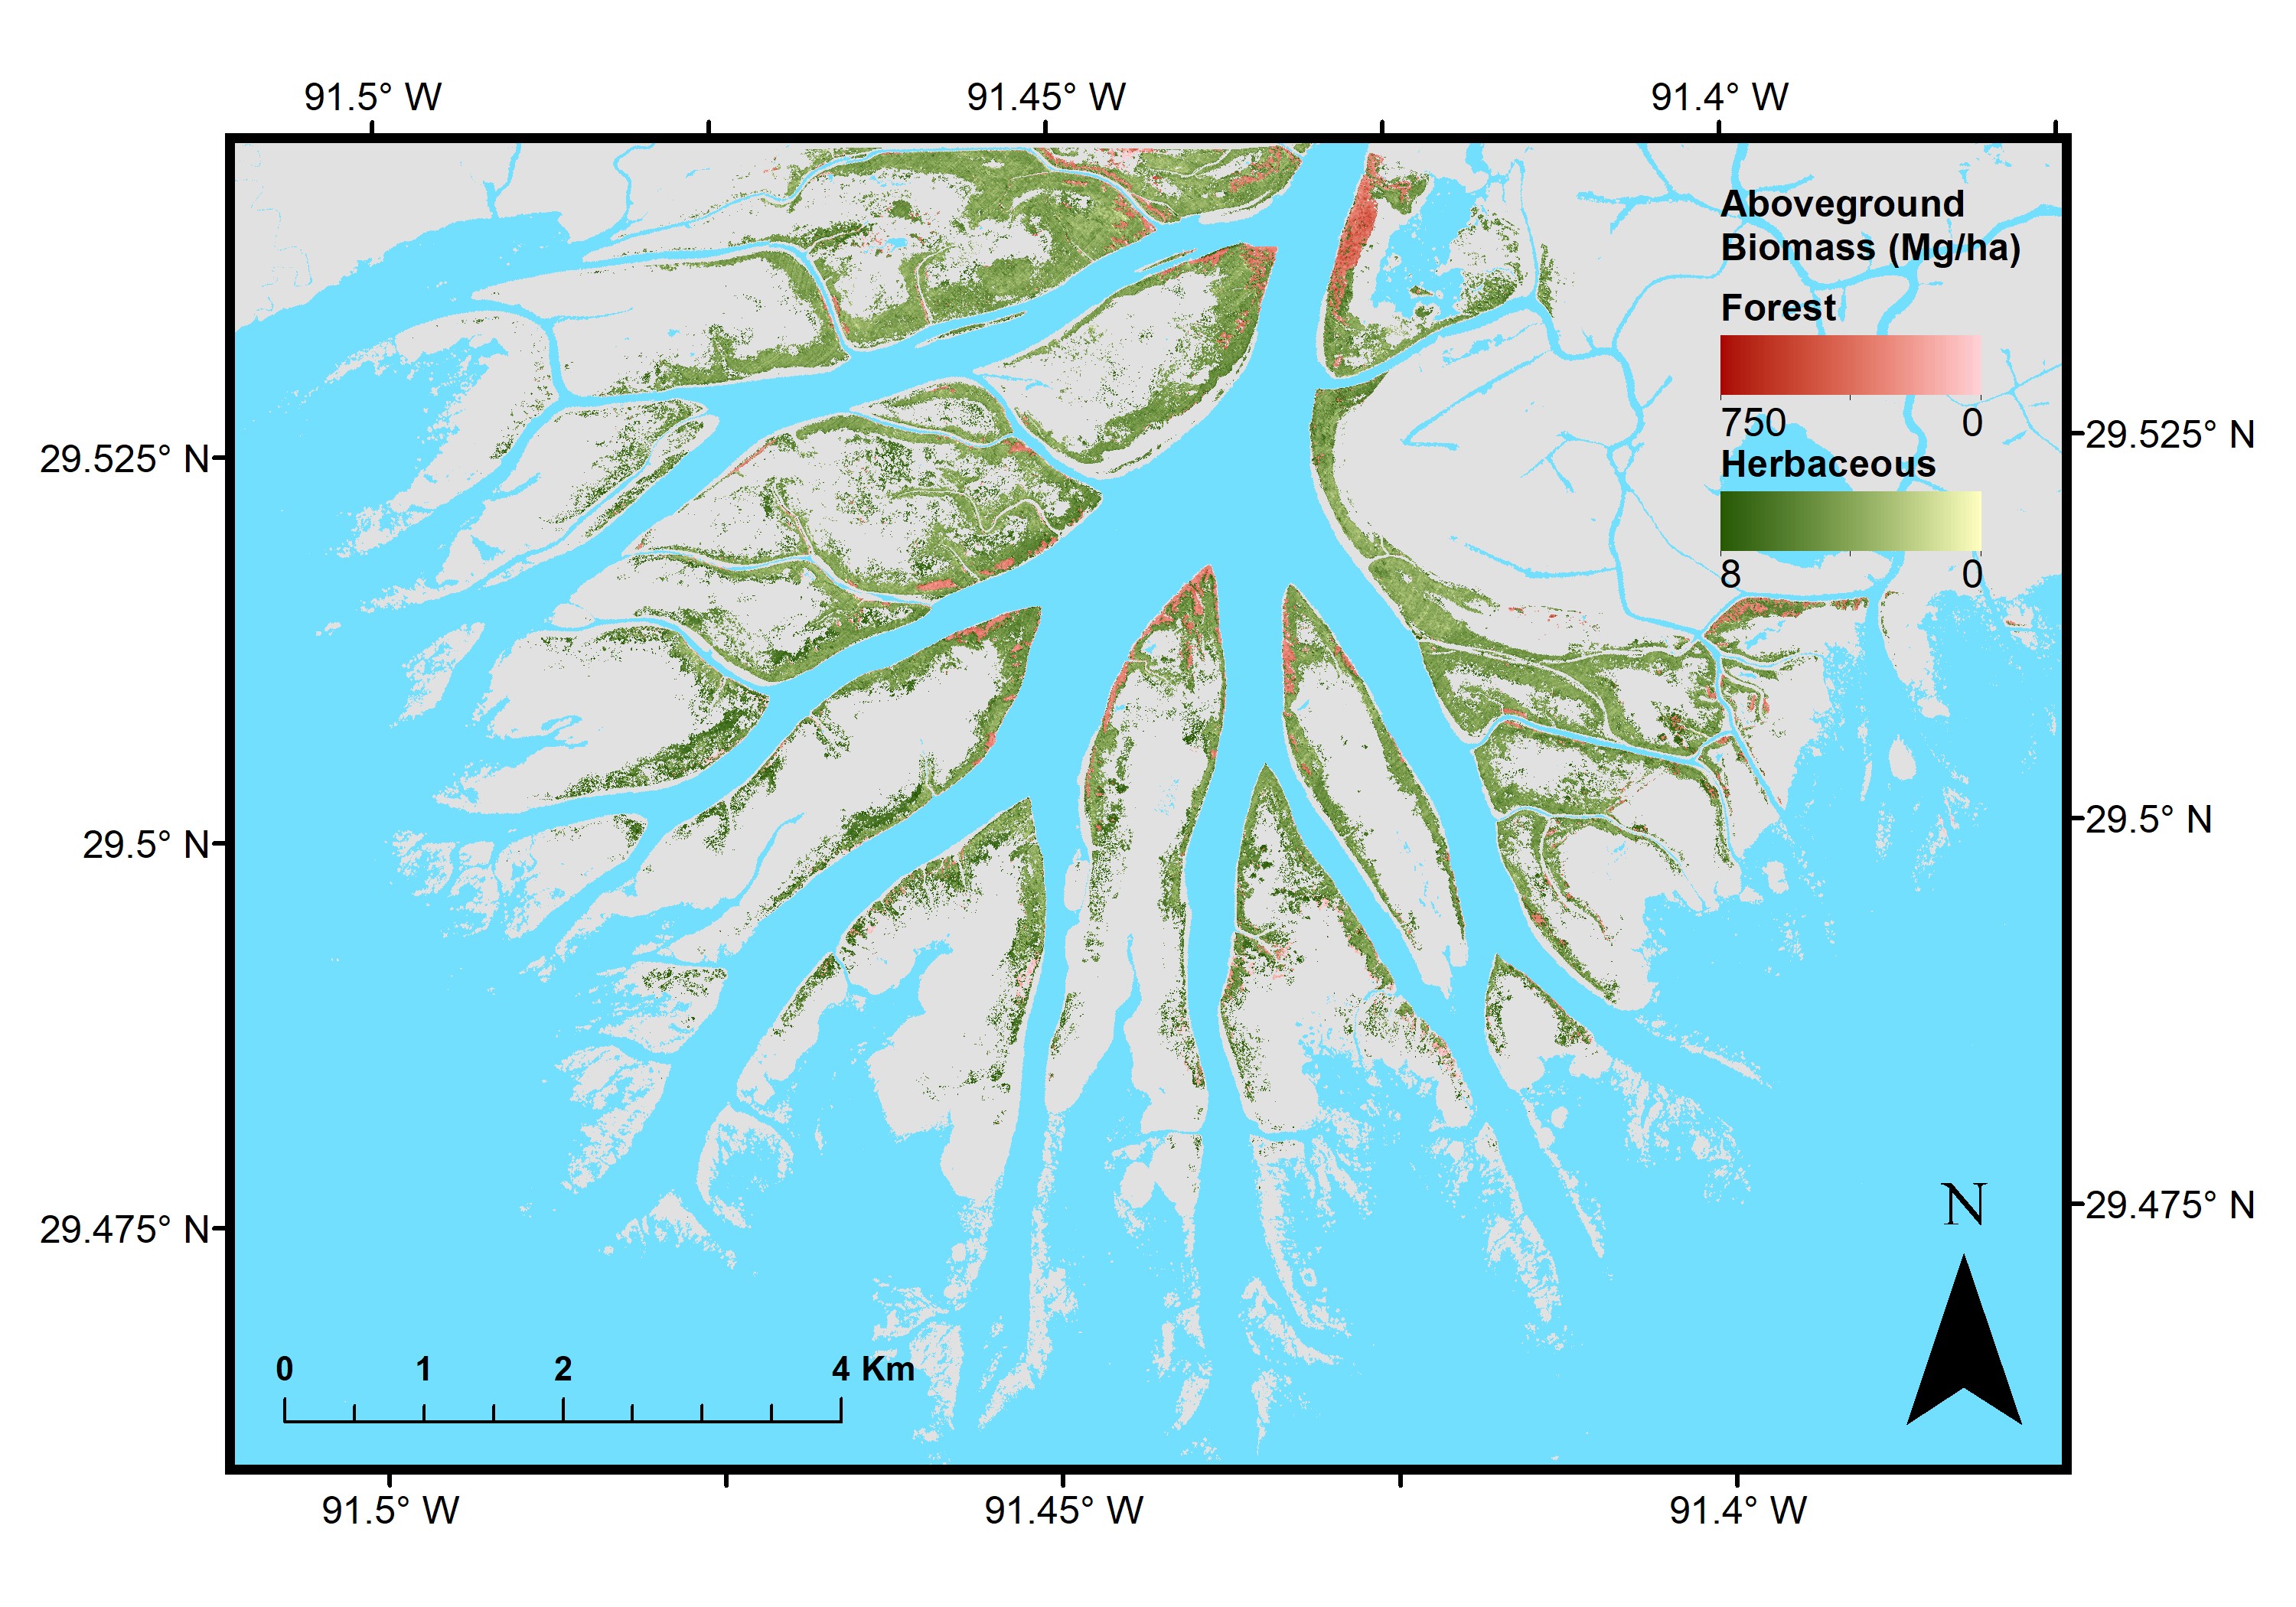
Figure 1. Estimated aboveground biomass (Mg/ha) map of herbaceous and forested wetland vegetation in the Wax Lake Delta. The gray area represents Nelumbo lutea, floating vegetation, and submerged aquatic vegetation where biomass was not estimated. Source: Jensen et al. (2019)
Citation
Jensen, D.J., M. Simard, R. Twilley, E. Castaneda, and A. McCall. 2021. Pre-Delta-X: Aboveground Biomass and Vegetation Maps, Wax Lake Delta, LA, USA, 2016. ORNL DAAC, Oak Ridge, Tennessee, USA. https://doi.org/10.3334/ORNLDAAC/1821
Table of Contents
- Dataset Overview
- Data Characteristics
- Application and Derivation
- Quality Assessment
- Data Acquisition, Materials, and Methods
- Data Access
- References
Dataset Overview
This dataset includes aboveground biomass (AGB) and vegetation of herbaceous and forest wetland at 5.4 m resolution across the Wax Lake Delta (WLD) in Southern Louisiana, USA, within the Mississippi River Delta (MRD) floodplain. Vegetation classes were derived from Airborne Visible/Infrared Imaging Spectrometer-Next Generation (AVIRIS-NG) imagery acquired over the Atchafalaya Basin and the Terrebonne Basin in October 2016 in combination with a digital elevation model. The AVIRIS-NG surface reflectance data were also combined with L-band Uninhabited Airborne Vehicle Synthetic Aperture Radar (UAVSAR) HV backscatter and scattering component values from coincident vegetation sample sites to develop and test AGB models for emergent herbaceous and forested wetland vegetation. This study used the integrated airborne data from AVIRIS-NG and UAVSAR to assess the instruments’ unique capabilities in combination for estimating AGB in coastal deltaic wetlands. The 5.4 m resolution vegetation classification map for the WLD study area was then used to apply the best models to estimate AGB across the WLD.
Pre-Delta-X was a joint airborne and field campaign in the Mississippi River Delta during Spring 2015 and Fall 2016. The Pre-Delta-X campaign conducted airborne remote sensing and field in situ measurements to observe hydrology, water quality (e.g., total suspended solids (TSS)), and vegetation structure. This data serves for the continued development of algorithms and models to support the upcoming Delta-X mission. The Delta-X algorithms are used to convert remote sensing observables to geophysical parameters as well as hydrodynamic and ecological metrics.
Project: Delta-X
The Delta-X mission is a 5-year NASA Earth Venture Suborbital-3 mission to study the Mississippi River Delta in the United States, which is growing and sinking in different areas. River deltas and their wetlands are drowning as a result of sea level rise and reduced sediment inputs. The Delta-X mission will determine which parts will survive and continue to grow, and which parts will be lost. Delta-X begins with airborne and in situ data acquisition and carries through data analysis, model integration, and validation to predict the extent and spatial patterns of future deltaic land loss or gain.
Related Publication
Jensen, Daniel, Kyle C Cavanaugh, Marc Simard, Alexandra Christensen, Andre Rovai, and Robert Twilley. 2020. “Aboveground Biomass Distributions and Vegetation Composition Changes in Louisiana’s Wax Lake Delta.” Estuarine, Coastal and Shelf Science 250 (March 2021): 107139. https://doi.org/10.1016/j.ecss.2020.107139
Jensen, Daniel, Kyle C. Cavanaugh, Marc Simard, Gregory S. Okin, Edward Castañeda-Moya, Annabeth McCall, and Robert R. Twilley. 2019. “Integrating Imaging Spectrometer and Synthetic Aperture Radar Data for Estimating Wetland Vegetation Aboveground Biomass in Coastal Louisiana.” Remote Sensing 11 (21): 2533. https://doi.org/10.3390/rs11212533
Related Datasets
Castaneda, E., A.I. Christensen, M. Simard, A. Bevington, R. Twilley, and A. Mccall. 2020. Pre-Delta-X: Vegetation Species, Structure, Aboveground Biomass, MRD, LA, USA, 2015. ORNL DAAC, Oak Ridge, Tennessee, USA. https://doi.org/10.3334/ORNLDAAC/1805
Acknowledgments
This work was supported by Jet Propulsion Laboratory Research and Technology Development (JPL-R&TD) FY17–19 (grant 01STCR / R.17.231.069).
Data Characteristics
Spatial Coverage: Wax Lake Delta, Mississippi River Delta (MRD) floodplain, southern coast of Louisiana, USA
Spatial Resolution: 5.4 m
Temporal Coverage: 2016-10-17
Temporal Resolution: One-time measurements
Site Boundaries: Latitude and longitude are given in decimal degrees.
| Site | Westernmost Longitude | Easternmost Longitude | Northernmost Latitude | Southernmost Latitude |
|---|---|---|---|---|
| Wax Lake Delta | -91.5135 | -91.3724 | 29.5457 | 29.4536 |
Data File Information
There are three data files in geoTIFF (*.tif) format, which include estimates of aboveground biomass (AGB) for herbaceous and forest wetland vegetation and a map of vegetation classes.
The files of estimated AGB are named angYYYYMMDD_agb_VVV_BBB_CCC.tif where
ang = Airborne Visible/Infrared Imaging Spectrometer-Next Generation (AVIRIS-NG),
YYYYMMDD = sampling date,
agb = aboveground biomass,
VVV = processing version marker,
BBB = basin (“Atcha” or “Terre”), and
CCC = vegetation class (“Herbaceous” or “Forest”).
The vegetation map is named angYYYYMMDD_Atcha_VegetationClassification.tif where
ang = Airborne Visible/Infrared Imaging Spectrometer-Next Generation (AVIRIS-NG),
YYYYMMDD = sampling date, and
Atcha = Atchafalaya Basin
Table 1. File names and descriptions.
| File Name | Unit | Description |
|---|---|---|
| ang20161017_agb_v1n2_Atcha_Herbaceous.tif | Mg ha-1 | Estimated aboveground biomass of herbaceous wetland vegetation |
| ang20161017_agb_v1n2_Atcha_Forest.tif | Mg ha-1 | Estimated aboveground biomass of forested wetland vegetation |
| ang20161017_Atcha_VegetationClassification.tif | None | Vegetation classes 0-Unclassified 1-Salix nigra 2-Colocasia esculenta 3-Polygonum punctatum 4-Grasses 5-Nelumbo lutea 6-Floating vegetation 7-Submerged aquatic vegetation 8-Water |
Data File Details
- Spatial reference system: WGS 84 / UTM Zone 15N (EPSG:32615)
- AGB estimates missing data value: -9999
- Vegetation class missing data value: 255
Application and Derivation
This project demonstrated how remotely sensed data, calibrated with field data, can generate a variety of products. On at least one flight day, a field team was deployed to the site to measure representative uniform surfaces with Analytical Spectral Devices (ASD) spectroradiometers in a similar spectral range. These in-situ measurements were used to validate and adjust AVIRIS-NG Level 1 and Level 2 data. In situ operations contributed to higher-level products, like this map of vegetation classes. In situ sampling of vegetation was conducted by ground teams on land, with a portion of the samples being coincident with the overflight. The data collected can be used to fit models for maps of ecogeomorphic zones and biomass. Redundant data collection will permit model cross-validation to assess performance and accuracy.
Quality Assessment
Data quality was monitored at several steps during acquisition and analysis. First, operators performed a preliminary real-time assessment using a real-time display in the cabin and assessed images and spectra in a scrolling “waterfall” plot. This step allowed the identification of impinging clouds, instrument artifacts, or other issues that required adjustment or, in worst-case, immediate reacquisition. Second, “quick look” images produced in the field were used to identify obvious visible artifacts or clouds. Third, representative spectra were used to assess the performance of science data algorithms at each stage. These spectra could be matched to in situ reference data to validate calibration as well as uncertainty predictions, following procedures outlined in Thompson et al., (2019a, 2019b). These prior publications also demonstrated closed calibration error budgets using radiometric instrument models. If needed, calibration could be adjusted using flight data following procedures in Thompson et al., (2018). Such adjustments were extremely rare and reserved as a fallback to provide an extra margin of safety.
Bad data flags (i.e., -9999) were embedded in the spectroscopic data. Bad data flags were reported for invalid regions caused by an instrument error or areas at the periphery of an orthorectified image where no spectra are acquired. Clouds and other valid but unusable regions were still considered bona fide scene content and were not altered.
To integrate the two remotely sensed datasets, x-scores associated with each component were extracted from the partial least squares (PLS) transformation of the AVIRIS-NG data. These represent the normalized scores for the dimensionally reduced training data before each training variable is weighted with respect to the dependent variable to calculate the component loadings. In doing so, the entire spectrum—for either reflectance or its derivative—associated with each aboveground biomass (AGB) entry was reduced to statistically independent variables suited for combination with other data. The x-scores were then combined with the paired volume and double bounce scattering values from the UAVSAR polarimetric decomposition in ordinary least squares regression models. The models were applied to the AVIRIS-NG and UAVSAR imagery to map AGB.
Uncertainty in the models was characterized by compiling model performance statistics and applying a leave-one-out cross-validation. The herbaceous wetland AGB model attained a model R2 of 0.51, an RMSE of 110.10 g/m2, and an MAE of 77.07 g/m2. Cross-validation of the model showed an MAE of 106.38 g/m2. The forested wetland AGB model attained a model R2 of 0.53, an RMSE of 11.626 g/m2, and an MAE of 8489 g/m2. Cross-validation of this model showed an MAE of 11,060 g/m2 (Jensen et al., 2019). Additionally, an in situ survey was conducted along seven transect sites in the WLD to validate the vegetation map. A recording of 143 total observations resulted in an overall of 77.62% and a Kappa value of 0.72 (Jensen et al. 2020).
Data Acquisition, Materials, and Methods
Following is a brief synopsis of the methods described in detail in Jensen et al., (2019).
This project integrated spectral and radar imagery with field data to estimate AGB. AVIRIS-NG is a push-broom spectral mapping system with a high signal-to-noise ratio, designed and toleranced for high-performance spectroscopy. The instrument covers the entire solar reflected spectrum from 380–2510 nm with a single focal plane array, at a spectral sampling of approximately 5 nm. The AVIRIS-NG sensor has a 1 milliradian instantaneous field of view, providing altitude-dependent ground sampling distance ranging from sub-meter to 20 m scales. Its detector has a 640×480 pixel array, from which standard products are generated using the sensor’s 600 cross-track spatial samples and 425 spectral samples. Each AVIRIS-NG dataset was atmospherically corrected using the physics-based Atmospheric Removal algorithm to derive a surface reflectance image (Bue et al., 2015; Thompson et al., 2015). The Adaptive Reflectance Geometric Correction algorithm was applied to correct bidirectional reflectance distribution effects that cause across-track variations in observed illumination intensity (Jensen et al., 2017).
This project combined AVIRIS-NG surface reflectance data with data from NASA’s L-band UAVSAR. UAVSAR is an airborne synthetic aperture radar (SAR) instrument that is placed in a pod and mounted under the Gulfstream-III. It was flown concurrently with AVIRIS-NG in May 2015 and October 2016. SAR uses active microwaves that are sensitive to structural information such as AGB. The microwaves emitted from the SAR instrument interact with the vegetation canopy and the surface before partially returning back to the sensor. The Freeman-Durden polarimetric decomposition (Freeman and Durden, 1998) was applied to the UAVSAR data, producing the various scattering mechanism contributions to the observed backscatter signal. The volume and double bounce components were employed in the integrated AGB model.
In situ, field data were collected to calibrate AGB models. On at least one flight day, a field team was deployed to the site to measure representative uniform surfaces with ASD spectroradiometers in a similar spectral range. These in-situ measurements (Castaneda et al., 2020) were used to validate and adjust AVIRIS-NG Level 1 and Level 2 data. The herbaceous and forested wetland AGB models employ a PLS transformation of these data into biomass estimates.
The vegetation classification map of the WLD (Jensen et al. 2020) was also used to apply these models to their appropriate corresponding pixels. Then these bands were combined with a LiDAR-based digital elevation model of the WLD and an ISODATA unsupervised classification was applied. The resulting classes were combined to reflect forested wetland vegetation, herbaceous wetland vegetation, other vegetation, and water. The "other vegetation" class includes submerged aquatic vegetation, Nelumbo lutea, and other floating vegetation types that are not suitable for the herbaceous AGB model’s application.
Data Access
These data are available through the Oak Ridge National Laboratory (ORNL) Distributed Active Archive Center (DAAC).
Pre-Delta-X: Aboveground Biomass and Vegetation Maps, Wax Lake Delta, LA, USA, 2016
Contact for Data Center Access Information:
- E-mail: uso@daac.ornl.gov
- Telephone: +1 (865) 241-3952
References
Bue, B.D., D.R. Thompson, M. Eastwood, R.O. Green, B.-C. Gao, D. Keymeulen, C.M. Sarture, A.S. Mazer, and H.H. Luong. 2015. Real-Time Atmospheric Correction of AVIRIS-NG Imagery. IEEE Transactions on Geoscience and Remote Sensing 53(12):6419–6428. https://doi.org/10.1109/TGRS.2015.2439215
Castaneda, E., A.I. Christensen, M. Simard, A. Bevington, R. Twilley, and A. Mccall. 2020. Pre-Delta-X: Vegetation Species, Structure, Aboveground Biomass, MRD, LA, USA, 2015. ORNL DAAC, Oak Ridge, Tennessee, USA. https://doi.org/10.3334/ORNLDAAC/1805
Freeman, A., Durden, S.L. 1998. A three-component scattering model for polarimetric SAR data. IEEE Transactions on Geoscience and Remote Sensing 36:963–973. http://dx.doi.org/10.1109/36.673687
Jensen, D.J., M. Simard, K.C. Cavanaugh, and D.R. Thompson. 2018. Imaging Spectroscopy BRDF Correction for Mapping Louisiana’s Coastal Ecosystems. IEEE Transactions on Geoscience and Remote Sensing 56:1739–1748. http://dx.doi.org/10.1109/TGRS.2017.2767607
Jensen, Daniel, Kyle C. Cavanaugh, Marc Simard, Gregory S. Okin, Edward Castañeda-Moya, Annabeth McCall, and Robert R. Twilley. 2019. “Integrating Imaging Spectrometer and Synthetic Aperture Radar Data for Estimating Wetland Vegetation Aboveground Biomass in Coastal Louisiana.” Remote Sensing 11 (21): 2533. https://doi.org/10.3390/rs11212533
Jensen, Daniel, Kyle C Cavanaugh, Marc Simard, Alexandra Christensen, Andre Rovai, and Robert Twilley. 2020. “Aboveground Biomass Distributions and Vegetation Composition Changes in Louisiana’s Wax Lake Delta.” Estuarine, Coastal and Shelf Science 250 (March 2021): 107139. https://doi.org/10.1016/j.ecss.2020.107139.
Thompson, D.R., K. Cawse-Nicholson, Z. Erickson, C. Fichot, C. Frankenberg, B.-C. Gao, M. M. Gierach, R.O. Green, D. Jensen, V. Natraj, and A. Thompson. 2019a. A unified approach to estimate land and water reflectances with uncertainties for coastal imaging spectroscopy. Remote Sensing of Environment 231:111198. https://doi.org/10.1016/j.rse.2019.05.017
Thompson, D.R., L. Guanter, A. Berk, B.-C. Gao, R. Richter, D. Schläpfer, and K.J. Thome. 2019b. Retrieval of atmospheric parameters and surface reflectance from VSWIR imaging spectroscopy. Surveys in Geophysics 40:333–360. https://doi.org/10.1007/s10712-018-9488-9
Thompson, D.R., B.-C. Gao, R.O. Green, D.A. Roberts, P.E. Dennison, and S.R. Lundeen. 2015. Atmospheric correction for global mapping spectroscopy: ATREM advances for the HyspIRI preparatory campaign. Remote Sensing of Environment 167:64–77. http://dx.doi.org/10.1016/j.rse.2015.02.010