Documentation Revision Date: 2021-04-03
Dataset Version: 1
Summary
Pre-Delta-X was a joint airborne and field campaign in the Mississippi River Delta during Spring 2015 and Fall 2016. The Pre-Delta-X campaign conducted airborne remote sensing and field in situ measurements to observe hydrology, water quality (e.g., total suspended solids (TSS)), and vegetation structure. This data serves for the continued development of algorithms and models to support the upcoming Delta-X mission. The Delta-X algorithms are used to convert remote sensing observables to geophysical parameters, and the models are numerical hydrodynamic and ecological.
This dataset includes a total of 312 files, including 273 files in GeoTiFF (*.tif) format (seven data files for each of the 39 flight lines) and 39 annotation files (*.ann) (one for each flight line).
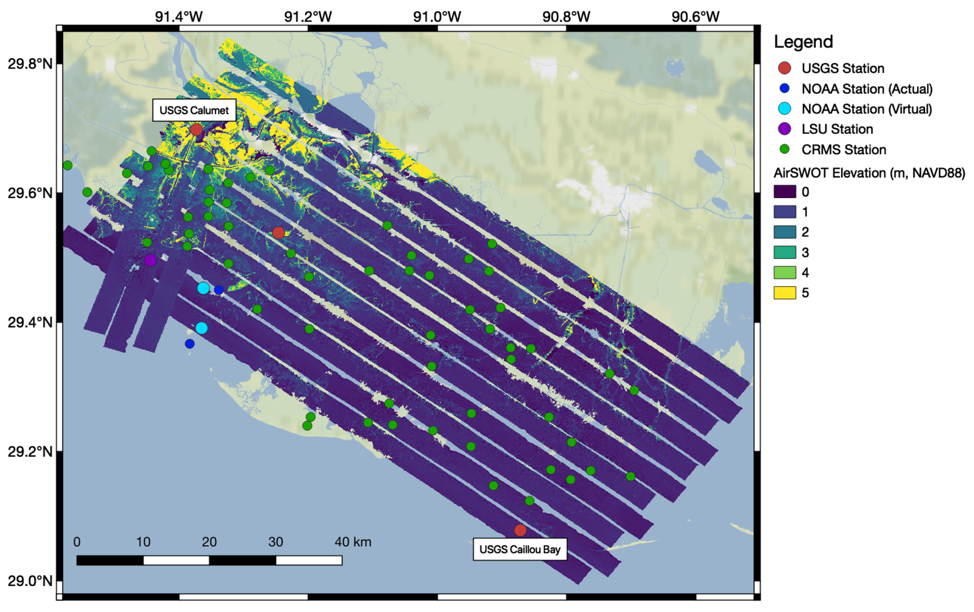
Figure 1. Map of water surface elevation estimates collected by AirSWOT on May 9, 2015 over the Atchafalaya River Basin in coastal Louisiana, USA. The two USGS stations used as ground control points for AirSWOT calibration are annotated. Source: Denbina et al., 2019
Citation
Denbina, M.W., M. Simard, E. Rodriguez, X. Wu, and C. Michailovsky. 2021. Pre-Delta-X: L2 AirSWOT Water Surface Elevations, Atchafalaya Basin, LA, USA, 2016. ORNL DAAC, Oak Ridge, Tennessee, USA. https://doi.org/10.3334/ORNLDAAC/1818
Table of Contents
- Dataset Overview
- Data Characteristics
- Application and Derivation
- Quality Assessment
- Data Acquisition, Materials, and Methods
- Data Access
- References
Dataset Overview
This dataset provides water surface elevations over the Wax Lake Delta in the Atchafalaya Basin in coastal Louisiana, USA, in May 2015. These Level 2 (L2) data were collected by AirSWOT, an airborne instrument employing near-nadir wide-swath Ka-band radar interferometry to measure water-surface elevation and produce continuous gridded elevation data at 3.6 m resolution. Along with elevation estimates, the dataset includes measures of estimation errors, sensitivity, incidence angle, backscatter, and interferometric correlation. For this application, in situ water level data were added into the AirSWOT phase calibration procedure. These L2 data consist of a set of rasters in Universal Transverse Mercator (UTM) map coordinates for each of the 39 AirSWOT flight lines. These elevation data were later used for calculating elevation and slopes along the main channels in this wetland system, as well as tying observations to ocean tidal conditions.
Pre-Delta-X was a joint airborne and field campaign in the Mississippi River Delta during Spring 2015 and Fall 2016. The Pre-Delta-X campaign conducted airborne remote sensing and field in situ measurements to observe hydrology, water quality (e.g., total suspended solids (TSS)), and vegetation structure. This data serves for the continued development of algorithms and models to support the upcoming Delta-X mission. The Delta-X algorithms are used to convert remote sensing observables to geophysical parameters, and the models are numerical hydrodynamic and ecological.
Project: Delta-X
The Delta-X mission is a 5-year NASA Earth Venture Suborbital-3 mission to study the Mississippi River Delta in the United States, which is growing and sinking in different areas. River deltas and their wetlands are drowning as a result of sea level rise and reduced sediment inputs. The Delta-X mission will determine which parts will survive and continue to grow, and which parts will be lost. Delta-X begins with airborne and in situ data acquisition and carries through data analysis, model integration, and validation to predict the extent and spatial patterns of future deltaic land loss or gain.
Related Publication
Denbina, M., M. Simard, E. Rodriguez, X. Wu, A. Chen, and T. Pavelsky. 2019. Mapping water surface elevation and slope in the Mississippi River Delta Using the AirSWOT Ka-band interferometric synthetic aperture radar. Remote Sensing 11:2739. https://doi.org/10.3390/rs11232739
Related Datasets
Additional Pre-Delta-X datasets are available on the ORNL DAAC Delta-X project page.
Acknowledgments
This work was supported by NASA's Surface Water and Ocean Topography (SWOT) project (grants NNN13D193T and NNN12AA01C) and the Jet Propulsion Laboratory Research and Technology Development (grants 01STCR -R.16.023.011, and 01STCR / R.17.231.069).
Data Characteristics
Spatial Coverage: Atchafalaya Basin and Wax Lake Delta in coastal Louisiana, USA.
Spatial Resolution: 3.6 m
Temporal Coverage: 2015-05-08 to 2015-05-11
Temporal Resolution: Multiple estimates over three days
Site Boundaries: Latitude and longitude are given in decimal degrees.
| Site | Westernmost Longitude | Easternmost Longitude | Northernmost Latitude | Southernmost Latitude |
|---|---|---|---|---|
| Atchafalaya Basin | -91.6023 | -91.4463 | 29.8514 | 29.3562 |
Data File Information
This dataset includes a total of 312 files, including 273 files in GeoTiFF (*.tif) format (seven data files for each of the 39 flight lines) and 39 annotation files (*.ann) (one for each flight line). The data files are named utm_m0m_ <flight ID>.<variable>.tif (e.g., utm_m0m_20150511083958.corr.tif), where
- m0m is the AirSWOT imaging mode employed mode 0 with motion compensation,
- <flight ID> is the date and time of the flight in UTC format (YYYYMMDDhhmmss), and
- <variable> is one of the seven variables listed in Table 1.
The annotation files are named o5release_<flight ID>.ann (e.g., o5release_20150508110113.ann), where
- <flight ID> is the date and time of the flight in UTC format (YYYYMMDDhhmmss).
Data File Details
For all GeoTIFF files,
- CRS: "WGS 84 / UTM zone 15N" (EPSG: 32615)
- Missing Data Value: -10000
- Bands: 1
Table 1. Variable names and descriptions used in GeoTIFF files.
| Variable | Units | Description |
|---|---|---|
| corr | none | Interferometric correlation (values between 0 and 1) |
| dhdphi | meters/radians | Height sensitivity expressed as the conversion factor between the interferometric phase and vertical height |
| err | meters | Estimated height error (1-sigma standard deviation) |
| hgt | meters | Estimated water surface elevation as height with respect to the WGS 84 ellipsoidal surface |
| inc | radians | Incidence angle estimated from the reference DEM |
| mag | meters | Backscatter magnitude equal to the square root of the geometric mean of the reference and secondary channel sigma-naught. Values are in linear units of magnitude but can be converted to sigma-naught in dB using the formula sigma0_in_db=20*log10(mag) |
| mag_ns | meters | Backscatter magnitude after subtracting estimated noise-equivalent sigma-nought. Values are in linear units of magnitude but can be converted to sigma-nought in dB using the formula sigma0_in_db= 20*log10(mag) |
The annotation files (*.ann) provide basic metadata for each flight line, including the flight line ID, start and end UTC times of data acquisition, processor version number, and the date and time of different processing stages.
Table 2. Example of details contained within the annotation files using o5release_20150508110113.ann.
| AirSWOT Flight Line ID (-) = 20150508110113 UTC Date Start Data (YYYY-MM-DD) = 2015-05-08 UTC Time Start Data (HH:MM:SS) = 11:02:30 UTC Time End Data (HH:MM:SS) = 11:08:23 Processor Facility (-) = JPL Band Identification (-) = Ka-Band o5s1 Version and Local Datetime (-) = git hash version-1.3-21-g0bfce71-dirty, at Mon May 7 12:49:37 2018 o5s2 Version and Local Datetime (-) = git hash version-1.3-21-g0bfce71-dirty, at Mon May 7 13:52:30 2018 o5s3 Version and Local Datetime (-) = git hash version-1.3-21-g0bfce71-dirty, at Mon May 7 14:53:15 2018 o5s4 Version and Local Datetime (-) = git hash version-1.3-21-g0bfce71-dirty, at Mon May 7 14:58:13 2018 o5release Version and Local Datetime (-) = git hash version-1.3-72-gc06911519-dirty, at Thu Sep 26 18:03:38 2019 |
Application and Derivation
AirSWOT uses airborne radar interferometry to measure open water surface elevation. It was developed in collaboration with NASA’s Surface Water and Ocean Topography (SWOT) project and has supported multiple ocean and hydrology campaigns including Tanana River, Yukon Flats Basin, and Willamette River. AirSWOT’s elevation measurements can be used to calibrate and validate hydrodynamic models and estimate river discharge.
Quality Assessment
Data quality was assessed by comparing elevation estimates with data from in situ water level gauges throughout the study area. The analysis estimated the phase drift rate to make global calibration adjustments based on data from cross-over flight paths. Estimated phase drift rate was assessed using the in situ measurements of water surface elevation and slope. When there were large differences between estimates and in situ measurements, the phase drift rate for each flight track was adjusted and a global adjustment applied to derive a new data product. The phase drift rate becomes more stable the longer the radar is turned on. Therefore, for this campaign, the data collected in the first hour of each flight were processed using a first-order (linear) phase drift rate, while data collected after the first hour were processed using a zero-order (constant) phase drift. For more details on the uncertainty analysis and phase calibration, see Denbina et al. (2019).
AirSWOT produced continuous gridded elevation data. On a pixel basis, elevation error is dominated by random noise, and contiguous pixels along a river channel were averaged to reduce measurement noise. Assuming a total averaging area of 1 km2, the height noise was less than 10 cm. Other factors such as atmospheric delays, GPS errors, and instrument drift produced slowly varying errors that were corrected using in situ data (leveled pressure transducers) and cross-over calibration from overlapping flight lines. The combined measurement system yielded errors smaller than 1 cm/km over 10 km reaches. An estimated height uncertainty (error) product, quantified as a 1-sigma standard deviation of the AirSWOT height, is included for each image pixel.
Data Acquisition, Materials, and Methods
AirSWOT used near-nadir wide-swath radar interferometry (Rodriguez et al., 2017; Altenau et al., 2017) to measure water-surface elevation. The instrument operated at Ka-band (35.75 GHz) and includes six antennas that formed multiple baseline pairs for along-track and across-track interferometry. These antenna combinations provided contiguous coverage from about 500 m to 4 km from nadir, which removed water-motion-induced geolocation and height errors. The instrument was coupled with a high-precision Applanix GPS/IMU system to compensate for the effects of aircraft motion and attitude. AirSWOT was flown on a Langley Research Center (LaRC) King Air. There are three components to the overall instrument suite: (1) radar mounted in the nadir forward port of the aircraft, (2) Avcon electronics rack in the main cabin, and (3) Welch power distribution rack in the rear of the aircraft. Radiometric calibration data was acquired prior to deployment by imaging a corner reflector array in Rosamond, CA.
AirSWOT produces data products in multiple modes and employs cross-track and along-track interferometry to both estimate the height of the water surface and to compensate for the motion of water scatterers. The delivered products were from mode “m0m&rdquo (mode 0 with motion compensation) and represent the standard output product for the AirSWOT outer swath mode. Data from this mode has also been used in other previous studies to measure water surface elevation and slope (e.g., Altenau et al., 2017; Altenau et al., 2019; Denbina et al., 2019; Pitcher et al., 2019; Tuozzolo et al., 2019).
The AirSWOT instrument suffered from small phase drifts creating a slope artifact in the across-track direction. To correct these phase-drift artifacts, the flight pattern (Fig. 1) was designed to include crossovers that are used to make global adjustments and estimate phase drifts. The phase drifts compensation, with in situ water level measurements, were used to calibrate the AirSWOT water surface elevation measurements (Denbina et al., 2019).
AirSWOT performance in the floodplain was limited by the presence of vegetation and by the very shallow slopes characteristic of floodplain discharge. Therefore, the bulk of the AirSWOT data collections were targeted at larger channels. Channel discharge supplies water for potential overflow to islands and floodplains. In situ data were incorporated in the phase calibration procedure because the standard AirSWOT phase calibration could be adversely affected by wetland vegetation, which covers a significant portion of this study area (Section 5 of Denbina, 2018). For this dataset, only outer swath products were included, and lines were processed using version 1.3 of the AirSWOT processing code. The integration of in situ measurements into the AirSWOT processing is novel to the Pre-Delta-X campaign.
In addition to the raster files, a plain text annotation file is included with basic metadata, including flight line ID, start and end UTC times of data acquisition, processor version number, and the date and time of different processing stages.
Data Access
These data are available through the Oak Ridge National Laboratory (ORNL) Distributed Active Archive Center (DAAC).
Pre-Delta-X: L2 AirSWOT Water Surface Elevations, Atchafalaya Basin, LA, USA, 2016
Contact for Data Center Access Information:
- E-mail: uso@daac.ornl.gov
- Telephone: +1 (865) 241-3952
References
Altenau, E.H., T.M. Pavelsky, D. Moller, C. Lion, L.H. Pitcher, G.H. Allen, P.D. Bates, S. Calmant, M. Durand, and L.C. Smith. 2017. AirSWOT measurements of river water surface elevation and slope: Tanana River, AK. Geophysical Research Letters 44(1):181–189. https://doi.org/10.1002/2016GL071577
Altenau, E.H., T.M. Pavelsky, D. Moller., L.H. Pitcher, P.D. Bates, M.T. Durand, and L.C. Smith. 2019. Temporal variations in river water surface elevation and slope captured by AirSWOT. Remote Sensing of Environment 224:304- 316. https://doi.org/10.1016/j.rse.2019.02.002
Denbina, M. 2018. AirSWOT processing considerations for flight line planning. Pasadena, CA: Jet Propulsion Laboratory, California Institute of Technology.
Denbina, M., M. Simard, E. Rodriguez, X. Wu, A. Chen, and T. Pavelsky. 2019. Mapping water surface elevation and slope in the Mississippi River Delta Using the AirSWOT Ka-band interferometric synthetic aperture radar. Remote Sensing 11:2739. https://doi.org/10.3390/rs11232739
Pitcher, L.H., T.M. Pavelsky, L.C. Smith., D.K. Moller, E.H. Altenau, G.H. Allen, C. Lion, D. Butman, S.W. Cooley, J.V. Fayne, and M. Bertram. 2019. AirSWOT InSAR mapping of surface water elevations and hydraulic gradients across the Yukon Flats Basin, Alaska. Water Resources Research 55(2):937–953. https://doi.org/10.1029/2018WR023274
Rodriguez, E., D. E. Fernandez, E. Peral, C. W. Chen, J. De Bleser, and B. Williams. 2017. Wide-swath altimetry. In D. Stammer and A. Cazenave (Eds.), Satellite Altimetry over Oceans and Land Surfaces (pp. 71–112). Taylor & Francis Group, London. https://doi.org/10.1201/9781315151779-2
Tuozzolo, S., G. Lind, B. Overstreet, J. Mangano, M. Fonstad, M. Hagemann, R.P.M. Frasson, K. Larnier, P.A. Garambois, J. Monnier, and M. Durand. 2019. Estimating river discharge with swath altimetry: a proof of concept using AirSWOT observations. Geophysical Research Letters 46:1459–1466. https://doi.org/10.1029/2018GL080771