Documentation Revision Date: 2021-02-26
Dataset Version: 1
Summary
Pre-Delta-X was a joint airborne and field campaign in the MRD beginning Spring 2015 and continuing through Fall 2016. The Pre-Delta-X campaign conducted airborne remote sensing observations and field in situ measurements to characterize delta hydrology, water quality (e.g., total suspended solids), and vegetation structure. These data facilitate the continued development of sampling methods, algorithms, and models to support the upcoming airborne and field campaigns in support of the Delta-X mission.
There are 128 compressed multiband ENVI image files (113 in *.img and 15 in *.dat formats) provided with this dataset. Each ENVI file has a corresponding header (*.hdr) file containing metadata.
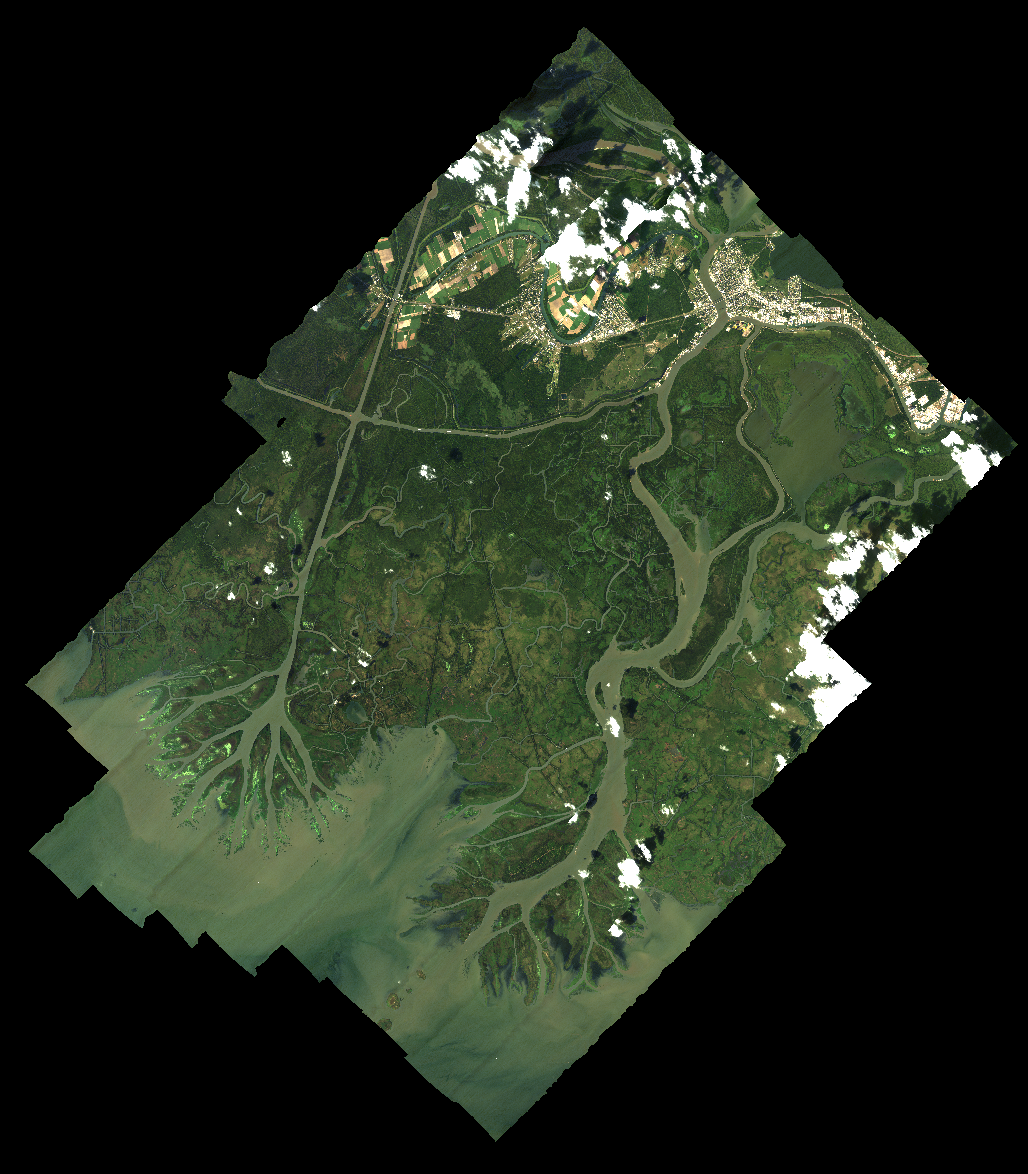
Figure 1. True-color mosaic image of the AVIRIS-NG data collected over the Atchafalaya Basin of the Mississippi River Delta on October 17, 2016. Source: ang20161017_brdf_v1n2_Atcha.zip
Citation
Jensen, D.J., D.R. Thompson, I.B. Mccubbin, and M. Simard. 2021. Pre-Delta-X: L2 AVIRIS-NG Surface Spectral Reflectance across MRD, LA, USA, 2015-2016. ORNL DAAC, Oak Ridge, Tennessee, USA. https://doi.org/10.3334/ORNLDAAC/1826
Table of Contents
- Dataset Overview
- Data Characteristics
- Application and Derivation
- Quality Assessment
- Data Acquisition, Materials, and Methods
- Data Access
- References
Dataset Overview
This Level 2 (L2) dataset provides surface spectral reflectance data acquired over the Atchafalaya and Terrebonne basins of the Mississippi River Delta (MRD) of coastal Louisiana, USA, in 2015-2016. The data include georectified images with Lambertian-equivalent surface reflectance and composite mosaics with adjustments for Bidirectional Reflectance Distribution Function (BRDF) effects. The imagery was acquired by the Airborne Visible/Infrared Imaging Spectrometer - Next Generation (AVIRIS-NG), as part of the Pre-Delta-X campaign.
Pre-Delta-X was a joint airborne and field campaign in the MRD beginning Spring 2015 and continuing through Fall 2016. The Pre-Delta-X campaign conducted airborne remote sensing observations and field in situ measurements to characterize delta hydrology, water quality (e.g., total suspended solids), and vegetation structure. These data facilitate the continued development of sampling methods, algorithms, and models to support the upcoming airborne and field campaigns in support of the Delta-X mission.
Project: Delta-X
The Delta-X mission is a 5-year NASA Earth Venture Suborbital-3 mission to study the Mississippi River Delta in the United States, which is growing and sinking in different areas. River deltas and their wetlands are drowning as a result of sea level rise and reduced sediment inputs. The Delta-X mission will determine which parts will survive and continue to grow, and which parts will be lost. Delta-X begins with airborne and in situ data acquisition and carries through data analysis, model integration, and validation to predict the extent and spatial patterns of future deltaic land loss or gain.
Related Publications
Bue, B.D., D.R. Thompson, M. Eastwood, R.O. Green, B.C. Gao, D. Keymeulen, C.M. Sarture, A.S. Mazer, and H.H. Luong. 2015. Real-time atmospheric correction of AVIRIS-NG Imagery. IEEE Transactions on Geoscience and Remote Sensing 53(12):6419–6428. https://doi.org/10.1109/TGRS.2015.2439215
Jensen, D., M. Simard, K. Cavanaugh, and D.R. Thompson. 2017. Imaging spectroscopy BRDF correction for mapping Louisiana’s coastal ecosystems. IEEE Transactions on Geoscience and Remote Sensing 56:1739-1748. https://doi.org/10.1109/TGRS.2017.2767607
Jensen, D., K.C. Cavanaugh, M. Simard, G.S. Okin, E. Castañeda-Moya, A. McCall, and R.R. Twilley. 2019. Integrating imaging spectrometer and synthetic aperture radar data for estimating wetland vegetation aboveground biomass in coastal Louisiana. Remote Sensing 11(21):2533. https://doi.org/10.3390/rs11212533
Thompson, D.R., B.C. Gao, R.O. Green, D.A. Roberts, P.E. Dennison, and S.R. Lundeen. 2015. Atmospheric correction for global mapping spectroscopy: ATREM advances for the HyspIRI Preparatory Campaign. Remote Sensing of Environment 167:64–77. https://doi.org/10.1016/j.rse.2015.02.010
Related Datasets
Castaneda, E., A.I. Christensen, M. Simard, A. Bevington, R. Twilley, and A. Mccall. 2020. Pre-Delta-X: Vegetation Species, Structure, Aboveground Biomass, MRD, LA, USA, 2015. ORNL DAAC, Oak Ridge, Tennessee, USA. https://doi.org/10.3334/ORNLDAAC/1805
Acknowledgments
This work was supported by Jet Propulsion Laboratory Research and Technology Development (JPL-R&TD) FY17-19 (grants 01STCR / R.17.231.069)
Data Characteristics
Spatial Coverage: Atchafalaya and Terrebonne Basins, Mississippi River Delta (MRD) floodplain, southern coast of Louisiana, USA
Spatial Resolution: 3.0 to 5.4 m
Temporal Coverage: 2015-05-06 to 2016-10-22
Temporal Resolution: Multiple samples over several days
Site Boundaries: Latitude and longitude are given in decimal degrees.
| Site | Westernmost Longitude | Easternmost Longitude | Northernmost Latitude | Southernmost Latitude |
|---|---|---|---|---|
| Atchafalaya and Terrebonne Basins | -91.567 | -89.9339 | 29.9743 | 29.0738 |
Data File Information
There are 128 multiband ENVI files provided in a compressed archive (*.zip). Each archive contains either georectified images with Lambertian-equivalent surface reflectance (113 *.img files) or composite mosaics with adjustments for BRDF effects (15 *.dat files) and associated header (*.hdr) files containing metadata.
File Naming Conventions
The reflectance files have the naming convention angYYYYMMDDtHHMMSS_rfl_v1*.zip, where
YYYYMMDDtHHMMSS = the date and time of data acquisition in UTC format,
rel = reflectance, and
v1* = data processing model version, either "v1n2" or "v1e".
The BRDF files have the naming convention angYYYYMMDD_brdf_v1*_basin*.zip, where
YYYYMMDD = the date of data acquisition for the images used to create the mosaic,
brdf = Bidirectional Reflectance Distribution Function,
v1* = data processing model version, either "v1n2" or "v1e", and
basin* = the basin where the mosaics were collected, either “Atcha” and “Terre”, and may include "A" or "B", indicating that there are two mosaics.
Table 1. File names and descriptions. Each zip archive includes an ENVI file and its associated header file.
| File Name | File Formats | Description |
|---|---|---|
| angYYYYMMDDtHHNNSS_rfl_v1*_img.zip | .img, .hdr | Georectified images Lambertian equivalent surface reflectance (RFL); 113 files |
| angYYYYMMDD_brdf_v1*_basin.zip | .dat, .hdr | Composite mosaics with adjustments for Bidirectional Reflectance Distribution Function (BRDF) effects; 15 files |
Data File Details
The ENVI files have:
- Either 425 or 432 bands, covering wavelengths from 346-2505 nm at 5 nm resolution
- Horizontal spatial resolution is 3.0 to 5.4 m raster cells
- The range of valid surface reflectance values is 0.0-1.0
The no-data value is denoted by "-9999" and was embedded in the spectroscopic data for pixels to indicate invalid data, or bad data pixels, caused by an instrument error or areas at the periphery of an orthorectified image where no spectra are acquired. Clouds and other valid but unusable regions were still considered bona fide scene content and not altered. Some entire bands are marked as "bad" in the header files.
Some of the 425 or 432 individual bands were not useful. These bands are marked as "bad" in the header file and vary among the reflectance files. The extreme values from the bad bands are still included in the files and have NOT been set to the no-data value.
Some pixels have out-of-range values (e.g., due to clouds), and those pixels are included in this L2 dataset. These values have NOT been set to the no-data value and are included because these pixels may contain valid information for someone analyzing these images.
Each header file shares the same name as its corresponding ENVI file and provides the band quality metadata ("good" or "bad") needed to successfully use the images. The header is a plain text document and includes important information about the ENVI files, such as header offset, file type, data type, interleave, byte order, coordinate system, and the number of bands. The header also includes information specific to the dataset (Table 2).
Table 2. Information for ENVI files contained in the header files.
| Variable | Description |
|---|---|
| samples | number of columns in image file |
| lines | number of rows in the image file |
| data ignore value | no data value |
| wavelength units | units for band wavelengths |
| correction factors | a vector of parameters, one per band, used in BRDF |
| wavelength | a vector of wavelength values, one per band |
| fwhm | full width at half maximum, a vector of values, one for each band, measuring spectral resolution |
| bbl | a vector of 0 (bad) or 1 (good), which indicates bad bands |
| smoothing factors | a vector of values, one for each band, used for reducing noise in reflectance values |
Application and Derivation
Surface reflectance spectra are commonly used to measure properties of the surface composition. They can indicate water column constituents, soil composition, land cover, vegetation functional traits, etc. In this dataset, spectral reflectance values were derived by calibrating incident radiance spectra measured by the AVIRIS-NG sensor using the techniques described in Thompson et al. (2018) and Chapman et al. (2019). These radiances were then analyzed to remove atmospheric distortions using Lambertian-equivalent reflectance functions as described by Thompson et al. (2015). Finally, to create mosaics from multiple flight lines, the reflectance functions were transformed to remove Bidirectional Reflectance Distribution Function (BRDF) effects as in Jensen et al. (2017).
Quality Assessment
Data quality was monitored at several steps during acquisition and analysis. First, sensor operators in the aircraft performed a preliminary real-time assessment using a real-time display in the airplane cabin. They assessed images and spectra in a scrolling “waterfall” plot. This step allowed the identification of impinging clouds, instrument artifacts, or other issues that required adjustment or (in the worst case) immediate reacquisition. Second, “quick look” images produced in the field identified obvious visible artifacts or clouds. Third, representative spectra were used to assess the performance of data algorithms at each stage. These spectra were matched to in situ reference data in order to validate calibration and assess uncertainty, following procedures outlined in Thompson et. al. (2019a, 2019b). If needed, calibration could be adjusted using flight data following procedures in Thompson et al. (2018). Such adjustments were extremely rare and reserved as a fallback to provide an extra margin of safety.
The Level 1 (L1) AVIRIS-NG radiance data were atmospherically corrected using an adapted version of the ATmospheric REmoval (ATREM) algorithm (Thompson et al., 2015; Bue et al., 2015), producing the L2 surface reflectance datasets included here. The observed reflectance signals among flights were influenced by variation in solar and instrument viewing angles, manifesting as differences in illumination intensity across various surface cover types within each scene. These differences were measured using a modeled BRDF, and the BRDF effects were estimated and corrected using the adaptive reflectance geometric correction (ARGC) algorithm (Jensen et al., 2017) to create mosaic images.
Flags for bad data (i.e., -9999) were embedded in the spectroscopic data for pixels to indicate invalid data caused by an instrument error or areas at the periphery of an orthorectified image where no spectra are acquired. Clouds and other valid but unusable regions were still considered bona fide scene content and not altered. Some bands subject to atmospheric effects resulting in noise are designated in the bad bands list (bbl) in the header files.
Data Acquisition, Materials, and Methods
Image Collection
Spectral reflectance imagery of over portions of the Mississippi River Delta was collected by AVIRIS-NG, on an airborne platform in May-June 2015 and October 2016. AVIRIS-NG is a push-broom spectral mapping system with a high signal-to-noise ratio, designed and toleranced for high-performance spectroscopy. The instrument measures radiance across the electromagnetic spectrum from 380–2510 nm with a single Focal Plane Array, at a spectral sampling of approximately 5 nm. The AVIRIS-NG sensor has a 1 milliradian instantaneous field of view, providing altitude-dependent ground sampling distance ranging from sub-meter to 20 m scales. Its detector has a 640×480-pixel array, from which standard products are generated using the sensor’s 600 cross-track spatial samples and 425 spectral samples. The AVIRIS-NG was flown on a Dynamic Aviation King Air B200. The instrument has four components: 1) a sensor with its mount and camera glass mounted at a nadir port, 2) an onboard calibrator mounted in the cabin next to the sensor, 3) a forward operator electronics rack, and 4) an aft thermal-control electronics rack.
AVIRIS-NG acquired data in its standard operating mode over regions of interest in the Atchafalaya and Terrebonne basins. Each acquisition is a “flight line” forming a continuous strip of push-broom data that typically takes 1-10 minutes to acquire. Multiple aircraft overflights over multiple days were required to cover the study area. Planned flight lines had a 15% overlap area at their margins to accommodate positional and geometric sampling uncertainty. The precise direction of flight lines was adjusted to accommodate local time and weather conditions and to ameliorate sun glint effects. Because AVIRIS-NG’s data collection is impeded when clouds are present below or above the aircraft, the team typically decided which days to fly based on an early morning “go/no-go” decision from the daily weather forecast.
Image Processing
In this Level 2 dataset, spectral reflectance values were derived by calibrating incident radiance spectra measured by the AVIRIS-NG sensor using the techniques described in Thompson et al. (2018) and Chapman et al. (2019). These radiances were then analyzed to remove atmospheric distortions using Lambertian-equivalent reflectance functions by applying the ATREM algorithm to derive a surface reflectance image (Bue et al., 2015; Thompson et al., 2015). Finally, to create mosaics from multiple flight lines, the ARGC algorithm was applied to correct BRDF effects that cause across-track variations in observed illumination intensity (Jensen et al., 2017).
Data Access
These data are available through the Oak Ridge National Laboratory (ORNL) Distributed Active Archive Center (DAAC).
Pre-Delta-X: L2 AVIRIS-NG Surface Spectral Reflectance across MRD, LA, USA, 2015-2016
Contact for Data Center Access Information:
- E-mail: uso@daac.ornl.gov
- Telephone: +1 (865) 241-3952
References
Bue, B. D., D.R. Thompson, M. Eastwood, R.O. Green, B.C. Gao, D. Keymeulen, C.M. Sarture, A.S. Mazer, and H.H. Luong. 2015. Real-time atmospheric correction of AVIRIS-NG Imagery. IEEE Transactions on Geoscience and Remote Sensing 53(12):6419–6428. https://doi.org/10.1109/TGRS.2015.2439215
Chapman, J., D.R. Thompson, M.C. Helmlinger, M.L. Eastwood, S. Geier, R.O. Green, W. Olson-Duvall, and S.R. Lundeen. 2019. Spectral and radiometric calibration of the Next Generation Airborne Visible Infrared Spectrometer (AVIRIS-NG). Remote Sensing 11:2129. https://doi.org/10.3390/rs11182129
Jensen, D., M. Simard, K. Cavanaugh, and D. R. Thompson. 2017. Imaging spectroscopy BRDF correction for mapping Louisiana’s coastal ecosystems. IEEE Transactions on Geoscience and Remote Sensing 56:1739-1748. https://doi.org/10.1109/TGRS.2017.2767607
Jensen, D., K.C. Cavanaugh, M. Simard, G.S. Okin, E. Castañeda-Moya, A. McCall, and R.R. Twilley. 2019. Integrating imaging spectrometer and synthetic aperture radar data for estimating wetland vegetation aboveground biomass in coastal Louisiana. Remote Sensing 11(21):2533. https://doi.org/10.3390/rs11212533
Thompson, D.R., B.C. Gao, R.O. Green, D.A. Roberts, P.E. Dennison, and S.R. Lundeen. 2015. Atmospheric correction for global mapping spectroscopy: ATREM advances for the HyspIRI Preparatory Campaign. Remote Sensing of Environment 167:64–77. https://doi.org/10.1016/j.rse.2015.02.010
Thompson, D.R., J.W. Boardman, M.L. Eastwood, R.O. Green, J.M. Haag, and B. Van Gorp. 2018. Imaging spectrometer stray spectral response: in-flight characterization, correction, and validation. Remote Sensing of Environment 204:850–860. https://doi.org/10.1016/j.rse.2017.09.015
Thompson, D.R., K. Cawse-Nicholson, Z. Erickson, C. Fichot, C. Frankenberg, B-C. Gao, M.M. Gierach, R.O. Green, D. Jensen, V. Natraj, and A. Thompson. 2019a. A unified approach to estimate land and water reflectances with uncertainties for coastal imaging spectroscopy. Remote Sensing of Environment 231:111198. https://doi.org/10.1016/j.rse.2019.05.017
Thompson, D.R., L. Guanter, A. Berk, B-C. Gao, R. Richter, D. Schläpfer, and K.J. Thome. 2019b. Retrieval of atmospheric parameters and surface reflectance from VSWIR imaging spectroscopy. Surveys in Geophysics 40:333-360. https://doi.org/10.1007/s10712-018-9488-9