Documentation Revision Date: 2020-08-26
Dataset Version: 1
Summary
Pre-Delta-X was a joint airborne and field campaign in the MRD beginning Spring 2015 and continuing through Fall 2016. The Pre-Delta-X campaign conducted airborne (remote sensing) observations and field (in situ) measurements to characterize delta hydrology, water quality (e.g., total suspended solids), and vegetation structure. These data facilitate the continued development of sampling methods, algorithms, and models to support the upcoming airborne and field campaigns in support of the Delta-X mission.
There is one file with this dataset in comma-separated value (.csv) format.
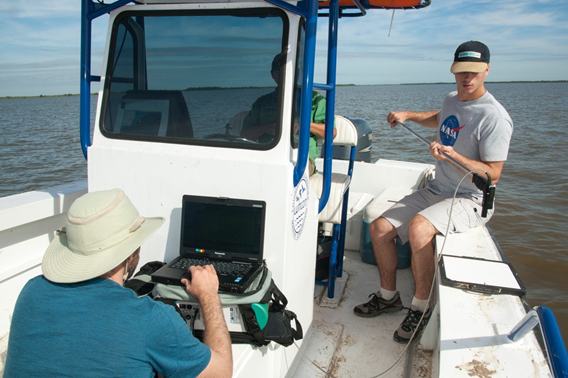
Figure 1. Collecting in situ spectral reflectance data with the Analytical Spectral Devices (ASD) FieldSpec 3 on the Atchafalaya River. Radiance measurements from the white reference panel are used to normalize radiance measurements from the water surface to calculate water-leaving reflectances, which were then used to derive remote sensing reflectances.
Citation
Jensen, D.J., T.M. Pavelsky, and C. Lion. 2020. Pre-Delta-X: Spectral Reflectance of Water Surface, Atchafalaya Basin, LA, USA, 2016. ORNL DAAC, Oak Ridge, Tennessee, USA. https://doi.org/10.3334/ORNLDAAC/1804
Table of Contents
- Dataset Overview
- Data Characteristics
- Application and Derivation
- Quality Assessment
- Data Acquisition, Materials, and Methods
- Data Access
- References
Dataset Overview
This dataset provides measurements of in situ remote-sensing reflectance (Rrs(λ); per steradian) of surface water across Atchafalaya Basin, southern coastal Louisiana, USA, within Mississippi River Delta (MRD) floodplain. The in situ spectral reflectance measurements were made during the Pre-Delta-X campaign in Fall 2016 (October 14–21). Hand-held spectrometer measurements were collected from a boat at 35 locations selected to represent a range of suspended sediment concentrations and properties from a variety of hydrodynamic and physical settings typically encountered across the Atchafalaya and Terrebonne basins. These 35 spectral reflectance measurements were collected at 24 unique sites that coincide with measurements of total suspended solids (TSS). The data serves two main purposes, to ground-truth the remote-sensing reflectance derived from NASA’s Airborne Visible-Infrared Imaging Spectrometer - Next Generation (AVIRIS-NG) instrument and to calibrate and validate algorithms for the retrieval of TSS from AVIRIS-NG.
Pre-Delta-X was a joint airborne and field campaign in the MRD beginning Spring 2015 and continuing through Fall 2016. The Pre-Delta-X campaign conducted airborne (remote sensing) observations and field (in situ) measurements to characterize delta hydrology, water quality (e.g., total suspended solids), and vegetation structure. These data facilitate the continued development of sampling methods, algorithms, and models to support the upcoming airborne and field campaigns in support of the Delta-X mission.
Project: Delta-X
The Delta-X mission is a NASA Earth Venture Suborbital-3 mission to study the Mississippi River Delta in the United States, which is growing and sinking in different areas. River deltas and their wetlands are drowning as a result of sea level rise and reduced sediment inputs. The Delta-X mission will determine which parts will survive and continue to grow, and which parts will be lost. Delta-X begins with airborne and in situ data acquisition and carries through data analysis, model integration, and validation to predict the extent and spatial patterns of future deltaic land loss or gain.
Related Publication
Jensen, D., Simard, M., Cavanaugh, K., Sheng, Y., Fichot, C.G., Pavelsky, T., and Twilley, R. 2019. Improving the Transferability of Suspended Solid Estimation in Wetland and Deltaic Waters with an Empirical Hyperspectral Approach. Remote Sensing, 11(13):1629. https://doi.org/10.3390/rs11131629
Related Datasets
Additional Pre-Delta-X datasets are available on the ORNL DAAC Delta-X project page.
Acknowledgments
This work was supported by the Delta-X mission, funded under the NASA Earth Venture Suborbital-3 (EVS-3) program, and JPL Research and Technology Development Strategic R&TD FY17-19.
Data Characteristics
Spatial Coverage: Atchafalaya Basin, Mississippi River Delta (MRD) floodplain, Southern coast of Louisiana, USA
Spatial Resolution: Points
Temporal Coverage: 2016-10-14 to 2016-10-21
Temporal Resolution: One-time measurement
Study Area: Latitude and longitude are given in decimal degrees.
| Site | Westernmost Longitude | Easternmost Longitude | Northernmost Latitude | Southernmost Latitude |
|---|---|---|---|---|
| Atchafalaya Basin | -91.485898 | -90.99639 | 29.744005 | 29.41683 |
Data File Information
There is one file with 35 observations of remotely sensed reflectance data in comma-separated value (.csv) format provided with the dataset: PreDeltaX_WaterReflectance_Atchafalaya _Fall2016.csv
Table 1. Variable names and descriptions.
| Variable | Units | Description |
|---|---|---|
| basin | Atchafalaya | |
| site_id | Location within the basin; each sampling site was named using one of the abbreviations in Table 2 and a sequential number indicating its order of collection; co-located with total suspended sediment sampling | |
| campaign | Fall_2016 | |
| latitude | decimal degrees | Latitude of site |
| longitude | decimal degrees | Longitude of site |
| time | YYYY-MM-DD hh:mm | Time of sampling in UTC |
| rrsX | sr-1 | Remote-sensing reflectance [Rrs(λ)] per steradian (sr-1) as measured above the water surface at the indicated wavelength (X nm); measurements are at ~5 nm intervals from 446.56 to 1002.52 nm spectral range; there are 112 columns of reflectance values. |
Application and Derivation
The data served two main purposes: 1) to ground-truth the remote-sensing reflectance derived from AVIRIS-NG, and 2) to calibrate and validate algorithms for the retrieval of TSS from AVIRIS-NG. Additionally, this dataset is one of a few in-situ datasets that will be used to calibrate and validate Delta-X hydrodynamic and ecogeomorphic models. The models will quantify the mesoscale (i.e., on the order of 1 ha) patterns of soil accretion that control land loss and gain and predict the resilience of deltaic floodplains under projected relative sea-level rise. Accretion, as well as plant productivity, is controlled by transport and deposition of sediment.
Quality Assessment
Good data quality is ensured by making sure that the in situ spectrometric measurements are collected in the best conditions possible, as recommended by Mobley (1999, 2015), and by recording the important ancillary information (solar zenith angle, wind speed) needed for the calculation of accurate Rrs(λ).
The measurements of Rrs(λ) were avoided during rapidly changing optical conditions (highly variable cloud conditions) and during very windy conditions. To control for the variable atmospheric moisture content and cloud activity in this coastal region, data were collected in Digital Number (DN) format and by alternating between the white reference calibration panel and the target water surface at nadir. Great care was taken to make measurements away from the boat hull and to avoid optical interference by the people making the spectrometric measurements.
Each spectrum was inspected for irregularities (e.g., erroneous steps in the spectrum, contamination by floating matter, or abnormal brightness caused by sunglint) with a small number being discarded.
After processing, the in situ Rrs(λ) spectra were closely examined for unusual shape and magnitude. The Rrs(λ) values in the red and near-infrared were compared with the surface TSS concentration and turbidity measurements made at the same stations in order to provide a first assessment of the data quality. The data collected during the AVIRIS-NG flyovers allowed a direct comparison of these in situ Rrs(λ) with the AVIRIS-NG Rrs(λ) and helped identify potential issues with the data.
Data Acquisition, Materials, and Methods
Study Area
The study area was the Atchafalaya basin on the southern coast of Louisiana within the MRD floodplain (Figure 2). The Mississippi Delta was formed as a series of overlapping lobes over the past 6000–7000 years and consists of two physiographic units, the Deltaic plain to the east and Chenier plain to the west. The deltaic plain contains the Atchafalaya River, a major distributary of the Mississippi River that dominates the study site and which terminates at the Wax Lake and Atchafalaya Deltas (Roberts, 1997). These deltas receive water and sediment discharge from the Atchafalaya River, which is maintained at 30% of the combined discharge of the Mississippi and Red Rivers. April is considered the early phase of the vegetation growing season and the peak of the spring river flood season. Several of the selected sites for field measurements are part of the Coastal Reference Monitoring System (CRMS, Steyer et al. 2003).
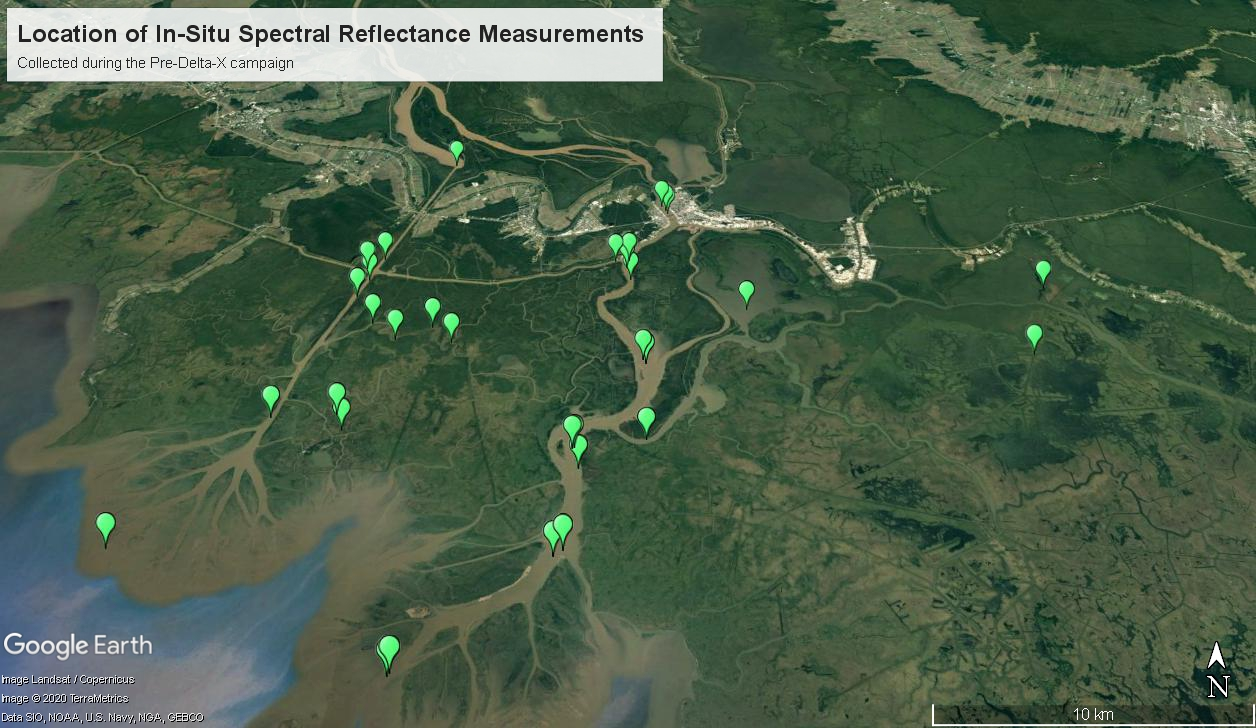
Figure 2. Locations of the 35 sites for in situ spectral reflectance measurements across the Atchafalaya basin.
Study Sites
Some site names contain acronyms or are a shortened location name. Please refer to the table of site name descriptions below. All in situ Rrs(λ) spectra measurements were collected at the same sites that TSS measurements were taken. An intensive site is a site where measurements for more than one dataset were collected. The site names are labeled with an IS prefix in the data file to denote an intensive site. There are 35 distinct measurements at 24 distinct locations, but given proximity, some measurements were assigned the same site ID.
Table 2. Site names and abbreviations
| Abbreviated Site Name | Full Site Name |
|---|---|
| Atch | Atchafalaya |
| WLD | Wax Lake Delta |
| WICWW | Wax Lake Intracoastal Waterway |
| AICWW | Atchafalaya Intracoastal Waterway |
Data Collection and Processing
The in situ Rrs(λ) was collected from the boat in large and small channels at 35 locations carefully chosen to span a representative range of suspended sediment concentration and properties (i.e., particle size distribution, organic matter content) from a variety of hydrodynamic and physical settings typically encountered across the Atchafalaya basin (Figure 2).
An Analytical Spectral Devices, Inc. (ASD) FieldSpec 3 spectrometer and the general above-water methodology employed by Doxaran et al. (2002) and Gómez (2014) were used to estimate Rrs(λ) within the 446.56-1002.52 nm spectral range. Ten alternating pairs of measurements, alternating between the white reference calibration panel and the target water surface at nadir, were captured for each target site. Each set of in situ spectra was then processed to compile a table of reflectance data with which to model TSS.
The ratio of above-water radiance over that of white-reference radiance was divided by π and by the albedo of the white reference panel (~99%) to derive estimates of water-leaving radiance (uncorrected for the influence of skylight reflectance) divided by the downwelling irradiance at the surface. The spectrometer data was truncated to the visible near-infrared (VNIR) domain, ranging from 400–1000 nm, to excise shortwave infrared (SWIR) bands where water attenuates radiation. These selected spectra were then averaged together for each sample site, calculating a single reflectance spectrum with 1-nm spectral resolution.
Spectra were convolved to match AVIRIS-NG’s 5-nm sampling by using a Gaussian function defined by each AVIRIS-NG band’s Full Width at Half-Maximum (FWHM) reported in the flight line header file. Each 1-nm reflectance value from the in situ spectra that fell within the corresponding 5-nm AVIRIS-NG band was input into the function and the output values were normalized by dividing outputs by the sum of their absolute values. The normalized output and observed reflectance matrices were multiplied to return each simulated AVIRIS-NG band response. A correction was then applied to the “uncorrected” spectra to account for the reflectance of skylight at the air-water interface and derive Rrs.
Percent cloud cover was estimated based on observation at each sample site, while solar zenith angle was calculated for each location using its associated GPS point and time. Wind speed, atmospheric pressure, and air temperature measured for each time and location were obtained from the nearest local meteorological station in Morgan City, Louisiana Morgan City, LA (Station ID: KLAMORGA15, 29.68972, -91.195; data accessed at https://www.timeanddate.com/weather/@4333811).
These parameters were used as inputs for Hydrolight simulations of the ratios of skylight surface reflected (upwelling) radiance at nadir normalized to the downwelling irradiance. Estimates of skylight surface reflectance were then subtracted from the uncorrected spectra to make the correction. A final correction was made from these spectra by subtracting the reflectance value measured at 1000 nm from each spectrum, under the assumption that water-leaving radiance at 1000 nm is null and that any residual measured reflectance is caused by uncorrected sunglint.
Data Access
These data are available through the Oak Ridge National Laboratory (ORNL) Distributed Active Archive Center (DAAC).
Pre-Delta-X: Spectral Reflectance of Water Surface, Atchafalaya Basin, LA, USA, 2016
Contact for Data Center Access Information:
- E-mail: uso@daac.ornl.gov
- Telephone: +1 (865) 241-3952
References
Doxaran, D., Froidefond, J.-M., Lavender, S., and Castaing, P. (2002). Spectral signature of highly turbid waters: Application with SPOT data to quantify suspended particulate matter concentrations. Remote Sensing of Environment, 81(1):149–161. https://doi.org/10.1016/S0034-4257(01)00341-8
Gómez, R.A. 2014. Spectral Reflectance Analysis of the Caribbean Sea. Geofísica Internacional, 53(4):385–398. https://doi.org/10.1016/S0016-7169(14)70073-X
Jensen, D., Simard, M., Cavanaugh, K., Sheng, Y., Fichot, C.G., Pavelsky, T., and Twilley, R. 2019. Improving the Transferability of Suspended Solid Estimation in Wetland and Deltaic Waters with an Empirical Hyperspectral Approach. Remote Sensing, 11(13):1629. https://doi.org/10.3390/rs11131629
Mobley, C.D. 1999. Estimation of the remote-sensing reflectance from above-surface measurements. Applied Optics, 38(36):7442–7455. https://doi.org/10.1364/AO.38.007442
Mobley, C.D. 2015. Polarized reflectance and transmittance properties of windblown sea surfaces. Applied Optics, 54(15), p.4828. https://doi.org/10.1364/AO.54.004828
Roberts, H.H. 1997. Dynamic changes of the Holocene Mississippi River delta plain: The delta cycle. Journal of Coastal Research, 605–627. https://www.jstor.org/stable/4298659
Steyer, G.D., C.E. Sasser, J.M. Visser, E.M. Swenson, J.A. Nyman, and R.C. Raynie. 2003. A proposed coast-wide reference monitoring system for evaluating wetland restoration trajectories in Louisiana. Environmental Monitoring and Assessment, 81(1/3):107–117. https://doi.org/10.1023/A:1021368722681