Documentation Revision Date: 2022-09-15
Dataset Version: 3
Summary
This is Version 3 of this dataset, which supersedes Version 2.
This dataset holds 31 files in comma separated values (CSV) format.

Figure 1. Installation of turbidity sensor in Mike Island study area of the Wax Lake Delta in coastal Louisiana.
Citation
Nghiem, J., G. Salter, K.A. Wright, P. Passalacqua, and M.P. Lamb. 2022. Delta-X: Turbidity, Water and Air Pressure, Temperature, MRD, Louisiana, 2021, V3. ORNL DAAC, Oak Ridge, Tennessee, USA. https://doi.org/10.3334/ORNLDAAC/2113
Table of Contents
- Dataset Overview
- Data Characteristics
- Application and Derivation
- Quality Assessment
- Data Acquisition, Materials, and Methods
- Data Access
- References
- Dataset Revisions
Dataset Overview
This dataset provides turbidity measurements with co-located water and air pressure and temperature measurements in portions of the Mississippi River Delta, coastal Louisiana, US. Data were collected at five sites in Atchafalaya River Basin in Spring (2021-03-24 to 2021-04-02) and eight sites in the Atchafalaya River and Terrebonne Basins in Fall 2021 (2021-08-16 to 2021-08-27). In order to sample various hydrodynamic conditions, sensors were deployed at island edges, island interior, and other portions of wetlands. Sensors recorded turbidity, absolute pressure, and temperature. The Delta-X mission is a 5-year NASA Earth Venture Suborbital-3 mission to study the Mississippi River Delta in the United States, which is growing and sinking in different areas. River deltas and their wetlands are drowning as a result of sea level rise and reduced sediment inputs. The Delta-X mission will determine which parts will survive and continue to grow, and which parts will be lost. Delta-X begins with airborne and in situ data acquisition and carries through data analysis, model integration, and validation to predict the extent and spatial patterns of future deltaic land loss or gain. The data are provided in comma-separated values (CSV) files.
Project: Delta-X
The Delta-X mission is a 5-year NASA Earth Venture Suborbital-3 mission to study the Mississippi River Delta in the United States, which is growing and sinking in different areas. River deltas and their wetlands are drowning as a result of sea level rise and reduced sediment inputs. The Delta-X mission will determine which parts will survive and continue to grow, and which parts will be lost. Delta-X begins with airborne and in situ data acquisition and carries through data analysis, model integration, and validation to predict the extent and spatial patterns of future deltaic land loss or gain.
Acknowledgments
This work was supported by NASA's Earth Venture Suborbital-3 (EVS-3) program (grant NNH17ZDA001N-EVS3) and Jet Propulsion Laboratory's Research and Technology Development (R&TD FY17-19) funding.
Data Characteristics
Spatial Coverage: Atchafalaya River and Terrebonne Basins, Louisiana, USA
Spatial Resolution: Point samples.
Temporal Coverage: 2021-03-24 to 2021-08-27
Temporal Resolution: Continuous readings, recorded at one minute intervals
Site Boundaries: Latitude and longitude are given in decimal degrees.
| Site | Westernmost Longitude | Easternmost Longitude | Northernmost Latitude | Southernmost Latitude |
|---|---|---|---|---|
| Atchafalaya River and Terrebonne Basins, Louisiana | -91.445 | -90.822 | 29.510 | 29.171 |
Data File Information
This dataset consists of 31 files in comma-separated values (CSV) format.
The files DeltaX_Spring2021_turbidity_pressure_METADATA.csv and DeltaX_Fall2021_turbidity_pressure_METADATA.csv contain metadata for each of the sampling stations. These files hold information for all the turbidity, water pressure, and air pressure measurements. These include station IDs, GPS coordinates, install and uninstall times, water depth at install and uninstall times, and the relative positions of the sensors with respect to the bed.
The remaining 29 CSV files are organized according to the type of measurement and measurement site. The different types of measurements are turbidity (Sensor = Turbidity), water pressure (Sensor = WaterPressure), and air pressure (Sensor = AirPressure).
The naming convention for these files is DeltaX_AAAA_BBBB_basin_siteid_station.csv (e.g., DeltaX_Fall2021_AirPressure_Atchafalaya_MikeIsland_MW_channel.csv), where
- AAAA = "Spring2021" or "Fall2021" field season
- BBBB = sensor: "Turbidity" or "WaterPressure" or "AirPressure"
- basin = "Atchafalaya" or "Terrebonne"
- siteid = site name: "MikeIsland" or "421"
- station = station name, which may include an embedded "_" (e.g., "ME_channel")
Missing data or are indicated with the value -9999. Gaps in turbidity and water pressure data were caused when low tides exposed turbidity sensors to air. Out-of-bounds measurements of turbidity (i.e., <0 or >1000 NTU) are indicated with value -8888.
Table 1. Variables in turbidity data files. NTU = Nephelometric Turbidity Unit.
| Variable | Units | Description |
|---|---|---|
| instrument | Name of the instrument | |
| time | YYYY-MM-DD hh:mm:ss | Time of measurement in UTC |
| measured_temperature | degrees C | Temperature measured by turbidity sensors |
| measured_turbidity | NTU | Measured instantaneous turbidity values |
| cleaned_turbidity | NTU | Instantaneous turbidity measurements where out-of-bounds values are indicated by -8888. A measurement was considered to be out-of-bounds if <0 or >1000 NTU. |
| turbidity_1min_avg | NTU | Average of measured turbidity values over a 1-minute window |
| turbidity_1min_max | NTU | Maximum of measured turbidity values over a 1-minute window |
| turbidity_1min_min | NTU | Minimum of measured turbidity values over a 1-minute window |
| turbidity_1min_sd | NTU | Standard deviation of measured turbidity values over a 1-minute window |
Table 2. Variables in the water pressure and air pressure data files.
| Variable | Units | Description |
|---|---|---|
| instrument | - | Name of the instrument |
| time | YYYY-MM-DD hh:mm:ss | Time of measurement in UTC |
| measured_pressure | kPa | For air pressure sensor: Pressure measured by air pressure sensor. For water pressure sensor: Pressure measured by water pressure sensor (absolute pressure uncorrected for atmospheric pressure). |
| measured_temperature | degrees C | Temperature measured by pressure sensor. For air pressure sensor: Air temperature. For water pressure sensor: Water temperature. However, there might be periods of time when water pressure sensor was exposed to air at low tides. In that case, temperature corresponds to air temperature. |
Table 3. Variables in DeltaX_Spring2021_turbidity_pressure_METADATA.csv and DeltaX_Fall2021_turbidity_pressure_METADATA.csv.
| Variable | Units | Description |
|---|---|---|
| basin | - | River basin name, “Atchafalaya” |
| campaign | - | "Spring 2021" or "Fall 2021" field season |
| site_id | - | Location within the basin |
| station id | - | Location within site |
| sensor_type | - | Type of sensor: “turbidity,” “water pressure,” or “air pressure" |
| instrument | - | Name of the instrument |
| latitude | degree_north | Latitude of station in decimal degrees |
| longitude | degree_east | Longitude of station in decimal degrees |
| time_install | YYYY-MM-DD hh:mm:ss | Time of measurement station installation |
| time_uninstall | YYYY-MM-DD hh:mm:ss | Time of measurement station uninstallation |
| depth_install | cm | Local water depth at measurement station at the installation time |
| depth_uninstall | cm | Local water depth at measurement station at the uninstallation time |
| sensor_to_rodtop | cm | Distance between sensor elevation and top of installation rod |
| bed_to_rodtop | cm | Distance between local bed elevation and top of installation rod |
| bed_to_sensor | cm | Distance between bed and sensor elevation |
| notes | - | Any additional notes or descriptions |
Application and Derivation
This dataset is one of a few in-situ datasets that are used to calibrate and validate Delta-X’s hydrodynamic models. Turbidity data provide time series records of sediment coming in to the island and within the island. Water pressure combined with air pressure can be used to compute the flow depth. These measurements are compared to numerical models to calibrate and validate its parameters. The hydrology models quantify the mesoscale (i.e., on the order of 1 ha) patterns of soil accretion that control land loss and gain and predict the resilience of deltaic floodplains under projected relative sea-level rise. Understanding and mitigating the impact of the relative sea-level rise on coastal deltas is urgent. If ignored, relative sea-level rise will very soon have devastating consequences on the livelihood of the half-billion people that live in these low-lying coastal regions.
Quality Assessment
For the turbidity data, out-of-bounds values (i.e., <0 or >1000 NTU) were removed from the cleaned_turbidity variable and indicated by value of -8888. The mean, standard deviation, and range of turbidity values recorded during a 1-minute window provide measures of variability. No other quality assessment processes were performed.
Data Acquisition, Materials, and Methods
To monitor turbidity with temperature and pressure of air and water, two different turbidity and two different pressure sensors were deployed: an Observator NEP-595 or a Campbell Scientific OBS-3+ turbidity sensor. The data logging and power hardware were self-contained in the Observator sensors, whereas the Campbell Scientific sensors required connection to an external battery and data logger contained in a case suspended from a tripod (Figure 3). Either an Onset HOBO U20L or Solinst Levelogger Junior Edge Model 3001 pressure sensor was used to measure water and air pressures. The sensors recorded turbidity, absolute pressure, and temperature.
During Spring 2021, turbidity sensors and co-located water pressure sensors were deployed at five sites within Mike Island (Figure 2B) in the Wax Lake Delta of Atchafalaya River Basin in coastal Louisiana. Two stations were located on the island edges to monitor turbidity from the channels that feed the island and to compare with turbidity values within the island. These stations were installed from an outboard boat. The other three stations were located within the island interior and were installed by airboat.
During Fall 2021, turbidity sensors and co-located water pressure sensors were deployed at eight sites in Atchafalaya and Terrebonne Basins. The four Atchafalaya sites were all located at Mike Island in the Wax Lake Delta in island edge and island interior locations. The remaining four sites were in Terrebonne basin and were proximal to the Louisiana Coastwide Reference Monitoring System (CRMS) site 421. These stations were installed in different parts of the wetland expected to have different levels of hydrological connectivity (Figure 2C).
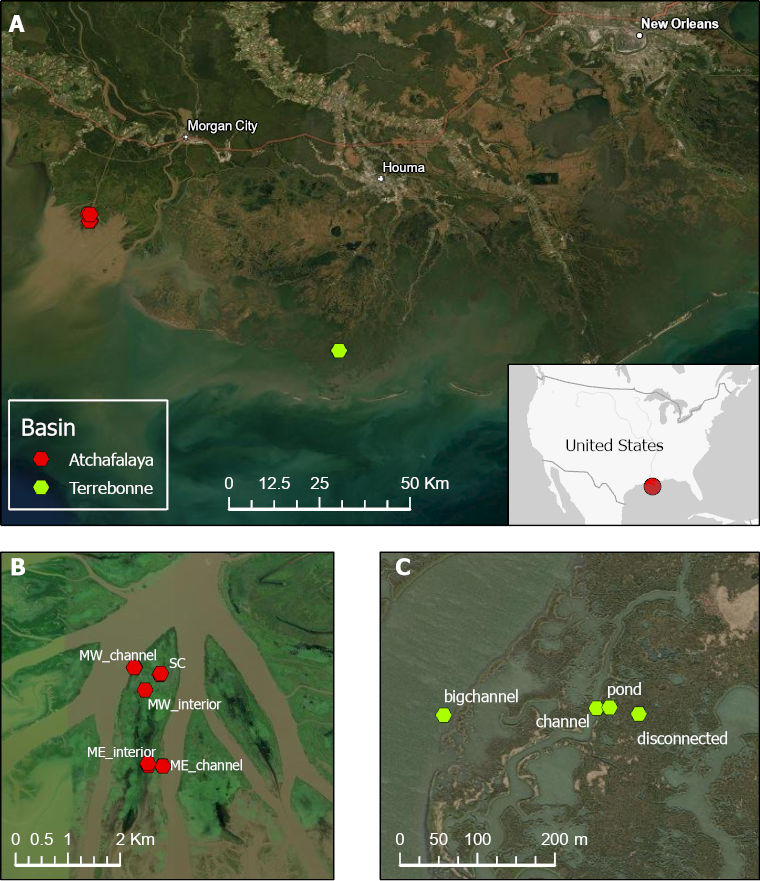
Figure 2. Locations of turbidity sampling stations in Mississippi River Delta of coastal Louisiana during 2021. (A) Locations of Atchafalaya and Terrebonne stations within the delta. (B) Sites around Mike Island in Wax Lake Delta in Atchafalaya basin. (C) Sites in the Terrebonne basin near CRMS site 421.
At each site, the turbidity and water pressure sensors were mounted to a rod or PVC pipe driven into the mud for stability. The power and data logger were located within a case that was suspended from a tripod (Figures 1 and 3).
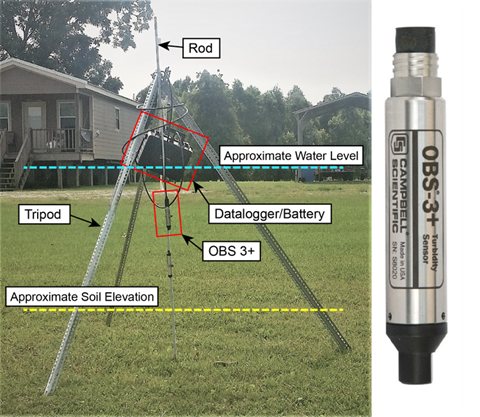
Figure 3. Annotated image of turbidity sensor setup using a Campbell Scientific OBS-3+ turbidity sensor.
Data Access
These data are available through the Oak Ridge National Laboratory (ORNL) Distributed Active Archive Center (DAAC).
Delta-X: Turbidity, Water and Air Pressure, Temperature, MRD, Louisiana, 2021, V3
Contact for Data Center Access Information:
- E-mail: uso@daac.ornl.gov
- Telephone: +1 (865) 241-3952
References
None cited or provided.
Dataset Revisions
|
Version |
Release Date |
Revision Notes |
|
3.0 |
2022-09-15 |
Fall and Spring 2021 data updated. New variables added to turbidity, pressure, and temperature files. |
|
2.0 |
2022-09-15 |
Fall 2021 data added. Title revised. Spring 2021 data reprocessed and updated. |
|
1.0 |
2022-04-20 |
Original release with Spring 2021 data. |