Documentation Revision Date: 2022-04-20
Dataset Version: 1
Summary
This dataset includes 12 files in comma-separated values (CSV) format.
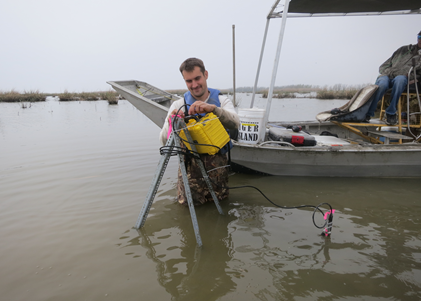
Figure 1. Installing turbidity sensor in Mike Island study area of the Wax Lake Delta in coastal Louisiana.
Citation
Salter, G., and J. Nghiem. 2021. Delta-X: Turbidity and Water Pressure Measurements, Mike Island in Wax Lake Delta, LA. ORNL DAAC, Oak Ridge, Tennessee, USA. https://doi.org/10.3334/ORNLDAAC/1993
Table of Contents
- Dataset Overview
- Data Characteristics
- Application and Derivation
- Quality Assessment
- Data Acquisition, Materials, and Methods
- Data Access
- References
Dataset Overview
This dataset provides turbidity measurements with co-located water pressure measurements. Data was collected in the Atchafalaya River Basin from 2021-03-24 to 2021-04-02 as part of the Spring 2021 Delta-X campaign. During the field campaign, sensors were deployed at five sites within Mike Island in Wax Lake Delta, Louisiana.
The Delta-X mission is a 5-year NASA Earth Venture Suborbital-3 mission to study the Mississippi River Delta in the United States, which is growing and sinking in different areas. River deltas and their wetlands are drowning as a result of sea level rise and reduced sediment inputs. The Delta-X mission will determine which parts will survive and continue to grow, and which parts will be lost. Delta-X begins with airborne and in situ data acquisition and carries through data analysis, model integration, and validation to predict the extent and spatial patterns of future deltaic land loss or gain. The data are provided in comma-separated values (CSV) files.
Project: Delta-X
The Delta-X mission is a 5-year NASA Earth Venture Suborbital-3 mission to study the Mississippi River Delta in the United States, which is growing and sinking in different areas. River deltas and their wetlands are drowning as a result of sea level rise and reduced sediment inputs. The Delta-X mission will determine which parts will survive and continue to grow, and which parts will be lost. Delta-X begins with airborne and in situ data acquisition and carries through data analysis, model integration, and validation to predict the extent and spatial patterns of future deltaic land loss or gain.
Acknowledgments
This work was supported by NASA's Earth Venture Suborbital-3 (EVS-3) program (grant NNH17ZDA001N-EVS3).
Data Characteristics
Spatial Coverage: Wax Lake Delta, southern coast of Louisiana, USA
Spatial Resolution: Point samples, spaced 30 m apart along transects.
Temporal Coverage: 2021-03-24 to 2021-04-02
Temporal Resolution: Continuous readings, recorded at one minute intervals
Site Boundaries: Latitude and longitude are given in decimal degrees.
| Site | Westernmost Longitude | Easternmost Longitude | Northernmost Latitude | Southernmost Latitude |
|---|---|---|---|---|
| Wax Lake Delta, Louisiana | -91.4452 | -91.4402 | 29.5104 | 29.4933 |
Data File Information
This dataset consists of 12 comma-separated values (CSV) format. Eleven files hold raw data from the sensors.
The naming convention for 11 data files is DeltaX_AAAA_Atcha_MikeIsland_BBBBB.csv (e.g., DeltaX_Turbidity_Atcha_MikeIsland_ME_interior.csv), where
- AAAA = instrument: "Turbidity" or "WaterPressure" or "AirPressure"
- BBBB = station name: "ME_channel", "ME_interior", "MW_channel", "MW_interior", or "SC"
- "Atcha" (Atchafalaya) is the basin name, and the site ID is "Mike Island"
The file DeltaX_turbidity_pressure_Atcha_MikeIsland_METADATA.csv contains metadata for each of the sampling stations.
The no data value is -9999. Gaps in turbidity data were caused when low tides exposed turbidity sensors to air.
Table 1. Variables in Turbidity data files. NTU = Nephelometric Turbidity Unit.
| Variable | Units | Description |
|---|---|---|
| time | YYYY-MM-DD hh:mm:ss | Time of sampling in UTC |
| measured_temperature | degree_C | Temperature measured by pressure or turbidity sensors |
| measured_turbidity | NTU | Measured instantaneous turbidity values over a 1-minute window |
| turbidity_1min_avg | NTU | Average of measured turbidity values over a 1-minute window |
| turbidity_1min_max | NTU | Maximum of measured turbidity values over a 1-minute window |
| turbidity_1min_min | NTU | Minimum of measured turbidity values over a 1-minute window |
| turbidity_1min_sd | NTU | Standard deviation of measured turbidity values over a 1-minute window |
Table 2. Variables in the water pressure and air pressure data files.
| Variable | Units | Description |
|---|---|---|
| time | YYYY-MM-DD hh:mm:ss | Time of sampling in UTC |
| measured_pressure | kPa | For air pressure sensor: Pressure measured by air pressure sensor. For water pressure sensor: Pressure measured by water pressure sensor (absolute pressure uncorrected for atmospheric pressure). |
| measured_temperature | degree_C | Temperature measured by pressure sensor. For air pressure sensor: Air temperature. For water pressure sensor: Water temperature. However, there might be periods of time when water pressure sensor was exposed to air at low tides. In that case, temperature corresponds to air pressure. |
Table 3. Variables in DeltaX_turbidity_pressure_Atcha_MikeIsland_METADATA.csv.
| Variable | Units | Description |
|---|---|---|
| basin | - | River basin name, “Atchafalaya” |
| site_id | - | Location within the basin |
| station id | - | Location within site |
| sensor_type | - | Type of sensor: “turbidity,” “water pressure,” or “air pressure" |
| latitude | degree_north | Latitude of station in decimal degrees |
| longitude | degree_east | Longitude of station in decimal degrees |
| time_install | YYYY-MM-DD hh:mm:ss | Time of measurement station installation |
| time_uninstall | YYYY-MM-DD hh:mm:ss | Time of measurement station uninstallation |
| depth_install | cm | Local water depth at measurement station at the installation time |
| depth_uninstall | cm | Local water depth at measurement station at the uninstallation time |
| sensor_to_rodtop | cm | Distance between sensor elevation and top of installation rod |
| bed_to_rodtop | cm | Distance between local bed elevation and top of installation rod |
| bed_to_sensor | cm | Distance between bed and sensor elevation |
| notes | - | Any additional notes or descriptions |
Application and Derivation
These in situ data are used to calibrate and validate Delta-X’s hydrodynamic models. Turbidity data provide time series records of sediment coming to the island and turbidity values within the island. Water pressure combined with air pressure can be used to compute the flow depth. These measurements are compared to numerical models to calibrate and validate its parameters. The hydrology models quantify the mesoscale (i.e., on the order of 1 ha) patterns of soil accretion that control land loss and gain and predict the resilience of deltaic floodplains under projected relative sea-level rise. Understanding and mitigating the impact of the relative sea-level rise on coastal deltas is urgent. If ignored, relative sea-level rise will very soon have devastating consequences on the livelihood of the half-billion people that live in these low-lying coastal regions.
Quality Assessment
The files provide raw data from the installed sensors. For turbidity measurements, the mean, minimum, maximum, and standard deviation over one-minute sample windows are included. Gaps in turbidity data were caused when low tides exposed turbidity sensors to air. Otherwise, data quality and uncertainty were not assessed.
Data Acquisition, Materials, and Methods
Turbidity sensors and co-located water pressure sensors were deployed at five sites within Mike Island (Fig. 2) in the Wax Lake Delta of Atchafalaya River Basin in coastal Louisiana. Two stations were located on the island edges to monitor turbidity from the channels that feed the island and to compare with turbidity values within the island. These stations were installed from an outboard boat. The other three stations were located within the island interior and were installed by airboat.
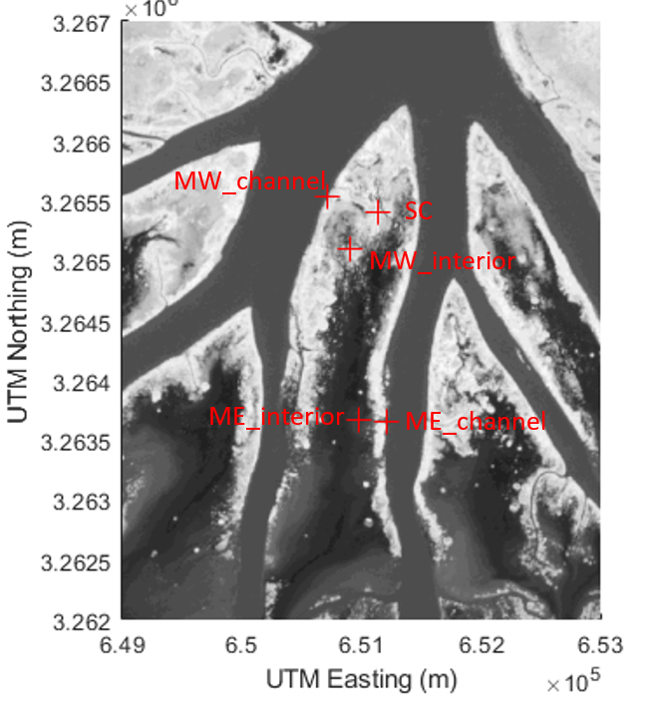
Figure 2. Locations of sampling stations around Mike Island in Wax Lake Delta, Louisiana.
The turbidity sensor and water pressure sensors were placed on rods driven into the mud. The power and data logger were located within a case that was suspended from the tripods (Fig. 3). The sensors record turbidity, absolute pressure, temperature.
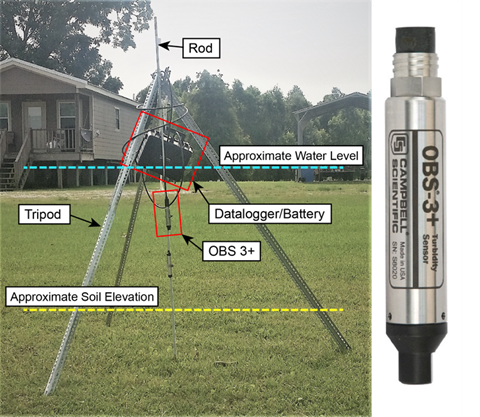
Figure 3. Annotated image of turbidity sensor setup.
Data Access
These data are available through the Oak Ridge National Laboratory (ORNL) Distributed Active Archive Center (DAAC).
Delta-X: Turbidity and Water Pressure Measurements, Mike Island in Wax Lake Delta, LA
Contact for Data Center Access Information:
- E-mail: uso@daac.ornl.gov
- Telephone: +1 (865) 241-3952
References
Not cited or provided.