Documentation Revision Date: 2022-10-06
Dataset Version: 2
Summary
There are four data files in comma-separated (.csv) format with this dataset.

Figure 1. LISST-200X being deployed by hand off the side of the boat (left), and position of the deployed LISST-200X for the surface measurement (right).
Citation
Fichot, C.G., and J. Harringmeyer. 2022. Delta-X: In situ Beam Attenuation and Particle Size from LISST-200X, 2021. ORNL DAAC, Oak Ridge, Tennessee, USA. https://doi.org/10.3334/ORNLDAAC/2077
Table of Contents
- Dataset Overview
- Data Characteristics
- Application and Derivation
- Quality Assessment
- Data Acquisition, Materials, and Methods
- Data Access
- References
- Dataset Revisions
Dataset Overview
This dataset provides in situ measurements of beam attenuation coefficient at 670 nm, average suspended particle size, particle size distribution, and water temperature in surface waters (~0.5 m) of the Atchafalaya and Terrebonne Basins on the southern coast of Louisiana. The field studies were conducted in the Spring and Fall in support of the Delta-X mission and include measurements made in 2021 during March 25 - April 22 and August 14 - September 24. Measurements were made using the Sequoia Scientific Laser In-Situ Scattering and Transmissometer instrument (LISST-200X) in multiple channels of varying width (from a few meters to >100m), near Delta-X intensive study sites and in open bays and lakes and at a few locations in the nearshore Gulf of Mexico.
Project: Delta-X
The Delta-X mission is a 5-year NASA Earth Venture Suborbital-3 mission to study the Mississippi River Delta in the United States, which is growing and sinking in different areas. River deltas and their wetlands are drowning as a result of sea level rise and reduced sediment inputs. The Delta-X mission will determine which parts will survive and continue to grow, and which parts will be lost. Delta-X begins with airborne and in situ data acquisition and carries through data analysis, model integration, and validation to predict the extent and spatial patterns of future deltaic land loss or gain.
Acknowledgments
This work was supported by the NASA Earth Venture Suborbital-3 (EVS-3) program, grant number NNH17ZDA001N-EVS3 and JPL Research and Technology Development.
Data Characteristics
Spatial Coverage: Atchafalaya and Terrebonne Basins, southern coast of Louisiana, USA
Spatial Resolution: Point measurements made approximately .5 m below water surface
Temporal Coverage: 2021-03-25 to 2021-09-24
Temporal Resolution: Multiple measurements on each sampling day
Site Boundaries: Latitude and longitude are given in decimal degrees.
| Site | Westernmost Longitude | Easternmost Longitude | Northernmost Latitude | Southernmost Latitude |
|---|---|---|---|---|
| Atchafalaya and Terrebonne Basins | -91.46761 | -90.56966 | 29.75453 | 28.79129 |
Data File Information
There are four data files in comma-separated values (.csv) format with this dataset. Two separate but complementary files are provided for the Fall and Spring data field collections:
DeltaX_LISST200X_<season>2021.csv: Two files. <season> is Fall or Spring. These files provide water temperature, beam attenuation coefficient at 670 nm, and average suspended particle size, along with their respective standard deviations. The variables are described in Table 1.
DeltaX_LISST200X_PSD_<season>2021.csv: Two files. <season> is Fall or Spring. These files provide the corresponding particle size distributions, along with their respective standard deviations. The variables are described in Table 2.
Missing data are indicated by the value -9999.
Table 1. Variables in the data files DeltaX_LISST200X_XXX2021.csv (Fall and Spring data files).
| Variable | Units/format | Description |
|---|---|---|
| basin | N/A | “Atchafalaya” or “Terrebonne” |
| site_id | N/A | Name of site |
| campaign | N/A | e.g. Fall_2021, Spring_2021 |
| latitude | degrees north | Latitude of sampling location |
| longitude | degrees east | Longitude of sampling location |
| date | YYYY-MM-DD | Date of sampling and measurement |
| time | HH:MM:SS | UTC time of sampling |
| depth | m | Depth of sampling |
| temperature | degrees C | Average temperature |
| SD_temperature | degrees C | Standard deviation of temperature |
| c_670 | m-1 | Mean beam attenuation coefficient at 670 nm |
| SD_c_670 | m-1 | Standard deviation of beam attenuation coefficient at 670 nm |
| D_avg | µm | Average suspended particle size |
| SD_D_avg | µm | Standard deviation of suspended particle size |
Table 2. Variables in the data files DeltaX_LISST200X_PSD_XXX2021.csv (Fall and Spring data files).
| Variable | Units/format | Description |
|---|---|---|
| basin | N/A | “Atchafalaya” or “Terrebonne” |
| site_id | N/A | Name of site |
| campaign | N/A | Fall 2021, Spring 2021 |
| latitude | degrees north | Location of transect start. ‘NAN’ values indicate no valid GPS data available |
| longitude | degrees east | Location of transect start. ‘NAN’ values indicate no valid GPS data available |
| date | YYYY-MM-DD | Date of sampling and measurement |
| time | HH:MM:SS | UTC time of sampling |
| depth | m | Depth of sampling |
| Diam_{size} | µL L-1 | Mean estimated volumetric particle concentration for particles of size {size} (where size is in µm) |
| Diam_{size}_SD | µL L-1 | Standard deviation of estimated volumetric particle concentration for particles of size {size} (where size is in µm) |
Application and Derivation
In situ measurements of beam attenuation coefficient at 670 nm (m-1), average suspended particle size (µm), and particle size distribution (µL L-1) in surface waters were collected at a number of sites across the Atchafalaya and Terrebonne basins. These sites spanned large and small channels at locations chosen to cover a representative range of suspended solids concentration from a variety of hydrodynamic and physical settings typically encountered across the Atchafalaya and Terrebonne basins. This dataset was used to inform and validate Delta-X’s sediment transport models.
These measurements made at discrete locations were paired with other measurements of total suspended sediment concentration made on discrete water samples, measurements of in situ water-quality indicators, and with in situ and airborne water reflectance (all provided as separate datasets). These location- and time-specific measurements are compared to numerical models to calibrate and validate their parameters. The models quantify the mesoscale (i.e., on the order of 1 ha) patterns of soil accretion that control land loss and gain and predict the resilience of deltaic floodplains under projected relative sea-level rise. Understanding and mitigating the impact of the relative sea-level rise on coastal deltas is urgent. If ignored, relative sea-level rise will very soon have devastating consequences on the livelihood of the half-billion people that live in these low-lying coastal regions.
Quality Assessment
Each day, before and after deployment, clean-water background measurements were acquired with the instrument using Milli-Q water to check for optimal performance of the instrument. The instrument was pressure-tared on the boat deck before deployment. The instrument was lowered from the side of the boat and deployed so that it is perpendicular to the current and the water is flowing as unobstructed as possible through the optics end of the instrument. The data were collected at the surface for about two minutes at a rate of 1 Hz, then averaged and a standard deviation of the measurements was calculated.
Data Acquisition, Materials, and Methods
Study Sites
The Delta-X field studies collected measurements in the Spring and Fall 2021 from the LISST-200X at different locations across the Atchafalaya and Terrebonne Basins (Figure 2). Each sampling site was named using a combination of abbreviations provided in Table 3 as follows: BBB_MMDD_TN where BBB is the abbreviation for the basin (WLD or TB), MMDD is the month and day of 2021 (e.g., 0820 for August 20, 2021), T is the abbreviation for the station type (F for Full station, D for Dry station, and B for Basic station), and N is the sequential number of the station of each type sampled that day (B1 for first basic station, S1 for first full station, S2 for second full station, etc...).
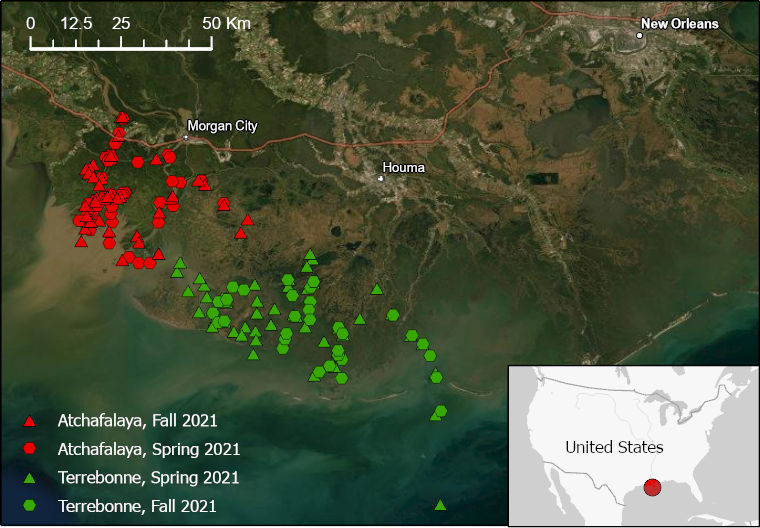
Figure 2. LISST-200X measurement sites for the Spring and Fall 2021 Delta-X field studies.
Table 3. LISST-200X site names.
| Abbreviated Site name | Full Site Name |
|---|---|
| WLD | Atchafalaya Basin (including Wax Lake Delta) |
| TB | Terrebonne Basin |
| S | Full station (Water samples for TSS was collected along with water reflectance, measurements from the LISST, and water-quality indicators from ProDSS probe) |
| D | Dry stations (No Water samples for TSS was collected, but measurements of water reflectance, from the LISST, and water-quality indicators from ProDSS probe were collected) |
| B | Basic station (only measurements of LISST, and water-quality indicators from ProDSS probe were collected) |
LISST-200X Operation
Each in situ measurement was collected directly by lowering the LISST-200X from the side of the boat and keeping it submerged at about 0.5 m beneath the surface (Figure 1). Measurements were collected at a rate of 1 Hz for a duration of about two minutes before retrieving the instrument. Data from the LISST-200X were retrieved and exported as individual casts using the commercial Sequoia Scientific® LISST-SOP200X software. Each cast was then processed in MATLAB® to generate the products of interest including in situ beam attenuation coefficient at 670 nm, suspended particle size distribution, average particle size, and water temperature. In the processing, the measurements collected at the surface for about two minutes were averaged and the standard deviation was calculated.
Data Access
These data are available through the Oak Ridge National Laboratory (ORNL) Distributed Active Archive Center (DAAC).
Delta-X: In situ Beam Attenuation and Particle Size from LISST-200X, 2021
Contact for Data Center Access Information:
- E-mail: uso@daac.ornl.gov
- Telephone: +1 (865) 241-3952
References
None provided.
Dataset Revisions
| Version | Release Date | Revision Notes |
|---|---|---|
| 2.0 |
2022-10-06 |
Fall 2021 data added. Spring 2021 data reprocessed and updated. |
| 1.0 | 2022-XX-XX | Original release with Spring 2021 data |