Documentation Revision Date: 2024-06-14
Dataset Version: 1
Summary
This dataset contains one file in NetCDF (*.nc) format.
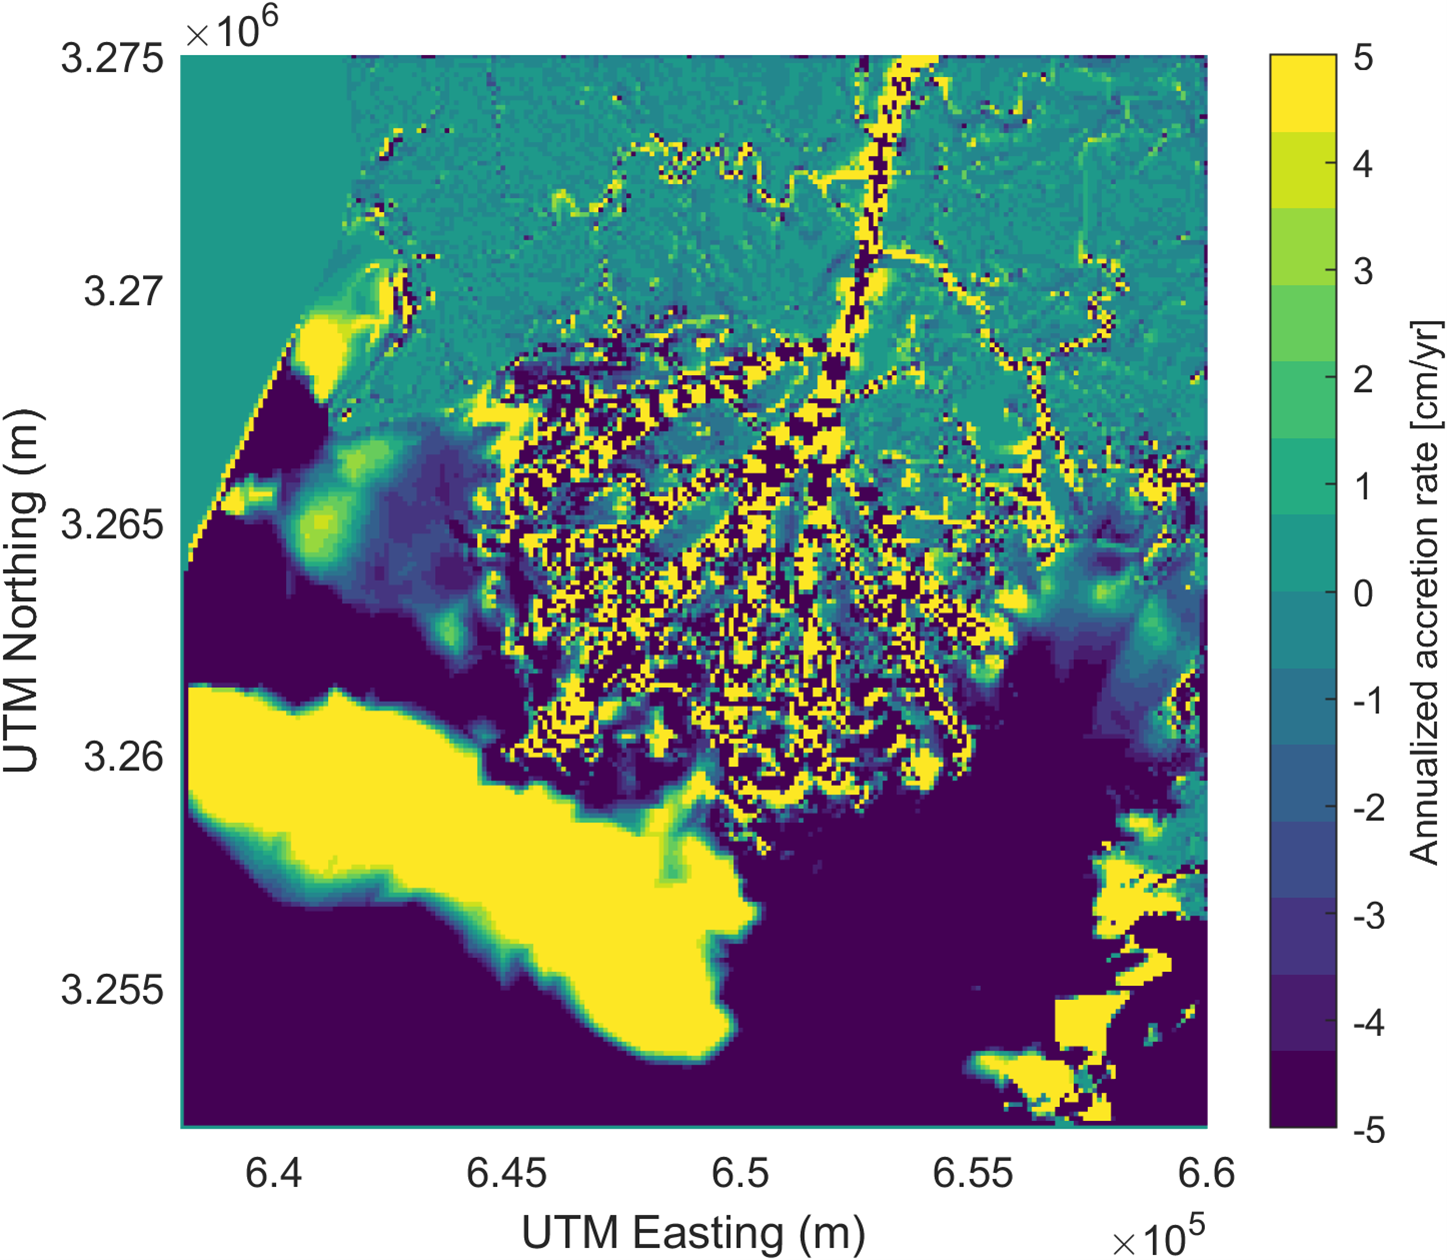
Figure 1. Annualized land accretion rate (cm yr-1) over Wax Lake Delta using the weighted averaging approach.
Citation
Wang, D., G. Salter, and M.P. Lamb. 2024. Delta-X: Modeled Land Accretion Rate Maps, Wax Lake Delta, MRD, LA, USA, 2021. ORNL DAAC, Oak Ridge, Tennessee, USA. https://doi.org/10.3334/ORNLDAAC/2308
Table of Contents
- Dataset Overview
- Data Characteristics
- Application and Derivation
- Quality Assessment
- Data Acquisition, Materials, and Methods
- Data Access
- References
Dataset Overview
This dataset provides Matlab sediment transport and land accretion model results at Wax Lake Delta (WLD), Atchafalaya Basin, in coastal Louisiana, USA. Data were simulated over the Delta-X Spring 2021 (2021-03-21 to 2021-04-03) and Fall 2021 (2021-08-14 to 2021-08-27) campaigns and the results are presented as annualized land accretion rate map. The model results for these two short-term campaigns were used to calculate the 1-year upscale land accretion rate at WLD in post-processing, which is also provided in this dataset. Model results for these two short-term campaigns were derived using inputs from an ANUGA hydrodynamic model (Wright and Passalacqua, 2024). The Matlab sediment transport and land accretion model used to derive these data are available in Wang et al. (2024), which employs sediment transport theory that models floc behavior using a non-cohesive sediment transport framework (De Leeuw, et al., 2020; Lamb et al., 2020; Nghiem et al., 2022.).
Project: Delta-X
The Delta-X mission is a 5-year NASA Earth Venture Suborbital-3 mission to study the Mississippi River Delta in the United States, which is growing and sinking in different areas. River deltas and their wetlands are drowning as a result of sea level rise and reduced sediment inputs. The Delta-X mission will determine which parts will survive and continue to grow, and which parts will be lost. Delta-X begins with airborne and in situ data acquisition and carries through data analysis, model integration, and validation to predict the extent and spatial patterns of future deltaic land loss or gain.
Related Datasets
Twilley, R., A. Fontenot-Cassaway, and A. Rovai. 2022. Delta-X: Feldspar Sediment Accretion Measurements, MRD, LA, USA, 2019-2023, Version 3. ORNL DAAC, Oak Ridge, Tennessee, USA. https://doi.org/10.3334/ORNLDAAC/2290
- These data were used for comparison to the modeled data
Wang, D., G. Salter, and M.P. Lamb. 2023. Delta-X: Matlab Model for Wax Lake Delta Land Accretion. ORNL DAAC, Oak Ridge, Tennessee, USA. https://doi.org/10.3334/ORNLDAAC/2309
- Contains the pre-processing and post-processing tools used to calculate the 1-yr upscale land accretion rate at WLD in this dataset
Wright, K.A., and P. Passalacqua. 2024. Delta-X: Calibrated ANUGA Hydrodynamic Outputs for the Atchafalaya Basin. ORNL DAAC, Oak Ridge, Tennessee, USA. https://doi.org/10.3334/ORNLDAAC/2306
- This dataset provides the ANUGA hydrodynamics modeling results (which provide modeled flow information) used by the Matlab model as model inputs
Acknowledgments
This work was supported by NASA Earth Venture Suborbital-3 (EVS-3) program (grant NNH17ZDA001N-EVS3).
Data Characteristics
Spatial Coverage: Wax Lake Delta (WLD), Atchafalaya Basin, Louisiana, USA
Spatial Resolution: 100 m
Temporal Coverage: Delta-X Spring 2021 (2021-03-21 to 2021-04-03 and Fall 2021 (2021-08-14 to 2021-08-27) campaigns.
Temporal Resolution: One-time estimates
Site Boundaries: Latitude and longitude are given in decimal degrees.
| Site | Westernmost Longitude | Easternmost Longitude | Northernmost Latitude | Southernmost Latitude |
|---|---|---|---|---|
| Wax Lake Delta, LA, USA | -91.58 | -91.35 | 29.59 | 29.39 |
Data File Information
This dataset contains one file in NetCDF (*.nc) format containing estimates of modeled land accretion rates for Wax Lake Delta over the Delta-X Spring 2021 and Fall 2021 campaigns, as well as a one-year upscaled rate based off the results from those campaigns. Coordinates are in UTM Zone 15 N (EPSG: 26915).
Table 1: List of parameters in Delta-X_Land_Accretion_Rate_2021.nc
| Variable | Units | Description |
|---|---|---|
| x | m | X coordinates, in UTM Zone 15N (EPSG: 26915) |
| y | m | Y coordinates, in UTM Zone 15N (EPSG: 26915) |
| WLD_AccRate_SP21 | cm yr-1 | Wax Lake Delta Spring 2021 Accretion Rate (2-weeks) |
| WLD_AccRate_FA21 | cm yr-1 | Wax Lake Delta Fall 2021 Accretion Rate (2 weeks) |
| WLD_AccRate_Upscale | cm yr-1 | Wax Lake Delta upscaled (annual) accretion rate (using Spring 2021 and Fall 2021 results), with weight for Fall 2021 = 0.73 and weight for Spring 2021 = 0.27 |
Application and Derivation
Modeled land accretion rates are helpful for understanding sediment fluxes and deposition in the Mississippi River Delta.
Quality Assessment
The model results were compared with preliminary feldspar results measured at Mike Island East and West study sites (Twilley et al, 2022). The comparison shows the modeled accretion rate has the correct orders of magnitudes.
Data Acquisition, Materials, and Methods
Inputs
This dataset contains estimates of modeled land accretion rates for the Wax Lake Delta over the Delta-X Spring 2021 and Fall 2021 campaigns, as well as a one-year upscaled rate based on the results from those campaigns. Model results for these two short-term campaigns were derived using inputs from an ANUGA hydrodynamic model (Wright and Passalacqua, 2024). The Matlab sediment transport and land accretion model used to derive these data is available in Wang et al. (2024), which employs sediment transport theory that models floc behavior using a non-cohesive sediment transport framework (De Leeuw et al., 2020; Lamb et al., 2020; Nghiem et al., 2022).
Upscaled- One Year Accretion Estimate: The synthetic time series method
The Fall 2021 and Spring 2021 accretion results were used as representative events for low-flow and high-flow conditions, respectively, in a one-year hydrograph. A weighted sum of these two accretion rates was then used to represent the expected average land accretion rate over one year as follows:
 ,
,
where AccFA21 and AccSP21 are land accretion rate in the simulated Fall 2021 and Spring 2021 campaigns. The Accupscale is the one-yr weighted average land accretion rate. RFA21 and RSP21 are constants used as weights in the averaging process.
The weights in the annualized accretion formula can be calculated using the mass conservation rules for flow discharge and sediment discharge. The goal was to represent the total water flux and sediment flux into the Wax Lake Delta by using distinct flow events, as well as to capture the seasonal variance in the time series. It was required that the sum of the events would conserve the mass of water and sediment in comparison to the true time series. The system of equations can then be written as:
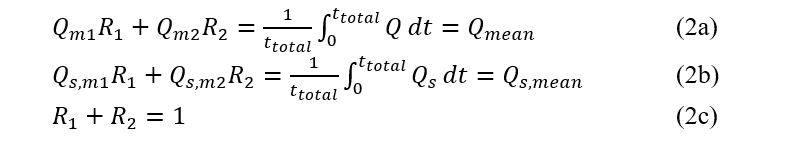
where the Qm1 and Qm2 are mean flow discharge of different events and the Qs,m1 and Qs,m2 are mean sediment discharge of different events. The right-hand sides of the first two equations are the measured mean flow and sediment discharges. The weights R1 and R2 are the weights needed so that these events conserve mass relative to the true time series. ttotal is the length of the discharge time series.
Notice that in this system of equations, there are two unknowns and three equations, which form an over-constrained system, thus an optimization algorithm is needed to obtain the optimal ratio for each event. As a reference case, the sub-system of equations (2a & b) and (2a & c) are directly solved, which denote the best ratio R1 and R2 that satisfies the conservation laws for either mean flow discharge Qm or mean sediment discharge Qs,m. The solution for the reference cases denote for flow discharge conservation: RSP21,Qm=0.2, RFA21,Qm=0.8, and for sediment discharge conservation: RSP21,Qs,m=0.27, RFA21,Qs,m=0.73. One can see that it is not possible to satisfy both conservation laws using one set of weights.
To find the optimal weights that can represent the full time series measured by the USGS, the SP21 and FA21 event time series were used along with the weights to create a synthetic time series over the same period. The synthetic time series was adjusted by a phase shift determined by the cross-correlation between the measured and synthetic time series. The L2-norm of the difference between the synthetic and measured time series was calculated for both flow discharge and sediment discharge. Additionally, a Dynamic Time Warping algorithm (Salvador and Chan, 2007) was used to evaluate the similarities between the synthetic time series generated using these weights and the measured time series for both flow discharge and sediment discharge. Through these processes, the optimal ratios were found to be RSP21,optimal=0.27 and RFA21,optimal=0.73.
The synthetic time series is created by alternately blending the SP21 and FA21 event time series to represent seasonality. The aforementioned two weights, RSP21 and RFA21, are used in this process to determine the lengths of these events in the synthetic time series. After the phase adjustment, the L2-norm equations (3a & b) were used to determine the similarities between the blended time series and the measured data at the USGS streamgage for both flow discharge and sediment discharge.
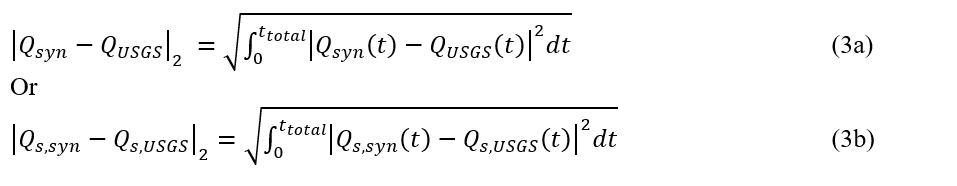
where Qsyn and QUSGS are time series of flow discharge; Qs,syn and Qs,USGS are sediment discharge time series. For the Wax Lake Delta, the discharge time series from 1987 to 2016 measured by the USGS at Calumet (Station 07381590) was used. All the measured time series have been resampled using uniform time intervals. In addition, the sediment discharge was constructed using the rating curves in the model documentation (Wang et al., 2024). An example of the synthetic time series and the measured time series is shown in Figure 2. Through this process, it was found that the optimal weights to minimize both L2-norms are RSP21,Q=RSP21,Qs=0.27 and RFA21,Q=RFA21,Qs=0.73, as shown in Figure 3.
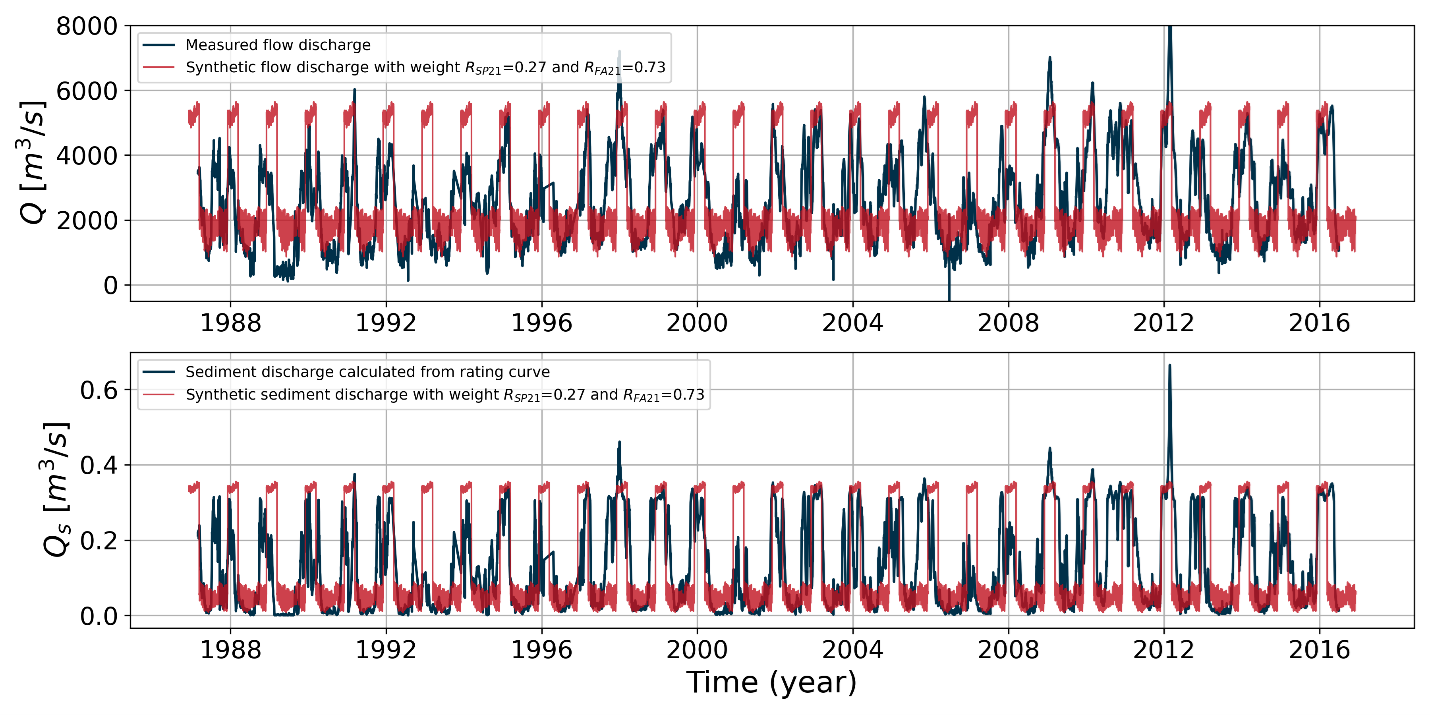
Figure 2. Measured time series data at USGS stream gage at Calumet (07381590) (black line) and the synthetic time series constructed using weights RFA21 and RSP21 (red line). In these plots, Q is flow discharge and Qs is total sediment discharge with Qs=Qsand+Qmud.
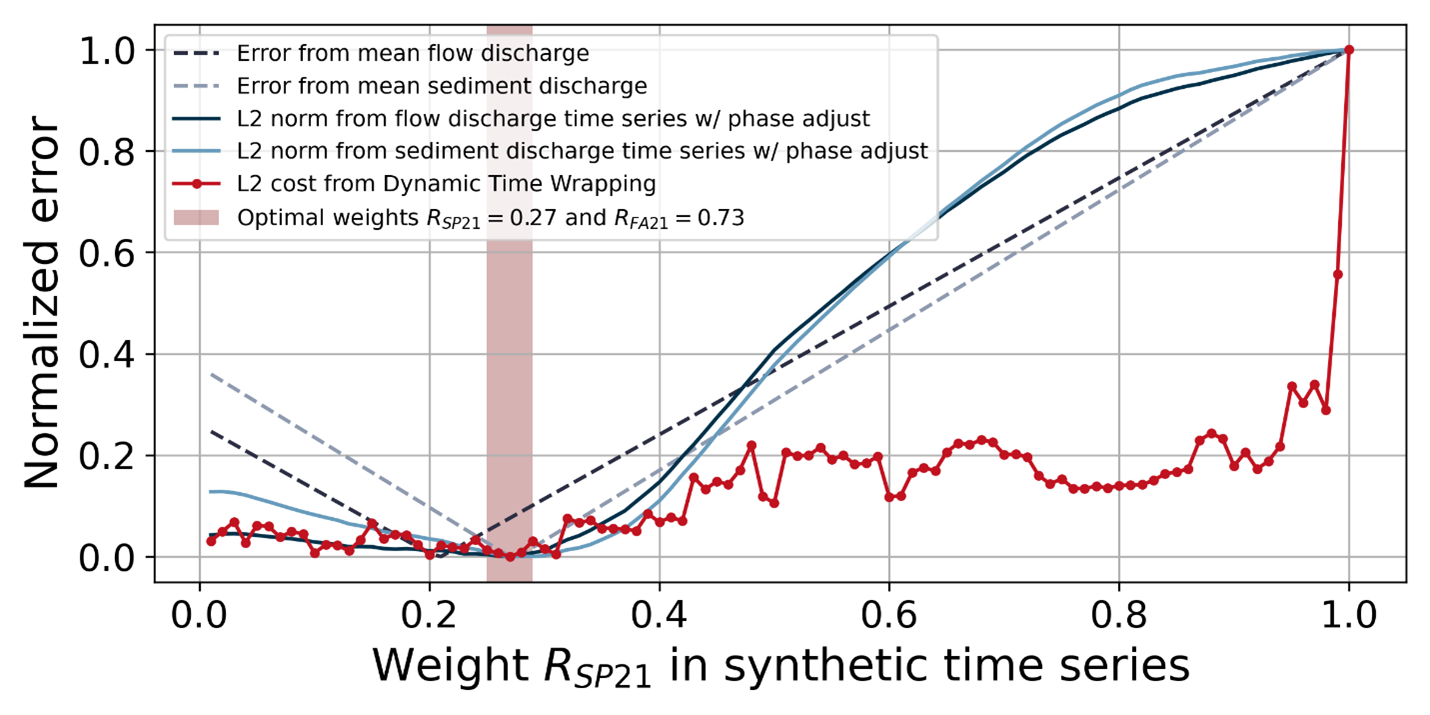
Figure 3. The errors between synthetic time series and measured data calculated using different methods. The optimal weights RFA21 and RSP21 are determined using the L2 cost calculated from the cost matrix of Dynamic Time Warping method.
The Dynamic Time Warping method (Salvador and Chan, 2007) generates a cost matrix that can be used to calculate the cost between two time series or multiple time series. The cost can be used as an additional measure to quantify the similarities. In this study, the fast-DTW algorithm is used. In the distance function that is used to construct the cost matrix, the L2 distance is used. For the Wax Lake Delta, the time series for flow discharge and sediment discharge are evaluated simultaneously in this process. The error is normalized using the maximum and minimum values and is presented in Figure 3. It was found that to minimize the L2 cost, the optimal ratios are RSP21,DTW=0.27 and RFA21,DTW=0.73, as well.
In conclusion, using the Spring 2021 and Fall 2021 campaign time series, the optimal weights were obtained: RSP21=0.27, RFA21=0.73. Applying these weights, the annualized rate was calculated using equation (1), as shown in Figure 1.
Data Access
These data are available through the Oak Ridge National Laboratory (ORNL) Distributed Active Archive Center (DAAC).
Delta-X: Modeled Land Accretion Rate Maps, Wax Lake Delta, MRD, LA, USA, 2021
Contact for Data Center Access Information:
- E-mail: uso@daac.ornl.gov
- Telephone: +1 (865) 241-3952
References
De Leeuw, J., M.P. Lamb, G. Parker, A.J. Moodie, D. Haught, J.G. Venditti, J.A. and Nittrouer. 2020. Entrainment and suspension of sand and gravel. Earth Surface Dynamics 8:48-5. https://doi.org/10.5194/esurf-8-485-2020.
Lamb, M.P., J. de Leeuw, W.W. Fischer, A.J. Moodie, J.G. Venditti, A.J. Nittrouer, D. Haught, and G. Parker. 2020. Mud in rivers transported as flocculated and suspended bed material. Nature Geoscience 13:566-570. https://doi.org/10.1038/s41561-020-0602-5.
Nghiem, J.A., W.W. Fischer, G.K. Li., and M.P. Lamb. 2022. A mechanistic model for mud flocculation in freshwater rivers. Journal of Geophysical Research: Earth Surface 127:e2021JF006392. https://doi.org/10.1029/2021JF00639
Salvador, S., and P. Chan. 2007. Toward accurate dynamic time warping in linear time and space. Intelligent Data Analysis 11:561-580. https://doi.org/10.3233/IDA-2007-11508
Twilley, R., A. Fontenot-Cassaway, and A. Rovai. 2022. Delta-X: Feldspar Sediment Accretion Measurements, MRD, LA, USA, 2019-2023, Version 3. ORNL DAAC, Oak Ridge, Tennessee, USA. https://doi.org/10.3334/ORNLDAAC/2290
Wright, K.A., and P. Passalacqua. 2024. Delta-X: Calibrated ANUGA Hydrodynamic Outputs for the Atchafalaya Basin. ORNL DAAC, Oak Ridge, Tennessee, USA. https://doi.org/10.3334/ORNLDAAC/2306
Wang, D., G. Salter, and M.P. Lamb. 2024. Delta-X: Matlab Model for Wax Lake Delta Land Accretion. ORNL DAAC, Oak Ridge, Tennessee, USA. https://doi.org/10.3334/ORNLDAAC/2309