Documentation Revision Date: 2024-07-23
Dataset Version: 1.1
Summary
Time series stacks were generated using a set of nearest-neighbor (NN), NN+1, and NN+2 co-registered VV-polarization interferograms from the quad-polarization SLC stack product using a combination of the InSAR Scientific Computing Environment (ISCE; Rosen et al., 2012), the statistical-cost, network-flow algorithm for phase unwrapping (SNAPHU; Chen et al., 2001), and previously developed python code. Unwrapped phase products were corrected using the phase unwrapping correction algorithm described in Oliver-Cabrera et al. (2021), and time series estimation was performed using the Miami InSAR time series software in python (MintPy; Yunjun et al., 2019).
Delta-X was a joint airborne and field campaign in the Mississippi River Delta that took place during Spring and Fall 2021. The Delta-X campaign conducted airborne (remote sensing) and field (in situ) measurements to observe hydrology, water quality (e.g., total suspended solids (TSS)), and vegetation structure. This data serves for the continued development of algorithms and models. The Delta-X algorithms are used to convert remote sensing observables to geophysical parameters, and to develop numerical, hydrodynamic and ecological models.
This dataset includes 513 files in ENVI binary image and associated header file format.

Figure 1. UAVSAR InSAR derived water level change product example. Last image to the right shows a map of temporal coherence which can be used to highlight regions with prevalent unwrapping errors. Products were generated using acquisitions from flight-line wterre_34202 on 2021-04-06 at 20:32 and 21:02 (UTC) times.
Citation
Jones, C., T. Oliver-Cabrera, M. Simard, and Y. Lou. 2022. Delta-X: UAVSAR L3 Water Level Changes, MRD, Louisiana, 2021. ORNL DAAC, Oak Ridge, Tennessee, USA. https://doi.org/10.3334/ORNLDAAC/2058
Table of Contents
- Dataset Overview
- Data Characteristics
- Application and Derivation
- Quality Assessment
- Data Acquisition, Materials, and Methods
- Data Access
- References
- Dataset Revisions
Dataset Overview
This dataset contains georeferenced InSAR-derived water level change maps for Delta-X flight lines acquired during the spring (2021-03-27 to 2021-04-18) and fall (2021-09-03 to 2021-09-13) deployments. Water-level change observations are provided throughout wetlands of the Atchafalaya and Terrebonne Basins, in Southern Louisiana, USA, within the Mississippi River Delta (MRD). The data were collected by Uninhabited Aerial Vehicle Synthetic Aperture Radar (UAVSAR), a polarimetric L-band synthetic aperture radar flown on the NASA Gulfstream-III (C20) aircraft as part of the Delta-X campaign. Water surface elevations were measured on multiple flights at 30-minute intervals. There are three types of gridded products available: temporalcoherence (which provide an index of the quality of phase unwrapping), waterlevelchange (which provide cumulative changes in water levels at approximately 30-minute intervals), and waterlevelchanage_ramp (which provide a 2-dimensional linear trend in water-level estimates not related to changing water levels). The water-level change maps were estimated using the phase unwrapping corrected interferograms generated for nearest-neighbor (NN), NN+1, and NN+2 pairs for data acquired within a single flight (one day). This analysis was done for all flight lines. Water level changes are relative to the first sampling flight for that study area. Data quality was assessed by comparing water elevation estimates with data from in situ water level gauges throughout the study area. A series of quality assurance masks of troposphere-induced phase delay regions were generated for all SAR acquisition dates using a weather feature matching algorithm.
Time series stacks were generated using a set of nearest-neighbor (NN), NN+1, and NN+2 co-registered VV-polarization interferograms from the quad-polarization SLC stack product using a combination of the InSAR Scientific Computing Environment (ISCE; Rosen et al., 2012), the statistical-cost, network-flow algorithm for phase unwrapping (SNAPHU; Chen et al., 2001), and previously developed python code. Unwrapped phase products were corrected using the phase unwrapping correction algorithm described in Oliver-Cabrera et al. (2021), and time series estimation was performed using the Miami InSAR time series software in python (MintPy; Yunjun et al., 2019).
Delta-X was a joint airborne and field campaign in the Mississippi River Delta that took place during Spring and Fall 2021. The Delta-X campaign conducted airborne (remote sensing) and field (in situ) measurements to observe hydrology, water quality (e.g., total suspended solids (TSS)), and vegetation structure. This data serves for the continued development of algorithms and models. The Delta-X algorithms are used to convert remote sensing observables to geophysical parameters, and to develop numerical, hydrodynamic and ecological models.
Project: Delta-X
The Delta-X mission is a 5-year NASA's Earth Venture Suborbital-3 mission to study the Mississippi River Delta in the United States, which is growing and sinking in different areas. River deltas and their wetlands are drowning as a result of sea level rise and reduced sediment inputs. The Delta-X mission will determine which parts will survive and continue to grow, and which parts will be lost. Delta-X begins with airborne and in situ data acquisition and carries through data analysis, model integration, and validation to predict the extent and spatial patterns of future deltaic land loss or gain.
Related Publications
Oliver-Cabrera, T., C.E. Jones, Z. Yunjun, and M. Simard. 2021. InSAR phase unwrapping error correction for rapid repeat measurements of water level change in wetlands. IEEE Transactions on Geoscience and Remote Sensing 60:1-15. https://doi.org/10.1109/TGRS.2021.3108751
Oliver-Cabrera, T., C. Jones, M. Simard, B. Varugu, and S. Belhadj-Aissa. 2024a. Identification of wet troposphere delay in L-band InSAR measurements. Journal of Geodesy, submitted.
Related Datasets
Jones, C., M. Simard, Y. Lou, and T. Oliver. 2021a. Delta-X: UAVSAR L1 Products, Single Look Complex (SLC) Stack, MRD, Louisiana, 2021. ORNL DAAC, Oak Ridge, Tennessee, USA. https://doi.org/10.3334/ORNLDAAC/1984
- The L1 UAVSAR products used to generate the L1B, L2, and L3 products.
Jones, C., T. Oliver-Cabrera, M. Simard, and Y. Lou. 2021b. Delta-X: UAVSAR L1B Interferometric Products, MRD, Louisiana, 2021. ORNL DAAC, Oak Ridge, Tennessee, USA. https://doi.org/10.3334/ORNLDAAC/1979
- L1B products used to generate the L2 and L3 products.
Jones, C., T. Oliver-Cabrera, M. Simard, and Y. Lou. 2022. Delta-X: UAVSAR L2 Interferometric Products, MRD, Louisiana, 2021. ORNL DAAC, Oak Ridge, Tennessee, USA. https://doi.org/10.3334/ORNLDAAC/2057
- L2 products used to generate these L3 water-level change products.
Acknowledgments
This work was supported by NASA Earth Venture Suborbital-3 (EVS-3) program (grant NNH17ZDA001N-EVS3).
Data Characteristics
Spatial Coverage: Atchafalaya and Terrebonne Basins, southern coast of Louisiana, USA
Spatial Resolution: 0.000056 degrees (approximately 5 m)
Temporal Coverage: 2021-03-27 to 2021-09-13
Temporal Resolution: Repeated samples at 30-minute intervals
Site Boundaries: Latitude and longitude are given in decimal degrees.
| Site | Westernmost Longitude | Easternmost Longitude | Northernmost Latitude | Southernmost Latitude |
|---|---|---|---|---|
| Atchafalaya and Terrebonne Basins | -91.5894 | -90.1333 | 29.7800 | 29.0136 |
Data File Information
This dataset includes 513 files in ENVI format. Each ENVI consist of a binary data file (*.dat) plus a metadata header file (*.hdr); the data file and its associated header are provided in a zip archive (*.zip).
The L3 water level change product files are named ssssss_aaaaa_YYLLDDHHMM_yyllddhhmm_vv_product.grd.dat.zip (e.g., atchaf_06309_2103271342_2103271342_01_waterlevelchange.grd.dat.zip), where
- ssssss = "atchaf", "eterre" or "wterre"; 6-character alphanumeric site name assigned to the UAVSAR flight line .
- aaaaa = 5-character flight line ID assigned to the UAVSAR flight line (Table 2, Figure 3). The first 3 characters are the aircraft heading in degrees from North, and the last 2 characters are an alphanumeric counter chosen to ensure uniqueness of the ID.
- YYLLDDHHMM = starting time of first acquisition, encoded as YY = the last two digits of the year, LL = month, DD = day of month, HH = hour, and MM = minute, in UTC.
- yyllddhhmm= start time of second acquisition, encoded as yy = the last two digits of the year, ll = month, dd = day of month, hh = hour, and mm = minute, in UTC.
- vv = version number of file.
- product = gridded metric: "temporalcoherence", "waterlevelchange", or "waterlevelchanage_ramp" (Table 1).
The quality assurance mask files are named ssssss_aaaaa_YYLLDDHHMM_vv_product.grd.dat.zip, (e.g., atchaf_06309_2103271342_01_l3_qa_mask.grd.dat.zip), where
- YYLLDDHHMM = starting or ending time of the acquisition in UTC.
- product = gridded metric: "l3_qa_mask"
The L3 water level change products are provided as real Float32 and the QA masks are provided as Integer16 data types.
The ENVI header files contain the names of the products from which the product was derived, the data format, along with the number of samples and lines in the raster and pixel spacing information. The no data value is NaN.
Table 1. File types and descriptions.
| File Type | Units | Number of Files | Description |
|---|---|---|---|
| *_temporalcoherence.grd.dat.zip | 1 | 29 | Index measuring quality of phase unwrapping ranging from 0 (poor) to 1 (correctly unwrapped). |
| *_waterlevelchange.grd.dat.zip | cm | 213 | Cumulative changes in water levels at approximately 30-minute intervals relative to the first sampling flight. |
| atchaf_*_waterlevelchange_ramp.grd.dat.zip | cm | 51 | Phase ramps for Atchafalaya basin. These files provide a 2-dimensional linear trend in water-level estimates that was not related to changing water levels. To remove this trend, subtract the ramp values from the corresponding water-level change values. See Section 5 for more explanation. |
| *_l3_qa_mask.grd.dat.zip | 1 | 220 | Quality assurance mask with three categories: 0 for clear sky, 1 for weather feature presence with possible troposphere-phase delay, 2 for areas where tropospheric phase delay was consistently detected across all interferograms related to a particular acquisition. |
| Total: | 513 | ||
Application and Derivation
The UAVSAR interferometric products serve as maps of surface change throughout the wetland regions. This data is used to produce water level change time series measurements that are used to evaluate and compare hydrodynamic model performance.
Quality Assessment
Data quality was assessed by comparing water elevation estimates with data from in situ water level gauges throughout the study area. Residual errors were assessed through a scene-wide comparison of elevation estimates for sites above the high-water level. Pixels that lack data or which failed quality tests were marked with a “no data” value (NaN).
Data Acquisition, Materials, and Methods
UAVSAR is a polarimetric L-band synthetic aperture radar operating with 80 MHz bandwidth from 1217.5–1297.5 MHz designed for interferometry (InSAR) (Hensley et al., 2009). UAVSAR’s swath width is 22 km, which illuminates an area from 22°–67° incidence angle, with 3 m (cross-track average) by 1 m (along-track) single look ground resolution. The instrument was flown on a Gulfstream-III (C20) aircraft with the radar electronics and antenna housed in a pod mounted below the fuselage (Figure 2). Table 2 summarizes the acquisitions used to generate the interferometric products. The same flight lines (Figure 3) were flown at 30-minute intervals to provide repeated samples of the same areas on the same day.
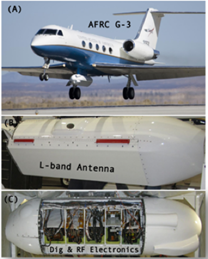
Figure 2. UAVSAR is flown on a Gulfstream-III aircraft, mounted in a pod hung below the fuselage.
During the Delta-X campaign, the UAVSAR instrument was operated in its standard acquisition configuration, operating at an altitude of 12.5 km in quad-polarization mode, transmitting horizontally and vertically polarized radiation on alternate pulses and receiving both co-polarized (HH or VV) and cross-polarized (HV or VH) returns for each pulse.
The Level 1 (L1) UAVSAR single look complex (SLC) VV-polarization co-registered stack products (Jones et al., 2021a) were the underlying data for L1B products (Jones et al., 2021b) and L2 products (Jones et al., 2022), which were then used to generate these L3 water-level change products.
Water-level change
The water-level change maps were estimated using the phase unwrapping corrected interferograms generated for nearest-neighbor (NN), NN+1, and NN+2 pairs for data acquired within a single flight (one day). This analysis was done for all flight lines. A segment concatenation was performed for flight lines that were divided into segments, forming only one image for the complete flight line. The unwrapped interferograms were processed using the SNAPHU phase unwrapping software and corrected for phase unwrapping errors as described in Oliver-Cabrera et al. (2021). Time series estimation was implemented using the MintPy software (https://github.com/insarlab/MintPy). The values are changes in water level relative to the first sampling flight for that study area.
No atmospheric correction was applied to these dataset. Some interferograms were removed to improve water level change time series estimations from these UAVSAR lines:
- atchaf_06309_210905
- wterre_16300_210903
- wterre_16300_210912
- wterre_34202_210912
- eterre_27309_210904
These flight lines were cropped to remove areas with unwrapping errors and/or regions with strong atmospheric noise:
- wterre_34202_210903
- eterre_27309_210904
- eterre_27309_210907
Temporal coherence
The temporal coherence files provide a spatially explicit index of unwrapping quality; values range from 0 (poorly unwrapped) to 1 (correctly unwrapped). This index was generated by constructing interferograms using the time-series estimation results for the epochs to compare against the original interferograms (Pepe and Lanari, 2006). Temporal coherence was defined as
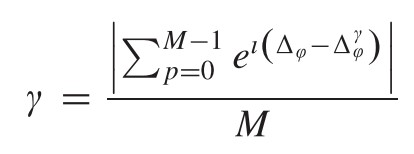 , where
  is interferometric phase reconstructed from the estimated water level change time series and M is the number of interferograms (Oliver-Cabrera et al, 2021).
Phase ramps for the Atchafalaya Basin
Phase values for the Atchafalaya Basin data had changes across the scene that followed a two-dimensional linear pattern that did not respond to actual water level changes. This pattern may be due to atmospheric effects or other acquisition effects. Therefore, a set of phase ramps were estimated by comparing InSAR water-level measurements to in situ water levels recorded by the Coastwide Reference Monitoring System (CRMS) (https://www.lacoast.gov/CRMS/). Estimates of water-level change for the Atchafalaya Basin may be improved by subtracting the ramp values from values in the corresponding water-level change file. Phase ramps were not generated for the Terrebonne Basin (Spring and Fall) or the Atchafalaya Basin Fall Campaign products.
Table 2. Summary of all UAVSAR flight lines, number of acquisitions and interferograms produced from the data collected during the Delta-X spring 2021. Detailed information about these flights is available from https://uavsar.jpl.nasa.gov/ by searching on the flight line name.
| UAVSAR flight line | Date | Number of acquisitions | Interferograms produced |
|---|---|---|---|
| atchaf_06309 | 2021-03-27 | 8 | 18 |
| 2021-04-01 | 7 | 15 | |
| 2021-04-02 | 9 | 21 | |
| 2021-09-05 | 9 | 21 | |
| 2021-09-13 | 2 | 1 | |
| atchaf_19809 | 2021-03-23 | 9 | 21 |
| 2021-04-01 | 9 | 21 | |
| 2021-04-02 | 9 | 21 | |
| 2021-09-05 | 9 | 21 | |
| 2021-09-13 | 4 | 6 | |
| eterre_08705 | 2021-04-12 | 8 | 18 |
| 2021-04-16 | 6 | 12 | |
| 2021-04-18 | 7 | 15 | |
| 2021-09-04 | 8 | 18 | |
| 2021-09-07 | 8 | 18 | |
| eterre_27309 | 2021-04-12 | 7 | 15 |
| 2021-04-16 | 7 | 15 | |
| 2021-04-18 | 7 | 15 | |
| 2021-09-04 | 8 | 18 | |
| 2021-09-07 | 7 | 15 | |
| wterre_16300 | 2021-04-05 | 8 | 18 |
| 2021-04-06 | 7 | 15 | |
| 2021-04-07 | 7 | 15 | |
| 2021-09-03 | 6 | 12 | |
| 2021-09-12 | 7 | 15 | |
| wterre_34202 | 2021-04-05 | 8 | 18 |
| 2021-04-06 | 6 | 12 | |
| 2021-04-07 | 8 | 18 | |
| 2021-09-03 | 7 | 15 | |
| 2021-09-12 | 8 | 18 |
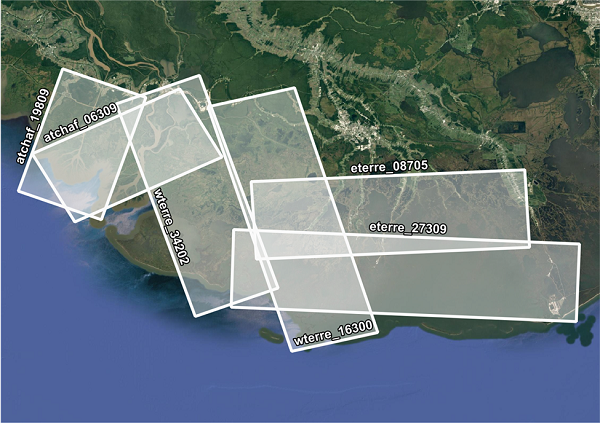
Figure 3. Spatial coverage of each UAVSAR flight line acquired during the 2021 Delta-X campaign. Map shows the Atchafalaya and Terrebonne Basins along the southern coast of Louisiana, USA.
Table 3. Level 1 (L1) co-registered single look complex (SLC) stack products (Jones et al, 2021a) used to generate these L3 products.
| UAVSAR flight line | Baseline L1 SLC Product |
|---|---|
| atchaf_06309 | atchaf_06309_02 |
| atchaf_06309_03 | |
| atchaf_19809 | atchaf_19809_02 |
| atchaf_19809_03 | |
| wterre_16300 | wterre_16300_02 |
| wterre_16300_03 | |
| wterre_34202 | wterre_34202_02 |
| wterre_34202_03 | |
| eterre_08705 | eterre_08705_02 |
| eterre_08705_03 | |
| eterre_27309 | eterre_27309_01 |
| eterre_27309_02 |
Quality assurance masks
The Level 3 QA masks were formed by analyzing the interferometric phases and feature matching them against NOAA NEXRAD weather radar images (Oliver-Cabrera et al., 2024a). These masks have three categories: 0 for clear sky, 1 for weather feature presence with possible troposphere-phase delay and 2 for areas where tropospheric phase delay was consistently detected across all interferograms related to a particular acquisition. An overview of QA masks for the full Delta-X UAVSAR campaign is available at Oliver-Cabrera et al. (2024b).
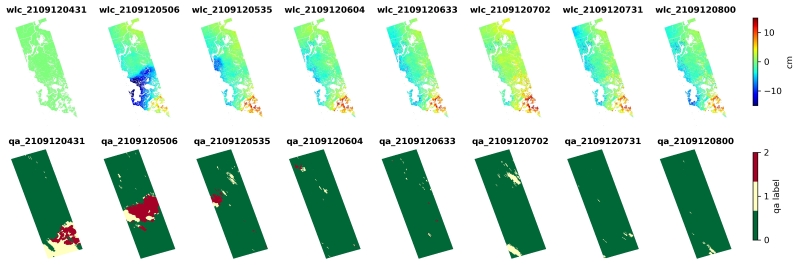
Figure 4. Examples of the UAVSAR InSAR derived water level change product (top row) and corresponding troposphere-induced phase delay QA mask (bottow row). Products were generated using acquisitions from flightline wterre_34202 on 2021-09-12 at 04:31 and 08:00 (UTC) times.
Data Access
These data are available through the Oak Ridge National Laboratory (ORNL) Distributed Active Archive Center (DAAC).
Delta-X: UAVSAR L3 Water Level Changes, MRD, Louisiana, 2021
Contact for Data Center Access Information:
- E-mail: uso@daac.ornl.gov
- Telephone: +1 (865) 241-3952
References
Chen, C.W., and H.A. Zebker. 2001. Network approaches to two-dimensional phase unwrapping: intractability and two new algorithms: erratum. Journal of the Optical Society of America A 18:1192. https://doi.org/10.1364/josaa.18.001192
Hensley, S., H. Zebker, C. Jones, T. Michel, R. Muellerschoen, and B. Chapman. 2009. First deformation results using the NASA/JPL UAVSAR instrument. 2009 2nd Asian-Pacific Conference on Synthetic Aperture Radar. https://doi.org/10.1109/APSAR.2009.5374246
Jones, C., M. Simard, Y. Lou, and T. Oliver. 2021a. Delta-X: UAVSAR L1, Single Look Complex (SLC) Stack Product, MRD, Louisiana, 2021. ORNL DAAC, Oak Ridge, Tennessee, USA. https://doi.org/10.3334/ORNLDAAC/1984
Jones, C., T. Oliver-Cabrera, M. Simard, and Y. Lou. 2021b. Delta-X: UAVSAR L1B, Interferometric Products, MRD, Louisiana, 2021. ORNL DAAC, Oak Ridge, Tennessee, USA. https://doi.org/10.3334/ORNLDAAC/1979
Jones, C., T. Oliver-Cabrera, M. Simard, and Y. Lou. 2022. Delta-X: UAVSAR L2 Interferometric Products, MRD, Louisiana, 2021. ORNL DAAC, Oak Ridge, Tennessee, USA. https://doi.org/10.3334/ORNLDAAC/2057
Oliver-Cabrera, T., C.E. Jones, Z. Yunjun, and M. Simard. 2021. InSAR phase unwrapping error correction for rapid repeat measurements of water level change in wetlands. IEEE Transactions on Geoscience and Remote Sensing 60:1-15. https://doi.org/10.1109/TGRS.2021.3108751
Oliver-Cabrera, T., C. Jones, M. Simard, B. Varugu, and S. Belhadj-Aissa. 2024a. Identification of wet troposphere delay in L-band InSAR measurements. Journal of Geodesy, submitted.
Oliver-Cabrera, T., C. Jones, M. Simard, B. Varugu, and S. Belhadj-Aissa. 2024b. Identification of wet troposphere delay in L-band InSAR measurements: Delta-X UAVSAR InSAR measurement QA masks. Zenodo. https://doi.org/10.5281/zenodo.11036968
Pepe, A. and R. Lanari. 2006. On the extension of the minimum cost flow algorithm for phase unwrapping of multitemporal differential SAR interferograms. IEEE Transactions on Geoscience and Remote Sensing 44:2374-2383. https://doi.org/10.1109/TGRS.2006.873207
Rosen, P.A., E. Gurrola, G.F. Sacco, and H. Zebker. 2012. The InSAR scientific computing environment. EUSAR 2012; 9th European conference on synthetic aperture radar 2012:730-733. https://ieeexplore.ieee.org/document/6217174
Yunjun, Z., H. Fattahi, and F. Amelung. 2019. Small baseline InSAR time series analysis: Unwrapping error correction and noise reduction. Computers & Geosciences 133:104331. https://doi.org/10.1016/j.cageo.2019.104331
Dataset Revisions
| Release Date | Version | Revision Notes |
|---|---|---|
| 2024-07-19 | 1.1 | Quality assurrance masks (n=220) were added to dataset. Other files were not changed. |
| 2022-08-29 | 1.1 | Fall 2021 data were added to the dataset. Dataset title and user guide were updated. |
| 1.0 | Initial release with Spring 2021 data only. (Preprint) |