Documentation Revision Date: 2025-06-13
Dataset Version: 1
Summary
This dataset includes 21 files. There are 10 ENVI binary files; each binary has an associated header file. There is one file in comma-separated values (CSV) format that provides site metadata and data derived from a GoPro camera.
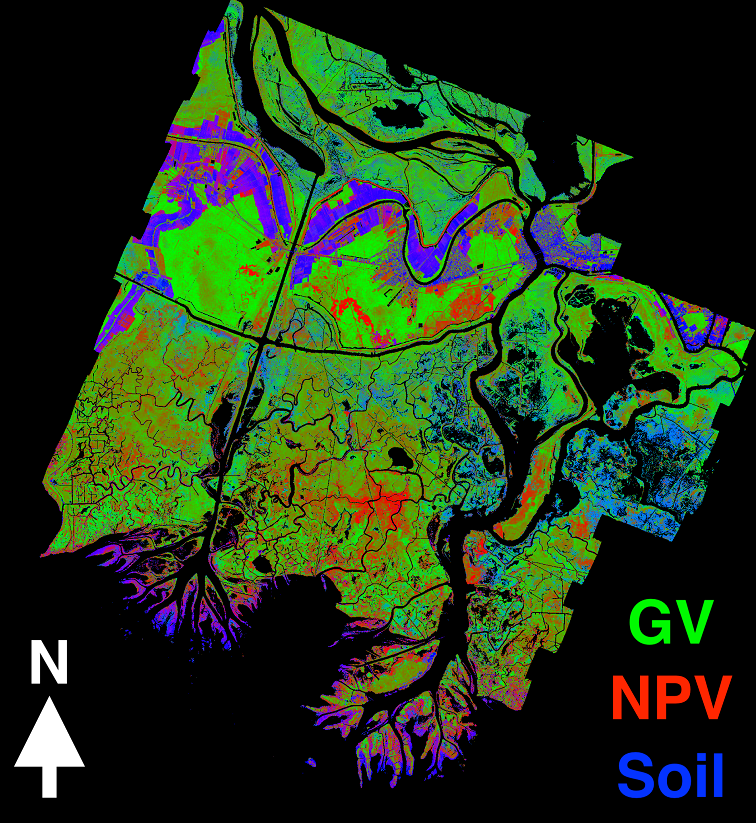
Figure 1. False color composite of shade-normalized fractional cover using AVIRIS-NG L2B BRDF-corrected surface reflectance mosaic for the Atchafalaya basin in Spring 2021. Green vegetation (GV; scaled 0-1) is shown in green, non-photosynthetic vegetation (NPV; scaled 0-1) is shown in red, and soil (scaled 0-0.5) is shown in blue.
Citation
Jensen, D.J., E. Solohin, E. Castañeda-Moya, D.R. Thompson, and M. Simard. 2025. Delta-X: AVIRIS-NG L2B Derived Fractional Cover, MRD, LA, USA, 2021. ORNL DAAC, Oak Ridge, Tennessee, USA. https://doi.org/10.3334/ORNLDAAC/2407
Table of Contents
- Dataset Overview
- Data Characteristics
- Application and Derivation
- Quality Assessment
- Data Acquisition, Materials, and Methods
- Data Access
- References
Dataset Overview
This dataset provides estimates of fractional vegetation cover across the Atchafalaya and Terrebonne basins. Atmospheric correction was applied to a L2B BRDF-adjusted surface reflectance product (Thompson et al., 2025) from AVIRIS-NG imagery to produce L2 Hemispherical-Directional surface reflectance (Thompson et al., 2018; Thompson et al., 2019). A spectral library was compiled using in situ spectra in the USGS Spectral Library (v7; Kokaly et al., 2017) to represent green vegetation, non-photosynthetic vegetation, and soil. Linear spectral unmixing was then applied to mosaics of AVIRIS-NG reflectance using these spectra to estimate the fractional composition (scaled 0-1) of each endmember type for all terrestrial pixels. In addition to the AVIRIS-NG imagery and in situ field spectra, this analysis incorporated field images collected using a GoPro digital camera coincident with the AVIRIS-NG flight lines.
Project: Delta-X
The Delta-X mission is a 5-year NASA Earth Venture Suborbital-3 mission to study the Mississippi River Delta in the United States, which is growing and sinking in different areas. River deltas and their wetlands are drowning as a result of sea level rise and reduced sediment inputs. The Delta-X mission will determine which parts will survive and continue to grow, and which parts will be lost. Delta-X begins with airborne and in situ data acquisition and carries through data analysis, model integration, and validation to predict the extent and spatial patterns of future deltaic land loss or gain.
Related Datasets:
Castañeda-Moya, E., and E. Solohin. 2023. Delta-X: Aboveground Biomass and Necromass across Wetlands, MRD, Louisiana, 2021, V2. ORNL DAAC, Oak Ridge, Tennessee, USA. https://doi.org/10.3334/ORNLDAAC/2237
Thompson, D.R., D.J. Jensen, J.W. Chapman, M. Simard, and E. Greenberg. 2025. Delta-X: AVIRIS-NG BRDF-Adjusted Surface Reflectance and Mosaics, MRD, LA, 2021, V3. ORNL DAAC, Oak Ridge, Tennessee, USA. https://doi.org/10.3334/ORNLDAAC/2355
Acknowledgement
This study was supported by the National Aeronautics and Space Administration Science Mission Directorate’s Earth Science Division, Earth Venture Suborbital-3 Program. grant number NNH17ZDA001N-EVS3.
Data Characteristics
Spatial Coverage: Atchafalaya and Terrebonne basins, Mississippi River Delta (MRD), Louisiana, US
Spatial Resolution: Approximately 4.7 to 4.8 m
Temporal Coverage: 2021-04-01 to 2021-09-25
Temporal Resolution: Once per season (Spring and Fall)
Site Boundaries: Latitude and longitude are given in decimal degrees.
| Site | Westernmost Longitude | Easternmost Longitude | Northernmost Latitude | Southernmost Latitude |
|---|---|---|---|---|
| Louisiana, US | -91.59072 | -89.67606 | 29.85101 | 29.05456 |
Data File Information
This dataset includes 21 files. There are 10 ENVI binary files (*.dat); each binary has an associated header file (*.hdr). There is one file in comma-separated values (.csv) format that provides site metadata and data derived from a GoPro camera.
The naming convention for the ENVI files is ang<YYYYMMDD>_frcov_<BBB>.<ext>, where
- <YYYYMMDD> = date of the AVIRIS-NG imagery acquisition in year (YYYY), month (MM), and day (DD). When imagery covers multiple days, the convention is <YYYYMMDD-DD>.
- <BBB> = name of coastal basin: "Atcha", "Bara", "Terre", or "TerreEast".
- <ext> = extension indicating file type: "dat" for ENVI binary, "hdr" for ENVI header.
ENVI Characteristics
- Coordinate system: UTM projection, zone 15N, WGS 84 datum (EPSG: 32615)
- Spatial resolution: 4.7 - 4.8 m
- No data value: -9999.
- Three bands: 1 = Green Vegetation (GV), 2 = Non-photosynthetic Vegetation (NPV), and 3 = Soil
- Pixel values: shade-normalized fractional cover, scaled 0 to 1, for each terrestrial pixel.
Example file names: ang20210401_frcov_Atcha.dat and ang20210401_frcov_Atcha.hdr
The GoPro_FieldCampaignData_2021.csv file holds site metadata and GoPro camera-derived information on in situ vegetation and soil cover (Table 1).
Table 1. Variables in GoPro_FieldCampaignData_2021.csv.
| Variable | Units | Description |
|---|---|---|
| month | M | Month of image in 2021: 3 = March, 8 = August |
| basin | - | Atchafalaya or Terrebonne |
| site_id | - | Study site ID number or "WLD" (Wax Lake Delta) |
| hgm_zone | - | "Intratidal" or "Supratidal" |
| station | - | Station number: "1" or "2" |
| gps_latitude | degrees north | Latitude of the site in decimal degrees |
| gps_longitude | degrees east | Longitude of the site in decimal degrees |
| agb_pixel_per_photo | 1 | Number of aboveground biomass (AGB) pixels in the photos calculated using the Class Statistics tool |
| agn_pixel_per_photo | 1 | Number of aboveground necromass (AGN) pixels in the photos calculated using the Class Statistics tool |
| soil_pixel_per_photo | 1 | Number of soil pixels in the photos calculated using the Class Statistics tool |
| water_pixel_per_photo | 1 | Number of water pixels in the photos calculated using the Class Statistics tool |
| agb_percent_per_photo | 1 | Percentage of AGB in photos calculated using the Class Statistics tool |
| agn_percent_per_photo | 1 | Percentage of AGN in photos calculated using the Class Statistics tool |
| soil_percent_per_photo | 1 | Percentage of soil in photos calculated using the Class Statistics tool |
| water_percent_per_photo | 1 | Percentage of water in photos calculated using the Class Statistics tool |
| agb_pixel_per_quadrat | 1 | Number of AGB pixels in a quadrat calculated using the Class Statistics tool |
| agn_pixel_per_quadrat | 1 | Number of AGN pixels in a quadrat calculated using the Class Statistics tool |
| soil_pixel_per_quadrat | 1 | Number of soil pixels in a quadrat calculated using the Class Statistics tool |
| water_pixel_per_quadrat | 1 | Number of water pixels in a quadrat calculated using the Class Statistics tool |
| agb_percent_per_quadrat | 1 | Percentage of AGB in a quadrat calculated using the Class Statistics tool |
| agn_percent_per_quadrat | 1 | Percentage of AGN in a quadrat calculated using the Class Statistics tool |
| soil_percent_per_quadrat | 1 | Percentage of soil in a quadrat calculated using the Class Statistics tool |
| water_percent_per_quadrat | 1 | Percentage of water in a quadrat calculated using the Class Statistics tool |
| photo_dimension_pixel_by_pixel | px x px | Photo image dimensions in number of pixels (px), rows x columns |
| photo_width | cm | Photo width |
| photo_height | cm | Photo height |
| photo_area | cm2 | Photo area |
| quadrat_width | cm | Quadrat width |
| quadrat_height | cm | Quadrat height |
| quadrat_area | cm2 | Quadrat area |
| quadrats_per_photo | 1 | Quadrats per photo |
| total_photo_area | m2 | Total area in the photo |
| photo_resolution | pixels cm-1 | Photo resolution |
Application and Derivation
Fractional coverage of different endmember types (i.e. GV, NPV, soil) is correlated with a vegetated area’s structure, phenology, and health or stress. The data products generated here can be used to inform maps of vegetation structure and productivity by providing information regarding the composition of photosynthetically active and inactive plant biomass. This information aids in assessment of primary productivity and organic matter deposition over a seasonal timescale.
Quality Assessment
The GoPro-derived dataset was used to validate the spectral unmixing results. The percent composition of each in situ GoPro image approximated the fractional composition of the endmembers in the corresponding unmixed AVIRIS-NG pixel.
The unmixed pixel fraction values were extracted at the GPS location of each of the 44 GoPro images for comparison (Figure 2). The validation showed an R2 of 0.660 and a mean absolute error (MAE) of 14.260% for the AVIRIS-NG-derived green vegetation (GV) vs. GoPro live aboveground biomass (AGB). Similarly, an R2 of 0.630 and an MAE of 12.131% was attained for AVIRIS-NG-derived non-photosynthetic vegetation (NPV) vs. GoPro aboveground necromass (AGN).
A water fraction from AVIRIS-NG was not derived due to water’s high spectral absorption beyond the near-infrared wavelengths, which can cause confusion with shade and introduce additional error and noise into the more important GV and NPV estimates.
Soil fractions were also estimated in the spectral unmixing but not validated with the GoPro imagery, because soil percentages in the in situ images were too low for proper validation. Soil cover was typically sparse, often underlying the plant material, and thus difficult to quantify using the airborne imaging spectrometer. Nevertheless, the soil endmember’s inclusion was important in the spectral unmixing to avoid overestimation of NPV. The final results also accurately show high soil fractions in exposed fields and banks.
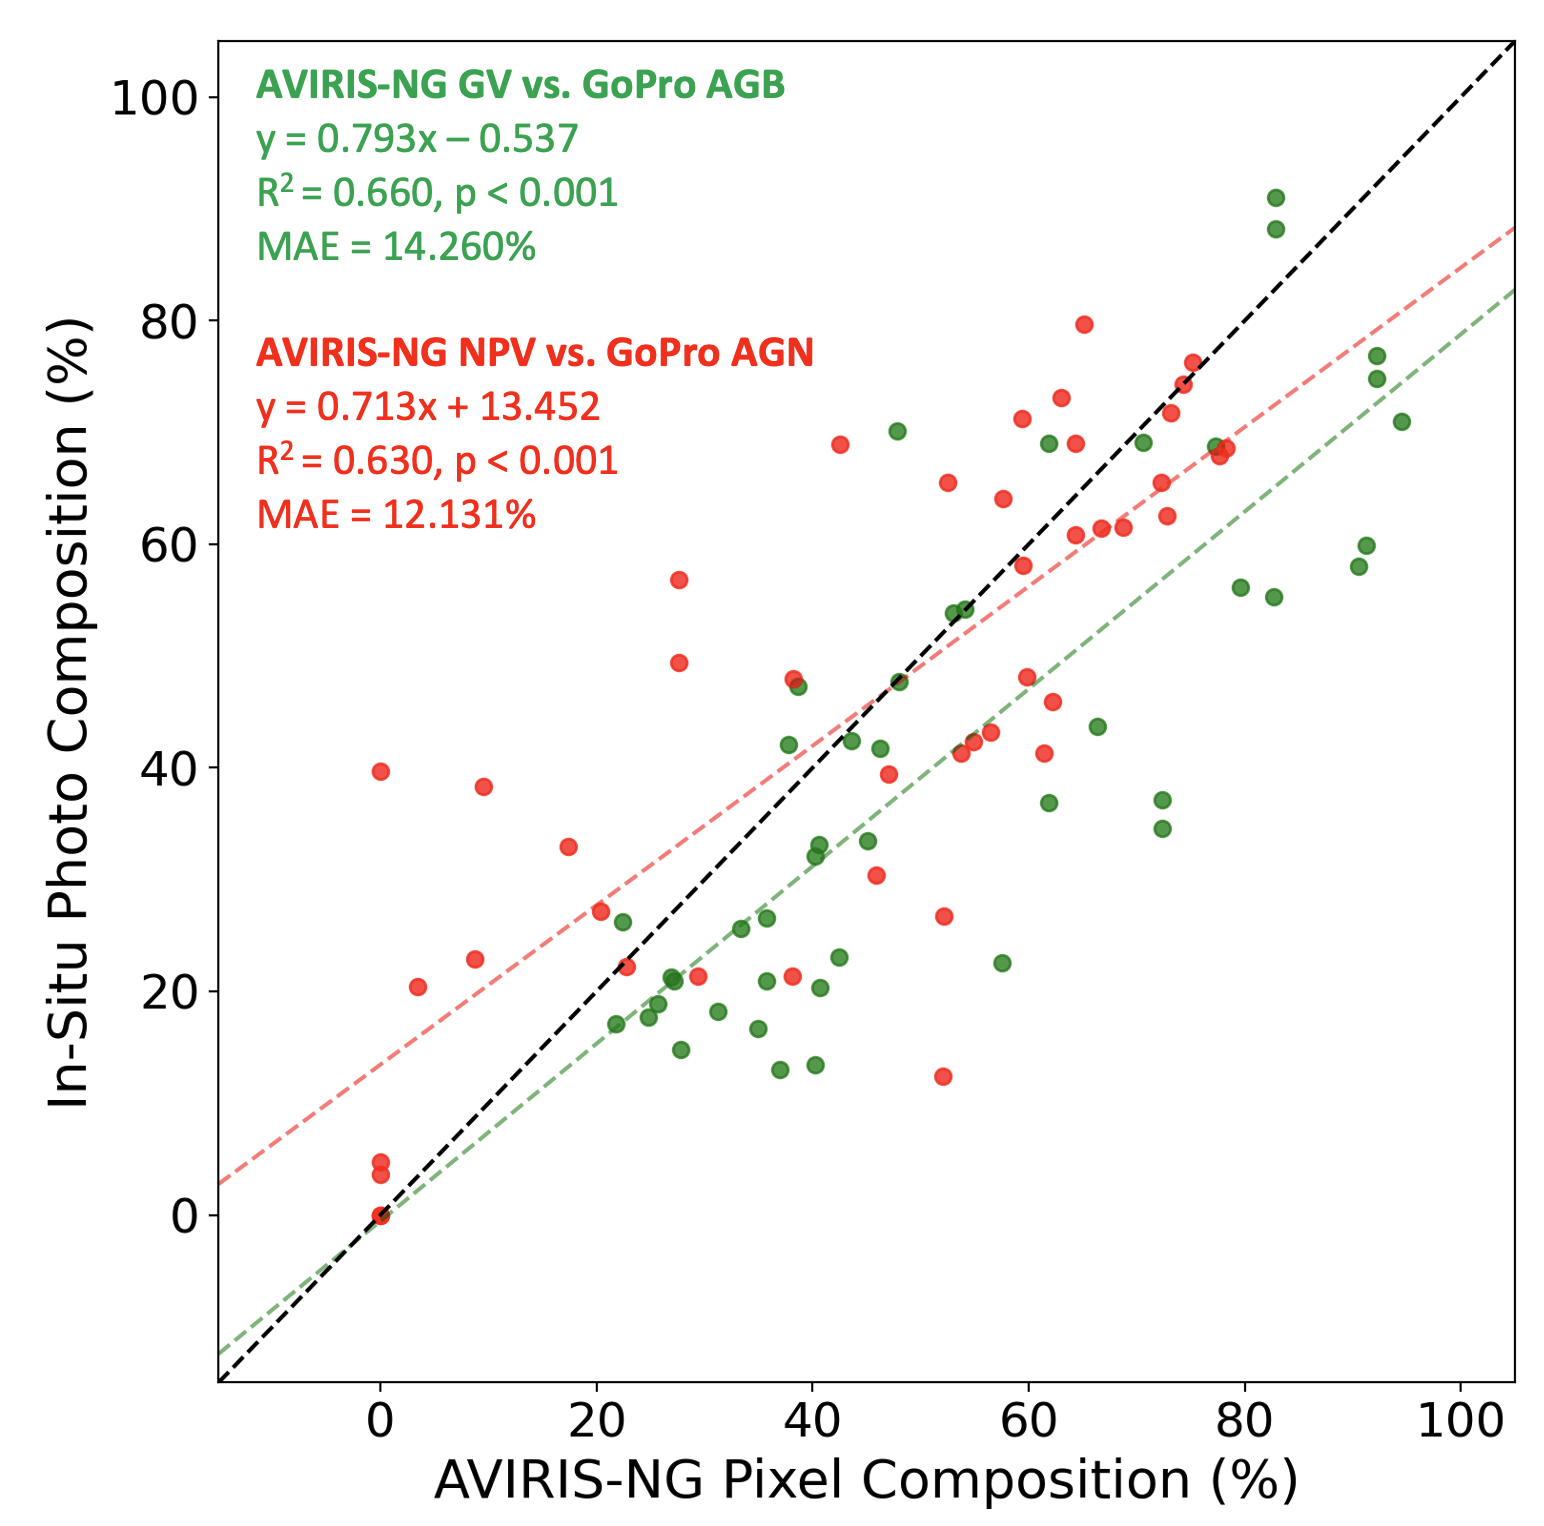
Figure 2. Fractional cover estimate error distributions for green vegetation (GV, green dots) and non-photosynthetic vegetation (NPV, red dots) between AVIRIS-NG-derived pixel compositions and in situ GoPro photo-derived compositions.
Data Acquisition, Materials, and Methods
AVIRIS-NG, the Next Generation Airborne Visible/Infrared Imaging Spectrometer, is a pushbroom spectral mapping system with a high signal-to-noise ratio (SNR) designed for high performance spectroscopy. AVIRIS-NG was developed as a successor to the Classic Airborne Visible Infrared Imaging Spectrometer (AVIRIS-C) (Green et al., 1998). The instrument covers the entire solar reflected spectrum from 380-2510 nm with a single Focal Plane Array (FPA) at a spectral sampling of approximately 5 nm. The AVIRIS- NG sensor has a 1 milliradian instantaneous field of view, providing altitude-dependent ground sampling distance ranging from sub-meter to 20 m scales. Its detector has a 640×480 pixel array, from which standard products are generated using the sensor’s 600 cross-track spatial samples and 425 spectral samples. Each acquisition is a “flight line” forming a continuous strip of pushbroom data that typically takes 1-10 minutes to acquire. Multiple aircraft overflights cover the region of interest in these strips, accumulating a combined map of the target area. For this campaign, AVIRIS-NG was implemented on a Dynamic Aviation King Air B200. The instrument has four components: 1) a sensor with its mount and camera glass mounted at a nadir port; 2) an onboard calibrator (OBC), mounted in the cabin next to the sensor; 3) a forward operator electronics rack; and 4) an aft thermal-control electronics rack.
Each AVIRIS-NG flightline was atmospherically corrected to produce Hemispherical-Directional surface reflectance datasets (Thompson et al., 2018; Thompson et al., 2019), followed by corrections for BRDF-effects and sun-glint over land and water pixels, respectively (Queally et al., 2021, Greenberg et al., 2022). Three in situ field spectra were selected from the USGS Spectral Library, (v7; Kokaly et al. 2017) to serve as endmembers in the linear spectral unmixing of each AVIRIS-NG mosaic dataset. These samples were ASD field spectrometer measurements of Spartina alterniflora, marsh wrack, and sand-each measured in coastal Louisiana and used to represent GV, NPV, and soil, respectively. The 1-nm field spectra were resampled to AVIRIS-NG’s 5-nm spectral resolution using each band’s listed full width at half-maximum (FWHM) to define its Gaussian response function. A shade endmember constituted by only zero values was also added to the spectral library to model the impact of shade on the observed pixel spectra. A linear spectral unmixing was performed in ENVI software using the four endmembers. The results were then shade-normalized, such that each estimated endmember fraction was divided by the sum of all non-shade endmembers in each pixel. This process generated final fractional composition products for GV, NPV, and soil, scaled from 0 to 1.
In addition to the AVIRIS-NG imagery and in situ field spectra, this analysis incorporated field images collected using a GoPro coincident with the AVIRIS-NG flightlines. Four nadir-pointing aerial photos were taken (4 m height) of the herbaceous vegetation at each hydrogeomorphic (HGM) zone using a GoPro HERO camera attached to a 5-m telescoping extension pole. During Spring 2021, no GoPro photos were taken of quadrats used during March vegetation sampling, and no photos were taken in Wax Lake Delta (WLD) in any of the HGM zones. The quadrat width, height, and area are the dimensions of the portion of the quadrat recorded within the image, not the actual quadrat measurements. During Fall 2021, the quadrat size in WLD Supratidal and Intertidal HGM zones was 1 m2. Quadrat size for the rest of the sites was 0.25 m2.
After selecting the best GoPro image for each site and HGM zone, image corrections were performed that included (where necessary) cropping, removal of chromatic aberration, lens corrections using the lens profile of the GoPro HERO camera, and image enhancement to improve quality (Figure 3). The enhanced and corrected images were imported into ENVI and a ROI (region of interest) dataset was created for each individual scene/image as part of the supervised classification step. The ROIs included the following classes: aboveground biomass (AGB; live/”green vegetation”), aboveground necromass (AGN; “non-photosynthetic vegetation” ), Soil, Water, and Miscellaneous (or Unclassified). For each ROI, clusters of about 30 samples for each class were created. After the completion of the supervised classification step, the Maximum Likelihood Classification method was used to assign each pixel to its corresponding class and exported as a .tiff file. The Class Statistics tool was used to calculate the number and percentage of pixels in each class (Table 1). The percent composition of each image thus approximated the fractional composition of the endmembers in the corresponding unmixed AVIRIS-NG pixel.
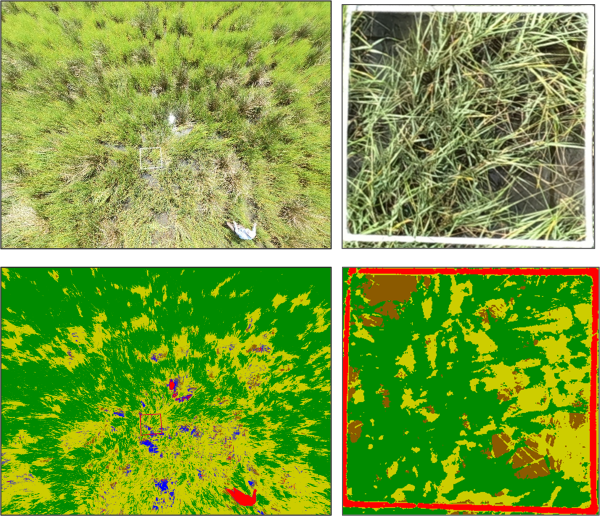
Figure 3.Two original GoPro images of vegetation taken in the field (top), and their corresponding processed and classified images (bottom). Images were taken at Saline site 421 (Terrebonne basin) during peak biomass season sampling period (August 2021).
Data Access
These data are available through the Oak Ridge National Laboratory (ORNL) Distributed Active Archive Center (DAAC).
Delta-X: AVIRIS-NG L2B Derived Fractional Cover, MRD, LA, USA, 2021
Contact for Data Center Access Information:
- E-mail: uso@daac.ornl.gov
- Telephone: +1 (865) 241-3952
References
Castañeda-Moya, E., and E. Solohin. 2023. Delta-X: Aboveground Biomass and Necromass across Wetlands, MRD, Louisiana, 2021, V2. ORNL DAAC, Oak Ridge, Tennessee, USA. https://doi.org/10.3334/ORNLDAAC/2237
Green, R.O., M.L. Eastwood, C.M. Sarture, T.G. Chrien, M. Aronsson, B.J. Chippendale, J.A. Faust, B.E. Pavri, C.J. Chovit, M. Solis, M.R. Olah, and O. Williams. 1998. Imaging spectroscopy and the Airborne Visible/Infrared Imaging Spectrometer (AVIRIS). Remote Sensing of Environment 65:227–248. https://doi.org/10.1016/S0034-4257(98)00064-9
Greenberg, E., D.R. Thompson, D. Jensen, P.A. Townsend, N. Queally, A. Chlus, C.G. Fichot, J.P. Harringmeyer, and M. Simard. 2022. An improved scheme for correcting remote spectral surface reflectance simultaneously for terrestrial BRDF and water-surface sunglint in coastal environments. Journal of Geophysical Research: Biogeosciences 127:e2021JG006712. https://doi.org/10.1029/2021JG006712
Kokaly, R.F., R.N. Clark, G.A. Swayze, K.E. Livo, T.M. Hoefen, N.C. Pearson, R.A. Wise, W.M., Benzel, H.A. Lowers, R.L. Driscoll, and A.J. Klein. 2017. USGS Spectral Library Version 7: U.S. Geological Survey Data Series 1035. https://doi.org/10.3133/ds1035.
Queally, N., Z. Ye, T. Zheng, A. Chlus, F. Schneider, R.P. Pavlick, and P.A. Townsend. 2022. FlexBRDF: A flexible BRDF correction for grouped processing of airborne imaging spectroscopy flightlines. Journal of Geophysical Research: Biogeosciences 127:e2021JG006622. https://doi.org/10.1029/2021JG006622
Thompson, D.R., D.J. Jensen, J.W. Chapman, M. Simard, and E. Greenberg. 2025. Delta-X: AVIRIS-NG BRDF-Adjusted Surface Reflectance and Mosaics, MRD, LA, 2021, V3. ORNL DAAC, Oak Ridge, Tennessee, USA. https://doi.org/10.3334/ORNLDAAC/2355
Thompson, D.R., V. Natraj, R.O. Green, M.C. Helmlinger, B.-C. Gao, and M.L. Eastwood. 2018. Optimal estimation for imaging spectrometer atmospheric correction. Remote Sensing of Environment 216:355–373. https://doi.org/10.1016/j.rse.2018.07.003
Thompson, D.R., K. Cawse-Nicholson, Z. Erickson, C.G. Fichot, C. Frankenberg, B.-C. Gao, M.M. Gierach, R.O. Green, D. Jensen, V. Natraj, and A. Thompson. 2019. A unified approach to estimate land and water reflectances with uncertainties for coastal imaging spectroscopy. Remote Sensing of Environment 231:111198. https://doi.org/10.1016/j.rse.2019.05.017