Documentation Revision Date: 2022-08-31
Dataset Version: 1
Summary
This dataset holds 220 ENVI files in compressed (*.zip) archives. Each archive includes a binary multiband ENVI image and a corresponding header (*.hdr) file containing metadata.
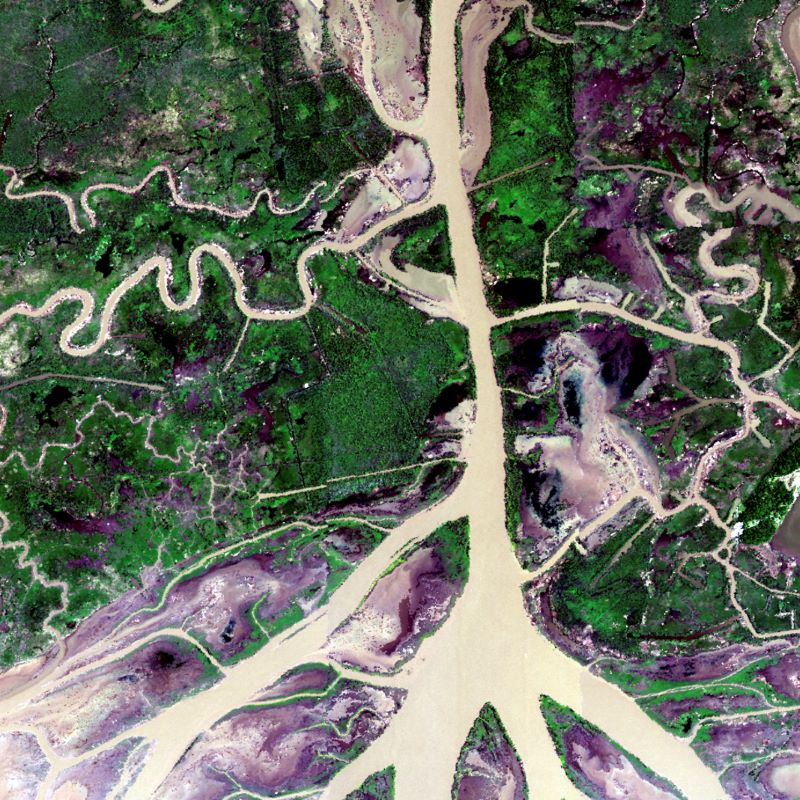
Figure 1: A BRDF and sunglint-corrected image of the Atchafalaya basin.
Citation
Thompson, D.R., D.J. Jensen, J.W. Chapman, M. Simard, and E. Greenberg. 2022. Delta-X: AVIRIS-NG BRDF-Adjusted Surface Reflectance, MRD, LA, 2021. ORNL DAAC, Oak Ridge, Tennessee, USA. https://doi.org/10.3334/ORNLDAAC/2025
Table of Contents
- Dataset Overview
- Data Characteristics
- Application and Derivation
- Quality Assessment
- Data Acquisition, Materials, and Methods
- Data Access
- References
Dataset Overview
This data provides AVIRIS-NG Bidirectional Reflectance Distribution Function (BRDF) and sunglint-corrected surface spectral reflectance images over the Atchafalaya and Terrebonne basins of the Mississippi River Delta (MRD) of coastal Louisiana, USA. Flights were acquired during the Spring and Fall 2021 deployments of the Delta-X campaign. The imagery was acquired by the Airborne Visible/Infrared Imaging Spectrometer - Next Generation (AVIRIS-NG) from 2021-03-27 to 2021-04-06 and 2021-08-18 to 2021-09-25. Reflectance data are provided as file sets for each flight line. In addition, ten files of mosaicked flight lines, by time period and over four locations (labeled Terre, Atcha, TerreEast, and Bara), are included. Only land pixels were corrected and mask files for the mosaic file coverage showing presence/absence of water are also included. For the Delta-X mission, these data serve to better understand rates of soil erosion, accretion, and creation in the delta system, with the goal of building better models of how river deltas will behave under relative sea level rise.
Project: Delta-X
The Delta-X mission is a 5-year NASA Earth Venture Suborbital-3 mission to study the Mississippi River Delta in the United States, which is growing and sinking in different areas. River deltas and their wetlands are drowning as a result of sea level rise and reduced sediment inputs. The Delta-X mission will determine which parts will survive and continue to grow, and which parts will be lost. Delta-X begins with airborne and in situ data acquisition and carries through data analysis, model integration, and validation to predict the extent and spatial patterns of future deltaic land loss or gain.
Related Data:
Thompson, D.R., D.J. Jensen, J. Chapman, E. Greenberg, and M. Simard. 2022. Delta-X: AVIRIS-NG L1B Spectral Radiance Products, MRD, Louisiana, 2021. ORNL DAAC, Oak Ridge, Tennessee, USA. https://doi.org/10.3334/ORNLDAAC/1987
Thompson, D.R., D.J. Jensen, J. Chapman, E. Greenberg, and M. Simard. 2022. Delta-X AVIRIS-NG L2 Surface Reflectance Products across the MRD, LA, USA, 2021. ORNL DAAC, Oak Ridge, Tennessee, USA. https://doi.org/10.3334/ORNLDAAC/1988.
Fichot, C.G., and J. Harringmeyer. 2022. Delta-X: Spectral Reflectance of Water Surface Across MRD, LA, USA, Spring 2021. ORNL DAAC, Oak Ridge, Tennessee, USA. https://doi.org/10.3334/ORNLDAAC/1994.
Jensen, D.J., D.R. Thompson, I.B. Mccubbin, and M. Simard. 2021. Pre-Delta-X: L2 AVIRIS-NG Surface Spectral Reflectance across MRD, LA, USA, 2015-2016. ORNL DAAC, Oak Ridge, Tennessee, USA. https://doi.org/10.3334/ORNLDAAC/1826
Data Characteristics
Spatial Coverage: Atchafalaya and Terrebonne basins, Mississippi River Delta (MRD), Louisiana, USA
Spatial Resolution: Approximately 3.8 to 5.4 m
Temporal Coverage: 2021-03-27 to 2021-09-25
Temporal Resolution: Multiple overpasses at irregular intervals
Spectral Parameters: 425 bands at 5 nm resolution with a range between 380 - 2500 nm
Study Area: Latitude and longitude are given in decimal degrees.
| Site | Westernmost Longitude | Easternmost Longitude | Northernmost Latitude | Southernmost Latitude |
|---|---|---|---|---|
| Atchafalaya and Terrebonne basins, Louisiana, US | -91.59 | -89.58 | 29.86 | 29.02 |
Data File Information
There are 220 multiband ENVI files provided in a compressed archive (*.zip). Each archive contains a binary datafile and an associated header (*.hdr) file containing metadata in text format.
There are three types of files:
- Individual reflectance flight lines:200 data files of BRDF- and sunglint-corrected surface reflectance measurements of an individual flight line
- Mosaics of reflectance flight lines: 10 data files of BRDF- and sunglint-corrected surface reflectance measurements as a mosaic of flight lines within a region of the study area (Table 2)
- Land mask files: 10 data files presenting presence (1) or absence (0) of land over the same extent as the mosaics of flight lines
File Naming Conventions
- Individual reflectance flight lines: angYYYYMMDDthhmmss_rfl_brdf.zip, where
- YYYYMMDDthhmmss = the date (YYYYMMDD) and time (hhmmss) of data acquisition in UTC
- rfl = reflectance
- brdf = Bidirectional Reflectance Distribution Function
- Mosaics of reflectance flight lines: angYYYYMMDD_rfl_brdf_loc.zip, where
- YYYYMMDD = the date of data acquisition in UTC. Some files include multiple dates, these are formatted YYYYMMDD-DD, where the first DD is the start date and the second DD is the end date)
- rfl = reflectance
- brdf = Bidirectional Reflectance Distribution Function
- loc is the relative location.
- Land mask files angYYYYMMDD_rfl_brdf_loc_mask.zip, where
- YYYYMMDD = the date of data acquisition in UTC. Some files include multiple dates, these are formatted YYYYMMDD-DD, where the first DD is the start date and the second DD is the end date)
- rfl = reflectance
- brdf = Bidirectional Reflectance Distribution Function
- loc is the relative location
- mask indicates that it is a binary mask file.
Data File Details
The reflectance files have:
- Bands at 5-nm resolution covering wavelengths from 380 - 2500 nm
- Horizontal spatial resolution is 3.8 - 5.4 m raster cells
- The range of valid surface reflectance values is 0.0 - 1.0
- No data values are indicated by -9999
Table 1. ENVI file metadata contained in the header (*.hdr) files.
| Variable | Description |
|---|---|
| samples | number of columns in image file |
| lines | number of rows in the image file |
| data ignore value | no data value |
| wavelength units | units for band wavelengths |
| correction factors | a vector of parameters, one per band, used in BRDF |
| wavelength | a vector of wavelength values, one per band |
| fwhm | full width at half maximum, a vector of values, one for each band, measuring spectral resolution |
| smoothing factors | a vector of values, one for each band, used for reducing noise in reflectance values |
Table 2. Mosaic File names and size
| Mosaic File Name | Size (GB) |
| ang2021-04-02-05_rfl_brdf_Terre.zip | 195.4 |
| ang2021-08-23-25_rfl_brdf_Terre.zip | 198.8 |
| ang2021-09-23_rfl_brdf_Terre.zip | 196.8 |
| ang2021-04-01_rfl_brdf_Atcha.zip | 97.0 |
| ang2021-08-20-22_rfl_brdf_Atcha.zip | 96.3 |
| ang2021-09-24_rfl_brdf_Atcha.zip | 66.7 |
| ang2021-04-02-04_rfl_brdf_TerreEast.zip | 66.0 |
| ang2021-09-24-25_rfl_brdf_TerreEast.zip | 65.2 |
| ang2021-04-02-05_rfl_brdf_Bara.zip | 55.4 |
| ang2021-09-24-25_rfl_brdf_Bara.zip | 48.6 |
Application and Derivation
Surface reflectance spectra are commonly used to measure properties of the surface composition. They can indicate water column constituents, soil composition, vegetation functional traits, and more. For a description of the imaging spectroscopy measurement and its applications to different Earth science disciplines, see Cawse-Nicholson et al. (2021).
Quality Assessment
Data quality was monitored at several steps during acquisition and analysis. First, operators performed a preliminary assessment using a real-time display in the cabin by monitoring images and spectra in a scrolling “waterfall” plot. This assessment allowed identification of impinging clouds, instrument artifacts, or other issues that would require adjustment or (in the worst case) immediate reacquisition. Second, representative spectra were used to assess the performance of science data algorithms at each stage. These could be matched to in-situ reference data in order to validate calibration as well as estimate uncertainty following procedures outlined in Thompson et. al. (2019a, 2019b). In general, the campaign data from spring 2021 have superior surface reflectance estimation due to the better atmospheric conditions encountered during those flights. Fall 2021 overflights encountered higher atmospheric haze and water vapor loadings, with a larger number of clouds.
Bad data flags (-9999, noted in header information) were embedded in the spectroscopic data. These flags serve mainly to mark the periphery of an orthorectified image where no spectra were acquired. Clouds and other valid but unusable regions were still considered bona fide scene content and not altered. However, for surface studies authors recommend ignoring a large margin of data (1 km or more) around any visible clouds to avoid their disruption to the downwelling incident light field and corresponding increase in atmospheric correction error.
Data Acquisition, Materials, and Methods
AVIRIS-NG is a pushbroom spectral mapping system with a high signal-to-noise ratio (SNR) designed for high performance spectroscopy. AVIRIS-NG was developed as a successor to the Classic Airborne Visible Infrared Imaging Spectrometer (AVIRIS-C) (Green et al., 1998). The instrument covers the entire solar reflected spectrum from 380-2510 nm with a single Focal Plane Array (FPA), at a spectral sampling of approximately 5 nm. The AVIRIS- NG sensor has a 1 milliradian instantaneous field of view, providing altitude-dependent ground sampling distance ranging from sub-meter to 20 m scales. Its detector has a 640×480-pixel array, from which standard products are generated using the sensor’s 600 cross-track spatial samples and 425 spectral samples. Each acquisition is a “flight line” forming a continuous strip of pushbroom data that typically takes 1-10 minutes to acquire. Multiple aircraft overflights cover the region of interest in these strips, accumulating a combined map of the target area. For this campaign, AVIRIS-NG was implemented on a Dynamic Aviation King Air B200. The instrument has four components: 1) a sensor with its mount and camera glass mounted at a nadir port; 2) an onboard calibrator (OBC), mounted in the cabin next to the sensor; 3) a forward operator electronics rack, and 4) an aft thermal-control electronics rack.
AVIRIS-NG acquired data in its standard operating mode over regions of interest in the Atchafalaya and Terrebonne basins. The area was provisionally split into multiple mosaics— a large “survey” covering the entire domain—which required multiple days to complete. Flight lines had a 15% overlap area at their margins to accommodate position and geometric sampling uncertainty. The precise direction of flight lines was adjusted to accommodate local time and weather conditions and to ameliorate sun glint effects. Because AVIRIS-NG’s data collection was impeded when clouds are present below or above the aircraft, the team typically decided which days to fly based on an early morning “go/no-go” decision from the daily weather forecast.
The AVIRIS-NG radiance data (Level 1B) were derived by calibrating incident radiance spectra measured by the sensor using the techniques described in Thompson et al. (2018a, 2018b) and Chapman et al. (2019). These radiances were then analyzed to estimate atmospheric state and surface reflectance (Level 2) using the method of Thompson et al. (2018a, 2018b, 2019a). During this stage, a vicarious radiometric correction on the order of 1% is applied which evens out minor discrepancies between the laboratory calibration and flight conditions. This vicarious adjustment uses an in situ reference from the Delta-X flight campaign, and a correction procedure detailed in Bruegge et al. (2021). The observed reflectance signal is influenced by the bi-directional reflectance distribution function (BRDF) resulting from variation in solar and instrument viewing angles, manifesting in differences in illumination intensity across various surface cover types within each scene. The BRDF effects were estimated and corrected using the algorithm described in Queally et al. (2022). Only land pixels were corrected in this way; water pixels, which were recognized by a band ratio combination (Greenberg et al., 2022), were instead adjusted to remove specular sunglint using the approach in Gao and Li (2021). This processing cascade is visualized in Figure 2.
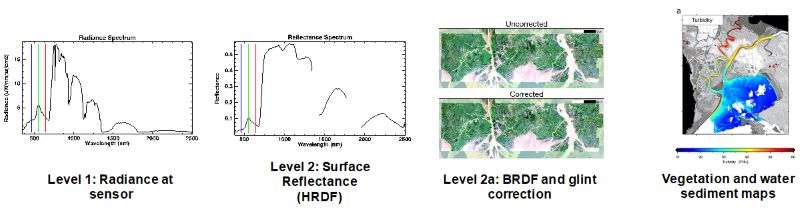
Figure 2: AVIRIS-NG data processing chain, showing the progression from Radiance (Level 1) products to Reflectance (Level 2), BRDF and sunglint correction (Level 2B); image from Greenberg et al., 2022, and Vegetation and water property maps (Level 3); image from Fichot et al., 2016.
Data Access
These data are available through the Oak Ridge National Laboratory (ORNL) Distributed Active Archive Center (DAAC).
Delta-X: AVIRIS-NG BRDF-Adjusted Surface Reflectance, MRD, LA, 2021
Contact for Data Center Access Information:
- E-mail: uso@daac.ornl.gov
- Telephone: +1 (865) 241-3952
References
Bruegge, C.J., G.T. Arnold, J. Czapla-Myers, R. Dominguez, M.C. Helmlinger, D.R. Thompson, J.V. den Bosch, and B.N. Wenny. 2021. Vicarious Calibration of eMAS, AirMSPI, and AVIRIS Sensors During FIREX-AQ. IEEE Transactions on Geoscience and Remote Sensing 59:10286–10297. https://doi.org/10.1109/TGRS.2021.3066997.
Cawse-Nicholson, K., P.A. Townsend, D. Schimel, A.M. Assiri, P.L. Blake, M.F. Buongiorno, P. Campbell, N. Carmon, K.A. Casey, R.E. Correa-Pabón, K.M. Dahlin, H. Dashti, P.E. Dennison, H. Dierssen, A. Erickson, J.B. Fisher, R. Frouin, C.K. Gatebe, H. Gholizadeh, M. Gierach, N.F. Glenn, J.A. Goodman, D.M. Griffith, L. Guild, C.R. Hakkenberg, E.J. Hochberg, T.R. H. Holmes, C. Hu, G. Hulley, K.F. Huemmrich, R.M. Kudela, R.F. Kokaly, C.M. Lee, R. Martin, C.E. Miller, W.J. Moses, F.E. Muller-Karger, J.D. Ortiz, D.B. Otis, N. Pahlevan, T.H. Painter, R. Pavlick, B. Poulter, Y. Qi, V.J. Realmuto, D. Roberts, M.E. Schaepman, F.D. Schneider, F.M. Schwandner, S.P. Serbin, A.N. Shiklomanov, E.N. Stavros, D.R. Thompson, J.L. Torres-Perez, K.R. Turpie, M. Tzortziou, S. Ustin, Q. Yu, Y. Yusup, and Q. Zhang. 2021. NASA’s surface biology and geology designated observable: A perspective on surface imaging algorithms. Remote Sensing of Environment 257:112349. https://doi.org/10.1016/j.rse.2021.112349.
Chapman, J.W., D.R. Thompson, M.C. Helmlinger, B.D. Bue, R.O. Green, M.L. Eastwood, S. Geier, W. Olson-Duvall, and S.R. Lundeen. 2019. Spectral and radiometric calibration of the Next Generation Airborne Visible Infrared Spectrometer (AVIRIS-NG). Remote Sensing 11:2129. https://doi.org/10.3390/rs11182129.
Fichot, C.G., and J. Harringmeyer. 2022. Delta-X: Spectral Reflectance of Water Surface Across MRD, LA, USA, Spring 2021. ORNL DAAC, Oak Ridge, Tennessee, USA. https://doi.org/10.3334/ORNLDAAC/1994.
Fichot, C.G., B.D. Downing, B.A. Bergamaschi, L. Windham-Myers, M. Marvin-DiPasquale, D.R. Thompson, and M.M. Gierach. 2016. High-resolution remote sensing of water quality in the San Francisco Bay–Delta Estuary. Environmental Science & Technology 50:573–583. https://doi.org/10.1021/acs.est.5b03518.
Gao, B.C., and R.-R. Li. 2021. Correction of sunglint effects in high spatial resolution hyperspectral imagery using SWIR or NIR bands and taking account of spectral variation of refractive index of water: Advances in Environmental and Engineering Research 2:16. https://doi.org/10.21926/aeer.2103017.
Green, R.O., M.L. Eastwood, C.M. Sarture, T.G. Chrien, M. Aronsson, B.J. Chippendale, J.A. Faust, B.E. Pavri, C.J. Chovit, M. Solis, M.R. Olah, and O. Williams. 1998. Imaging spectroscopy and the Airborne Visible/Infrared Imaging Spectrometer (AVIRIS). Remote Sensing of Environment 65:227–248. https://doi.org/10.1016/S0034-4257(98)00064-9.
Greenberg, E., D.R. Thompson, D. Jensen, P.A. Townsend, N. Queally, A. Chlus, C.G. Fichot, J.P. Harringmeyer, and M. Simard. 2022. An improved scheme for correcting remote spectral surface reflectance simultaneously for terrestrial BRDF and water-surface sunglint in coastal environments. Journal of Geophysical Research: Biogeosciences 127:e2021JG006712. https://doi.org/10.1029/2021JG006712
Jensen, D.J., D.R. Thompson, I.B. Mccubbin, and M. Simard. 2021. Pre-Delta-X: L2 AVIRIS-NG Surface Spectral Reflectance across MRD, LA, USA, 2015-2016. ORNL DAAC, Oak Ridge, Tennessee, USA. https://doi.org/10.3334/ORNLDAAC/1826
Thompson, D.R., D.J. Jensen, J. Chapman, E. Greenberg, and M. Simard. 2022. Delta-X: AVIRIS-NG L1B Spectral Radiance Products, MRD, Louisiana, 2021. ORNL DAAC, Oak Ridge, Tennessee, USA. https://doi.org/10.3334/ORNLDAAC/1987
Thompson, D.R., D.J. Jensen, J. Chapman, E. Greenberg, and M. Simard. 2022. Delta-X AVIRIS-NG L2 Surface Reflectance Products across the MRD, LA, USA, 2021. ORNL DAAC, Oak Ridge, Tennessee, USA. https://doi.org/10.3334/ORNLDAAC/1988.
Thompson, D.R., K. Cawse-Nicholson, Z. Erickson, C.G. Fichot, C. Frankenberg, B.-C. Gao, M.M. Gierach, R.O. Green, D. Jensen, V. Natraj, and A. Thompson. 2019a. A unified approach to estimate land and water reflectances with uncertainties for coastal imaging spectroscopy. Remote Sensing of Environment 231:111198. https://doi.org/10.1016/j.rse.2019.05.017.
Thompson, D.R., L. Guanter, A. Berk, B.-C. Gao, R. Richter, D. Schläpfer, and K.J. Thome. 2019b. Retrieval of atmospheric parameters and surface reflectance from visible and shortwave infrared imaging spectroscopy data. Surveys in Geophysics 40:333–360. https://doi.org/10.1007/s10712-018-9488-9.
Thompson, D.R., J.W. Boardman, M.L. Eastwood, R.O. Green, J.M. Haag, P. Mouroulis, and B. Van Gorp. 2018a. Imaging spectrometer stray spectral response: In-flight characterization, correction, and validation. Remote Sensing of Environment 204:850–860. https://doi.org/10.1016/j.rse.2017.09.015.
Thompson, D.R., V. Natraj, R.O. Green, M.C. Helmlinger, B.-C. Gao, and M.L. Eastwood. 2018b. Optimal estimation for imaging spectrometer atmospheric correction. Remote Sensing of Environment 216:355–373. https://doi.org/10.1016/j.rse.2018.07.003.
Queally, N., Z. Ye, T. Zheng, A. Chlus, F. Schneider, R. Pavlick, and P. A. Townsend. 2022. FlexBRDF: A flexible BRDF correction for grouped processing of airborne imaging spectroscopy flightlines. Journal of Geophysical Research: Biogeosciences 127:e2021JG006622. https://doi.org/10.1029/2021JG006622.