Documentation Revision Date: 2023-01-21
Dataset Version: 1.1
Summary
Delta-X was a joint airborne and field campaign in the Mississippi River Delta that took place during Spring and Fall 2021. The Delta-X campaign conducted airborne (remote sensing) and field (in situ) measurements to observe hydrology, water quality (e.g., total suspended solids (TSS)), and vegetation structure. This data serves for the continued development of algorithms and models. The Delta-X algorithms are used to convert remote sensing observables to geophysical parameters, and to develop numerical, hydrodynamic and ecological models.
This dataset includes a total of 2,392 files: 1,460 Single Look Complex (*.slc) stack files, 880 annotation (*.ann) files, 20 latitude-longitude-height (*.llh) files, 20 look vector (*.lkv) files, and 12 Doppler centroid-slant range (*.dop) files.
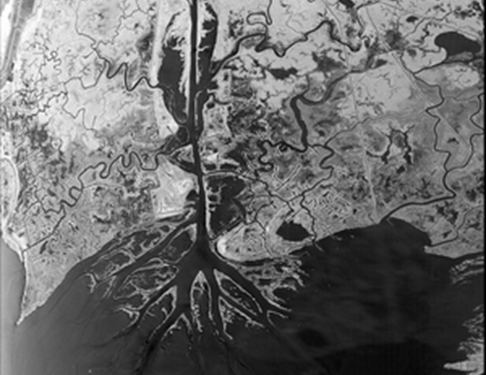
Figure 1. A single image product from the UAVSAR SLC stack atchaf_19809_02 collected on 27 March 2021, over the Atchafalaya Basin, Louisiana. The image shows the amplitude of the HH-polarization SLC data in radar coordinates.
Citation
Jones, C., M. Simard, Y. Lou, and T. Oliver-Cabrera. 2022. Delta-X: UAVSAR L1 Single Look Complex (SLC) Stack Products, MRD, Louisiana, 2021. ORNL DAAC, Oak Ridge, Tennessee, USA. https://doi.org/10.3334/ORNLDAAC/1984
Table of Contents
- Dataset Overview
- Data Characteristics
- Application and Derivation
- Quality Assessment
- Data Acquisition, Materials, and Methods
- Data Access
- References
- Dataset Revisions
Dataset Overview
This dataset contains UAVSAR Level 1 (L1) Single Look Complex (SLC) stack products for Delta-X flight lines acquired during 2021-03-27 to 2021-04-18 (spring) and 2021-09-03 to 2021-09-13 (fall). The data were collected by Uninhabited Aerial Vehicle Synthetic Aperture Radar (UAVSAR), a polarimetric L-band synthetic aperture radar flown on the NASA Gulfstream-III (C20) aircraft as part of the Delta-X campaign. The study area includes the Atchafalaya Basin, in Southern Louisiana, USA, within the Mississippi River Delta (MRD) floodplain. Repeat pass interferometric synthetic aperture (InSAR) data are a standard UAVSAR product delivered by the UAVSAR processing team. These repeat pass SLC stack co-registered time series data were used as the underlying data for higher level data products. These higher level products provide a time series of water level changes and address a goal of the Delta-X campaign to measure water-level changes throughout wetlands. Data quality was assessed by comparing water elevation estimates with data from in situ water level gauges throughout the study area. These L1 data contain slant range single look complex (SLC), latitude/longitude/height, look vector, doppler, and metadata files. The data are provided in SLC stack format (*.slc) with associated annotation (*.ann), latitude-longitude-height (*.llh), look vector (*.lkv), and Doppler centroid-slant range (*.dop) files. The single look complex (SLC) stacks are in the HH, HV, VH, and VV polarizations. The same area was sampled at approximately 30-minute intervals. The SLCs are not corrected for residual baseline (BU).
Delta-X was a joint airborne and field campaign in the Mississippi River Delta that took place during Spring and Fall 2021. The Delta-X campaign conducted airborne (remote sensing) and field (in situ) measurements to observe hydrology, water quality (e.g., total suspended solids (TSS)), and vegetation structure. This data serves for the continued development of algorithms and models. The Delta-X algorithms are used to convert remote sensing observables to geophysical parameters, and to develop numerical, hydrodynamic and ecological models.
Project: Delta-X
The Delta-X mission is a 5-year NASA Earth Venture Suborbital-3 mission to study the Mississippi River Delta in the United States, which is growing and sinking in different areas. River deltas and their wetlands are drowning as a result of sea level rise and reduced sediment inputs. The Delta-X mission will determine which parts will survive and continue to grow, and which parts will be lost. Delta-X begins with airborne and in situ data acquisition and carries through data analysis, model integration, and validation to predict the extent and spatial patterns of future deltaic land loss or gain.
Related Publications
Jensen, D., K.C. Cavanaugh, M. Simard, G.S. Okin, E. Castañeda-Moya, A. McCall, and R. R. Twilley. 2019. Integrating imaging spectrometer and synthetic aperture radar data for estimating wetland vegetation aboveground biomass in coastal Louisiana. Remote Sensing 11:2533. https://doi.org/10.3390/rs11212533
Oliver-Cabrera, T., C.E. Jones, Z. Yunjun, and M. Simard. 2021. InSAR Phase Unwrapping Error Correction for Rapid Repeat Measurements of Water Level Change in Wetlands. IEEE Transactions on Geoscience and Remote Sensing:1–15. https://doi.org/10.1109/TGRS.2021.3108751
Related Datasets
Jones, C., T. Oliver-Cabrera, M. Simard, and Y. Lou. 2022. Delta-X: UAVSAR L1B Interferometric Products, MRD, Louisiana, 2021. ORNL DAAC, Oak Ridge, Tennessee, USA. https://doi.org/10.3334/ORNLDAAC/1979
Jones, C., T. Oliver-Cabrera, M. Simard, and Y. Lou. 2022. Delta-X: UAVSAR Level 2 Geocoded Interferometric Products, LA, USA, 2021. ORNL DAAC, Oak Ridge, Tennessee, USA. https://doi.org/10.3334/ORNLDAAC/2057
Jones, C., T. Oliver-Cabrera, M. Simard, and Y. Lou. 2022. Delta-X: UAVSAR Level 3 Geocoded InSAR Derived Water Level Changes, LA,USA, 2021. ORNL DAAC, Oak Ridge, Tennessee, USA. https://doi.org/10.3334/ORNLDAAC/2058
Jones, C., M. Simard, Y. Lou, and T. Oliver. 2021. Pre-Delta-X: L1 UAVSAR Single Look Complex and Interferograms, MRD, LA, USA, 2016. ORNL DAAC, Oak Ridge, Tennessee, USA. https://doi.org/10.3334/ORNLDAAC/1816
Simard, M., M.W. Denbina, D.J. Jensen, and R. Lane. 2020. Pre-Delta-X: Water Levels across Wax Lake Outlet, Atchafalaya Basin, LA, USA, 2016. ORNL DAAC, Oak Ridge, Tennessee, USA. https://doi.org/10.3334/ORNLDAAC/1801
Acknowledgments
This work was supported by NASA Earth Venture Suborbital-3 (EVS-3) program (grant NNH17ZDA001N-EVS3).
Data Characteristics
Spatial Coverage: Atchafalaya and Terrebonne Basins, southern coast of Louisiana, USA
Spatial Resolution: 0.8 m (along- flight-line) by 1.7 m (slant range, along line-of-sight (LOS))
Temporal Coverage: 2021-03-27 to 2021-04-18 (spring) and 2021-09-03 to 2021-09-13 (fall)
Temporal Resolution: Repeated samples at 30-minute intervals
Site Boundaries: Latitude and longitude are given in decimal degrees.
| Site | Westernmost Longitude | Easternmost Longitude | Northernmost Latitude | Southernmost Latitude |
|---|---|---|---|---|
| Atchafalaya and Terrebonne Basins | -91.5894 | -90.1330 | 29.7805 | 29.0130 |
Data File Information
This dataset includes a total of 2,392 files: 1,460 Single Look Complex (*.slc) stack files, 880 annotation (*.ann) files, 20 latitude-longitude-height (*.llh) files, 20 look vector (*.lkv) files, and 12 Doppler centroid-slant range (*.dop) files.
The *.slc, *.llh, and *.lkv files are in binary format. The *.ann and *.dop are in plain text format.
This L1 dataset is intended for users who are familiar with data from synthetic aperture radar, especially products from UAVSAR (https://uavsar.jpl.nasa.gov/). Contact UAVSAR for detailed information on how to interpret the files (https://uavsar.jpl.nasa.gov/cgi-bin/contact.pl).
File Naming Convention
The SLC (*.slc) and annotation (*.ann) files are named according to the UAVSAR standard product file naming convention. Each SLC and annotation file name is in the following format:
{site name}_{line ID}_{flight ID}_{data take counter}_{acquisition date}_{band}{steering}{polarization}_{stack_number}_ {baseline correction}_{segment number}_{downsample factor}.slc
{site name}_{line ID}_{flight ID}_{data take counter}_{acquisition date}_{band}{steering}{polarization}_{stack_number}_ {baseline correction}.ann
The latitude-longitude-height (*.llh) files and look vector (*.lkv) files are named following the standard format:
{site name}_{line ID}_{stack number}_{baseline correction}_{segment number}_{downsample factor}.llh or .lkv
The Doppler centroid versus slant range (*.dop) files are named:
{site name}_{line ID}_{stack number}_{baseline correction}.dop
For all files,
- site name = "atchaf", "eterre" or "wterre"; 6-character alphanumeric site name assigned to the UAVSAR flight line.
- line ID = 5-character flight line ID assigned to the UAVSAR flight line (Table 2, Fig 3). The first 3 characters are the aircraft heading in degrees from North, and the last 2 characters are an alphanumeric counter chosen to ensure uniqueness of the ID.
- acquisition date = in format of YYMMDD, encoded as YY = the last two digits of the year, MM = month, DD = day of month, in UTC.
Table 1. File names and descriptions. JPL’s UAVSAR website provides detailed Information about the data formats for SLC stacks and associated files. The binary files have little endian format with no header bytes.
| File Name | Description | Data Format |
|---|---|---|
|
*.slc |
Single look complex (SLC) stacks in the HH, HV, VH, and VV polarizations. The same area was sampled at approximately 30-minute intervals (Fig. 3). The SLCs are not corrected for residual baseline (BU). | Binary, complex floating-point: 8 bytes per pixel. |
| *.ann | Annotation files with metadata for SLC files, which includes date and time of image acquisition, bounding coordinates, flight line heading, and technical parameters pertinent to UAVSAR settings. There is one annotation file for each SLC, unless the SLC product includes >1 segment. | ASCII text with each line listing a keyword and value. Comments are indicated by semicolon (;). |
| *.llh | Files containing latitude, longitude, and height that correspond to each pixel in the SLC. | Binary, floating point: 12 bytes per pixel (4 bytes for latitude, 4 bytes for longitude, 4 bytes for height). |
| *.lkv | Files containing look vector at the target pointing from the aircraft to the ground, in ENU (east, north, up) components. | Binary, floating point: 12 bytes per pixel (4 bytes for east, 4 bytes for north, 4 bytes for up). |
| *.dop | Files containing Doppler centroid versus slant range. | ASCII text in two columns: range in m, doppler in radians m-1. |
Application and Derivation
The UAVSAR interferometric products serve as maps of water surface levels throughout the wetland regions. These repeat pass SLC stack products are co-registered time series data and were used to produce Level 2 and Level 3 products (Jones et al., 2022a, 2022b, 2022c). These higher level products provide a time series of water level changes (Oliver-Cabrera et al., 2021). These measurements were used to evaluate hydrodynamic models and compare their performance.
Quality Assessment
Data quality was assessed by comparing water elevation estimates with data from in situ water level gauges throughout the study area. Residual errors were assessed through a scene-wide comparison of elevation estimates for sites above the high-water level. Pixels that lack data or which failed quality tests were marked with a “no data” value (NaN).
Data Acquisition, Materials, and Methods
UAVSAR is a polarimetric L-band synthetic aperture radar operating with 80 MHz bandwidth from 1217.5–1297.5 GHz designed for interferometry (InSAR) (Hensley et al., 2009). UAVSAR’s swath width is 22 km, which illuminates an area from 22°–67° incidence angle, with 3 m (cross-track average) by 1 m (along-track) single look ground resolution. The instrument was flown on a Gulfstream-III (C20) aircraft with the radar electronics and antenna housed in a pod mounted below the fuselage (Fig. 2).
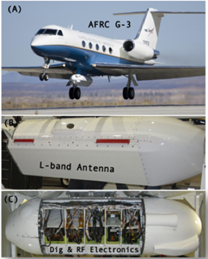
Figure 2. UAVSAR is flown on a Gulfstream-III aircraft, mounted in a pod hung below the fuselage.
The radar instrument is designed to minimize the number of interfaces with the aircraft for improved portability. The aircraft provides 28 V DC power to the radar via the Power Distribution Unit (PDU), which is also responsible for maintaining the thermal environment in the pod. The instrument uses both an embedded GPS inertial navigation unit (EGI) and a differential GPS (DGPS) unit to derive the antenna position, attitude and velocity in real-time. Waypoints for the desired flight paths are generated prior to flight by the Flight Planning Subsystem and loaded into the platform’s Precision Autopilot system and the radar’s Automatic Radar Controller (ARC) along with radar command information for each waypoint. The ARC is designed to operate in a fully autonomous mode or to accept commands from the Radar Operator Workstation (ROW) through an ethernet connection. The active array antenna consists of 24 L-band Transmit/Receive modules that feed 48 radiating elements within the 0.5 m by 1.5 m array. Robust differential interferometric measurement imposes two observational constraints on the UAVSAR radar and platform, namely, flight track repeatability and antenna steering capability. The UAVSAR G-III aircraft contains a Platform Precision Autopilot (PPA) system (Lin et al., 2008) to control the aircraft position through the aircraft’s instrument landing system based upon high precision real-time position information provided by a DGPS unit that is part of the radar instrument. The aircraft normally flies within 5 meters of the planned flight track. The antenna is electronically steered to compensate for variations in the yaw and pitch angles of the aircraft, which arise from varying and different wind conditions aloft both within a single acquisition and on repeated tracks. The steering adjustments are designed to maintain a constant look direction and the adjustments are based on real-time attitude angle measurements derived from the EGI.
A minimum of two operators are onboard the aircraft during UAVSAR flights, one the radar operator and the other the PPA operator. The system contains automated on-board track monitoring software that evaluates flight performance during science data collection based on predefined track quality criteria and notifies the operators when the aircraft deviates from the planned track outside the bounds of accepted tolerances. The operator can then request that the flight line be aborted and reacquired. The decision to re-fly lines is made with consideration to line priority, aircraft fuel levels and crew day limitations. During Delta-X flights, the UAVSAR flight crew included a mission scientist from the Delta-X team to make decisions about line priority and reacquiring lines in cases where a flight line is aborted.
During the Delta-X campaign, the UAVSAR instrument was operated in its standard acquisition configuration, operating at an altitude of 12.5 km in quad-polarization mode, transmitting horizontally and vertically polarized radiation on alternate pulses and receiving both co-polarized (HH or VV) and cross-polarized (HV or VH) returns for each pulse.
These Level 1 (L1) UAVSAR single look complex (SLC) co-registered stack products were used as the underlying data for higher level data products (e.g., Jones et al., 2022a, 2022b, 2022c).
Table 2. Delta-X L1 SLC stacks from the Delta-X 2021 campaign. These are quad-polarization stacks.
| UAVSAR flight.line | Baseline L0 SLC Product |
|---|---|
| atchaf_06309 | atchaf_06309_02 |
| atchaf_06309_03 | |
| atchaf_19809 | atchaf_19809_02 |
| atchaf_19809_03 | |
| wterre_16300 | wterre_16300_02 |
| wterre_16300_03 | |
| wterre_34202 | wterre_34202_02 |
| wterre_34202_03 | |
| eterre_08705 | eterre_08705_02 |
| eterre_08705_03 | |
| eterre_27309 | eterre_27309_01 |
| eterre_27309_02 |
Table 3. Summary of all UAVSAR flight lines and number of acquisitions (data takes) during the Delta-X 2021 campaign. Detailed information about these flights is available from https://uavsar.jpl.nasa.gov/ by searching on the flight line name.
| UAVSAR flight line | Date | Number of acquisitions |
|---|---|---|
| atchaf_06309 | 2021-03-27 | 8 |
| 2021-04-01 | 7 | |
| 2021-04-02 | 9 | |
| 2021-09-05 | 9 | |
| 2021-09-13 | 2 | |
| atchaf_19809 | 2021-03-23 | 9 |
| 2021-04-01 | 9 | |
| 2021-04-02 | 9 | |
| 2021-09-05 | 9 | |
| 2021-09-13 | 4 | |
| wterre_16300 | 2021-04-05 | 8 |
| 2021-04-06 | 7 | |
| 2021-04-07 | 7 | |
| 2021-09-03 | 6 | |
| 2021-09-12 | 7 | |
| wterre_34202 | 2021-04-05 | 8 |
| 2021-04-06 | 6 | |
| 2021-04-07 | 8 | |
| 2021-09-03 | 7 | |
| 2021-09-12 | 8 | |
| eterre_08705 | 2021-04-12 | 8 |
| 2021-04-16 | 6 | |
| 2021-04-18 | 7 | |
| 2021-09-04 | 8 | |
| 2021-09-07 | 8 | |
| eterre_27309 | 2021-04-12 | 7 |
| 2021-04-16 | 7 | |
| 2021-04-18 | 7 | |
| 2021-09-04 | 8 | |
| 2021-09-07 | 7 |
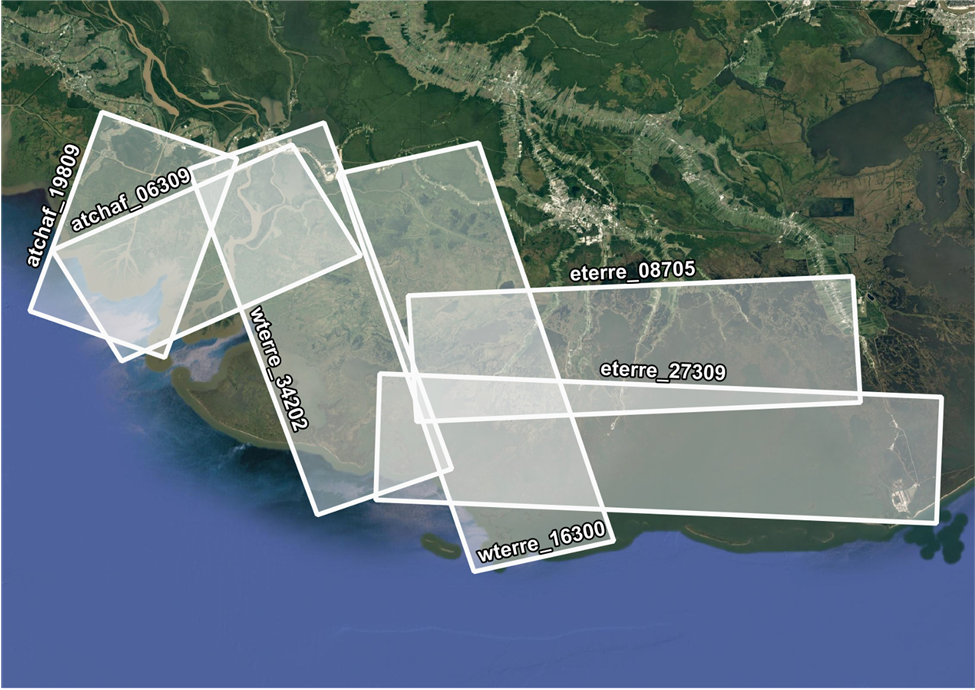
Figure 3. Spatial coverage of each UAVSAR flight line acquired during the Delta-X campaign. Map shows the Atchafalaya and Terrebonne Basins along the southern coast of Louisiana, USA.
Data Access
These data are available through the Oak Ridge National Laboratory (ORNL) Distributed Active Archive Center (DAAC).
Delta-X: UAVSAR L1 Single Look Complex (SLC) Stack Products, MRD, Louisiana, 2021
Contact for Data Center Access Information:
- E-mail: uso@daac.ornl.gov
- Telephone: +1 (865) 241-3952
References
Hensley, S., H. Zebker, C. Jones, T. Michel, R. Muellerschoen, and B. Chapman. 2009. First deformation results using the NASA/JPL UAVSAR instrument. 2009 2nd Asian-Pacific Conference on Synthetic Aperture Radar. https://doi.org/10.1109/APSAR.2009.5374246
Jensen, D., K.C. Cavanaugh, M. Simard, G.S. Okin, E. Castañeda-Moya, A. McCall, and R. R. Twilley. 2019. Integrating imaging spectrometer and synthetic aperture radar data for estimating wetland vegetation aboveground biomass in coastal Louisiana. Remote Sensing 11:2533. https://doi.org/10.3390/rs11212533
Jones, C., T. Oliver-Cabrera, M. Simard, and Y. Lou. 2022a. Delta-X: UAVSAR L1B Interferometric Products, MRD, Louisiana, 2021. ORNL DAAC, Oak Ridge, Tennessee, USA. https://doi.org/10.3334/ORNLDAAC/1979
Jones, C., T. Oliver-Cabrera, M. Simard, and Y. Lou. 2022b. Delta-X: UAVSAR Level 2 Geocoded Interferometric Products, LA, USA, 2021. ORNL DAAC, Oak Ridge, Tennessee, USA. https://doi.org/10.3334/ORNLDAAC/2057
Jones, C., T. Oliver-Cabrera, M. Simard, and Y. Lou. 2022c. Delta-X: UAVSAR Level 3 Geocoded InSAR Derived Water Level Changes, LA,USA, 2021. ORNL DAAC, Oak Ridge, Tennessee, USA. https://doi.org/10.3334/ORNLDAAC/2058
Lin, V., B. Strovers, J. Lee, and R. Beck. 2008. Platform Precision Autopilot overview and flight test results. Paper presented at 2008 AIAA Guidance, Navigation, and Control Conference, Honolulu, HI. https://ntrs.nasa.gov/api/citations/20080033977/downloads/20080033977.pdf https://doi.org/10.2514/6.2008-6461
Oliver-Cabrera, T., C.E. Jones, Z. Yunjun, and M. Simard. 2021. InSAR phase unwrapping error correction for rapid repeat measurements of water level change in wetlands. IEEE Transactions on Geoscience and Remote Sensing:1–15. https://doi.org/10.1109/TGRS.2021.3108751
Dataset Revisions
| Version | Release Date | Revision Notes |
| 1.1 | 2022-06-22 | Fall 2021 data appended to dataset; no changes to Spring 2021 data. User guide updated. |
| 1.0 | 2022-04-21 | Original release with Spring 2021 data. |