Documentation Revision Date: 2022-05-02
Dataset Version: 1
Summary
This campaign conducted both airborne (remote sensing) and field (in situ) measurements to measure hydrology, water quality, and vegetation structure. These data serve to better understand rates of soil erosion, accretion, and creation in the delta system, with the goal of building better models of how river deltas will behave under relative sea level rise.
This dataset includes 600 files in ENVI binary image format. Each file is a ZIP (*.zip) archive that includes the binary image file with an associated ENVI plain text header (*.hdr) file.
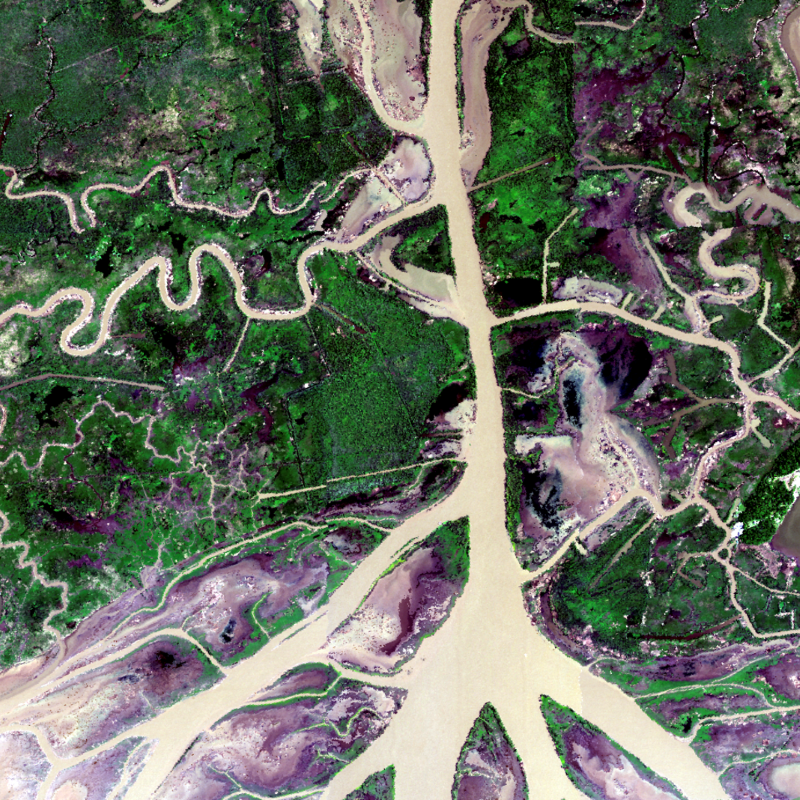
Figure 1. True-color image of the AVIRIS-NG data collected over the Atchafalaya Basin in Spring 2021. Source: authors.
Citation
Thompson, D.R., D.J. Jensen, J. Chapman, E. Greenberg, and M. Simard. 2022. Delta-X: AVIRIS-NG L1B Spectral Radiance Products, MRD, Louisiana, 2021. ORNL DAAC, Oak Ridge, Tennessee, USA. https://doi.org/10.3334/ORNLDAAC/1987
Table of Contents
- Dataset Overview
- Data Characteristics
- Application and Derivation
- Quality Assessment
- Data Acquisition, Materials, and Methods
- Data Access
- References
Dataset Overview
This dataset provides Level 1B (L1B) radiance products from NASA's Airborne Visible Infrared Imaging Spectrometer- Next Generation (AVIRIS-NG) instrument acquired over the Atchafalaya and Terrebonne basins of the Mississippi River Delta, Louisiana, USA during two deployments; spring and fall of 2021. All flights were flown on a Dynamic Aviation King Air B200. There are a combined 200 total flight lines for the spring and fall 2021 deployments; spring 2021 had 75 flight lines, fall 2021 had 175 flight lines. AVIRIS-NG measures reflected radiance at 5-nanometer (nm) intervals in the visible to shortwave infrared spectral range between 380 and 2510 nm. Level 1B data are orthorectified calibrated radiance values in units of spectral radiance in which raw digital numbers (DNs) are translated to units of radiant intensity measured at the sensor. Measurements are radiometrically and geometrically calibrated and provided at approximately 5-meter spatial resolution, dependent on aircraft altitude. Additional flight line files include band information of observational geometry and illumination parameters, as well as geographic pixel locations and elevation. These L1B data are provided in ENVI file format. AVIRIS-NG Cal/Val, Level 2 and Level 3 products for the Pre-Delta-X and Delta-X missions are provided in related datasets.
This campaign conducted both airborne (remote sensing) and field (in situ) measurements to measure hydrology, water quality, and vegetation structure. These data serve to better understand rates of soil erosion, accretion, and creation in the delta system, with the goal of building better models of how river deltas will behave under relative sea level rise.
Project: Delta-X
The Delta-X mission is a 5-year NASA Earth Venture Suborbital-3 mission to study the Mississippi River Delta in the United States, which is growing and sinking in different areas. River deltas and their wetlands are drowning as a result of sea level rise and reduced sediment inputs. The Delta-X mission will determine which parts will survive and continue to grow, and which parts will be lost. Delta-X begins with airborne and in situ data acquisition and carries through data analysis, model integration, and validation to predict the extent and spatial patterns of future deltaic land loss or gain.
Related Publications
Chapman, J.W., D.R. Thompson, M.C. Helmlinger, B.D. Bue, R.O. Green, M.L. Eastwood, S. Geier, W. Olson-Duvall, and S.R. Lundeen. 2019. Spectral and radiometric calibration of the Next Generation Airborne Visible Infrared Spectrometer (AVIRIS-NG). Remote Sensing 11:2129. https://doi.org/10.3390/rs11182129
Jensen, D., K.C. Cavanaugh, M. Simard, G.S. Okin, E. Castañeda-Moya, A. McCall, and R. R. Twilley. 2019. Integrating imaging spectrometer and synthetic aperture radar data for estimating wetland vegetation aboveground biomass in coastal Louisiana. Remote Sensing 11:2533. https://doi.org/10.3390/rs11212533
Related Datasets
In situ - Cal/Val
Castaneda, E., A.I. Christensen, M. Simard, A. Bevington, R. Twilley, and A. Mccall. 2020. Pre-Delta-X: Vegetation Species, Structure, Aboveground Biomass, MRD, LA, USA, 2015. ORNL DAAC, Oak Ridge, Tennessee, USA. https://doi.org/10.3334/ORNLDAAC/1805
Jensen, D.J., M. Simard, C.G. Fichot, and T.M. Pavelsky. 2021. Pre-Delta-X: AVIRIS-derived Total Suspended Solids Maps for MRD, LA, USA, 2015-2016. ORNL DAAC, Oak Ridge, Tennessee, USA. https://doi.org/10.3334/ORNLDAAC/1822
Jensen, D.J., D.R. Thompson, I.B. Mccubbin, and M. Simard. 2021. Pre-Delta-X: L2 AVIRIS-NG Surface Spectral Reflectance across MRD, LA, USA, 2015-2016. ORNL DAAC, Oak Ridge, Tennessee, USA. https://doi.org/10.3334/ORNLDAAC/1826
Fichot, C.G., N. Ghosh, J. Harringmeyer, and M. Weiser. 2021. Delta-X: Total Suspended Solids Concentration across MRD, LA, USA, 2021. ORNL DAAC, Oak Ridge, Tennessee, USA. https://doi.org/10.3334/ORNLDAAC/1991
Fichot, C.G., J. Harringmeyer, and M. Weiser. 2021. Delta-X: In Situ Water Quality Indicators across MRD, LA, USA, 2021. ORNL DAAC, Oak Ridge, Tennessee, USA. https://doi.org/10.3334/ORNLDAAC/1992
Fichot, C.G., and J. Harringmeyer. 2021. Delta-X: Remote Sensing Reflectance Measurements across MRD, LA, USA, 2021. ORNL DAAC, Oak Ridge, Tennessee, USA. https://doi.org/10.3334/ORNLDAAC/1994
Fichot, C.G., and J. Harringmeyer. 2021. Delta-X: In situ Beam Attenuation and Particle Size from LISST-200X, Spring 2021. ORNL DAAC, Oak Ridge, Tennessee, USA. https://doi.org/10.3334/ORNLDAAC/2001
L2
Jensen, D.J., D.R. Thompson, I.B. Mccubbin, and M. Simard. 2021. Pre-Delta-X: L2 AVIRIS-NG Surface Spectral Reflectance across MRD, LA, USA, 2015-2016. ORNL DAAC, Oak Ridge, Tennessee, USA. https://doi.org/10.3334/ORNLDAAC/1826
Thompson, D.R., D.J. Jensen, J. Chapman, E. Greenberg, and M. Simard. 2021. Delta-X AVIRIS-NG L2 Surface Reflectance Products across the MRD, LA, USA, 2021. ORNL DAAC, Oak Ridge, Tennessee, USA. https://doi.org/10.3334/ORNLDAAC/1988
L3
Jensen, D.J., M. Simard, R. Twilley, E. Castaneda, and A. McCall. 2021. Pre-Delta-X: Aboveground Biomass and Vegetation Maps, Wax Lake Delta, LA, USA, 2016. ORNL DAAC, Oak Ridge, Tennessee, USA. https://doi.org/10.3334/ORNLDAAC/1821
Jensen, D.J., M. Simard, C.G. Fichot, and T.M. Pavelsky. 2021. Pre-Delta-X: AVIRIS-derived Total Suspended Solids Maps for MRD, LA, USA, 2015-2016. ORNL DAAC, Oak Ridge, Tennessee, USA. https://doi.org/10.3334/ORNLDAAC/1822
Acknowledgments
This work was supported by NASA's Earth Venture Suborbital-3 (EVS-3) program (grant NNH17ZDA001N-EVS3) and carried out at the Jet Propulsion Laboratory, California Institute of Technology, under a contract with NASA (80NM0018D0004).
Data Characteristics
Spatial Coverage: Atchafalaya and Terrebone Basins, southern coast of Louisiana, USA
Spatial Resolution: Flight line spatial resolutions range from 3.8 m to 5.4 m, depending on aircraft altitude
Temporal Coverage: 2021-03-27 to 2021-09-25
Temporal Resolution: Each acquisition is a “flight line” forming a continuous strip of push broom data. Multiple aircraft overflights cover the region of interest, accumulating a combined map of the target area.
Site Boundaries: Latitude and longitude are given in decimal degrees.
| Site | Westernmost Longitude | Easternmost Longitude | Northernmost Latitude | Southernmost Latitude |
|---|---|---|---|---|
| Atchafalaya and Terrebonne Basins | -91.5870 | -89.6796 | 29.8483 | 28.0617 |
Data File Information
There are 600 datafiles in ENVI format: 200 L1B radiance files, 200 geometry and illumination files, and 200 pixel location files (125 orthorectified, 75 not orthorectified). Each file consists of a binary data file with no extension plus an ENVI metadata header file (*.hdr). The data file and its associated header are provided in a zip archive (*.zip). The ENVI header files (*.hdr) contain the name of the products, the data format, number of bands, along with the number of samples and lines in the raster. The no data value is -9999.
Geolocation information, when available, follows the ENVI metadata file convention; the “map info” header field specifies a reference point, pixel size, and rotation angle to georectify the image.
AVIRIS-NG File Naming Convention
Each flight line uses a specific datetime code filename prefix: ang<YYLLDDHHMM>t<hhmmss>, where
- <YYLLDDHHMM> = date of acquisition (UTC); YY = year - last two digits, LL = month, DD = day of month, HH = hour, MM = minute
- <hhmmss> = start time of acquisition (UTC); hh = hour, mm = minute, and ss = second
L1B Radiance Files
Naming convention: ang<YYLLDDHHMM>t<hhmmss>_rdn_<product>.zip where:
<product> =
img: Calibrated radiance data: angYYYYMMDDtHHNNSS_rdn_img (& .hdr)
Files have 425 bands. Each band represents a different wavelength; wavelength centers and Full Width at Half Maximum (FWHM) values are embedded in the header. Files are stored in little-endian single-precision floating point format (Float32) in Band Interleaved by Line (BIL) interleave.
loc: Pixel location file: angYYYYMMDDtHHNNSS_rdn_loc (& .hdr)
Files have three bands that contains longitude, latitude (WGS-84 datum), and elevation in meters for every pixel. Files are stored in little-endian double-precision floating point format (Float64), with Band Interleaved by Pixel (BIP) interleave.
loc_ort: Orthorectified Pixel location file: angYYYYMMDDtHHNNSS_rdn_loc_ort (& .hdr)
Same as loc product, but files are orthorectified
obs_ort: Orthocorrected observation parameters: angYYYYMMDDtHHNNSS_rdn_obs_ort (& .hdr)
Files have 11 bands that contain metadata information for every pixel (Table 1). Files are stored in little-endian double-precision floating point format (Float64) with Band Interleaved by Pixel (BIP) interleave.
Calibration Version: Radiance spectra calibrated by the JPL AVIRIS-NG Science Team with the calibration version = v2z1.
Table 1. File types and variables.
| File type | Variables | Units |
|---|---|---|
| Measured radiance (*img) | Radiance at sensor (425 channels) |
µW nm-1 cm-2 sr-1 |
| Observation location (*loc and *loc_ort) | Pixel longitude | degree_east |
| Pixel latitude | degree_north | |
| Pixel elevation | m | |
| Observation metadata (*obs_ort) | Path length | m |
| To-sensor azimuth | 0-360 clockwise from north | |
| To-sensor zenith | 0-90 degrees from zenith | |
| To-sun azimuth | 0-360 clockwise from north | |
| To-sun zenith | 0-90 degrees from zenith | |
| Solar phase | 1 | |
| Slope | degrees, from digital elevation model | |
| Aspect | 0-360 clockwise from north | |
| Cosine(i) | solar incidence angle onto surface in degrees | |
| UTC Time | hour | |
| Earth-sun distance | AU |
Application and Derivation
Delta-X was a joint airborne and field campaign in the Mississippi River Delta. This campaign conducted both airborne (remote sensing) and field (in situ) measurements to measure hydrology, water quality (e.g., total suspended solids (TSS)), and vegetation structure. These data serve to better understand rates of soil erosion, accretion, and creation in the delta system, with the goal of building better models of how river deltas will behave under relative sea level rise.
Surface radiance and reflectance spectra are commonly used to measure properties of the surface composition. They can indicate water column constituents, soil composition, vegetation functional traits, and more. For a more complete description of the imaging spectroscopy measurement and its applications to different Earth science disciplines, see a recent survey by Cawse-Nicholson et al. (2021).
Quality Assessment
Data quality was monitored at several steps during acquisition and analysis. First, operators performed a preliminary assessment using a real-time display in the cabin and assessed images and spectra in a scrolling “waterfall” plot. This plot allowed identification of impinging clouds, instrument artifacts, or other issues that would require adjustment or (in the worst case) immediate reacquisition. Second, representative spectra were used to assess the performance of science data algorithms at each stage. These spectra could be matched to in-situ reference data in order to validate calibration as well as uncertainty predictions, following procedures outlined in Thompson et. al. (2018b, 2018c). An example of the in situ-remote comparison, using coincident field data appears in Figure 2 below (personal communication, Cédric Fichot and Joshua Harringmeyer). The errors here, which are on the order of 1-2%, are typical of this algorithmic approach.
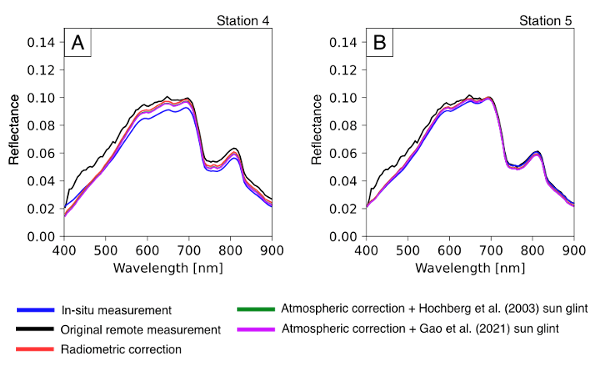
Figure 2. Reflectance and radiance validation, adapted from Greenberg et al. (2021). The plots show water-leaving reflectance values from two locations within a Delta-X flight line. Remote observations (black) compare favorably to the in situ measurements (blue). Vicarious radiometric corrections used for Level 2 enable an even closer match (red). Green and purple lines show two alternative glint correction strategies; the Gao and Li (2021) approach (purple) was used to produce the Delta-X Level 2 products.
In general, the campaign data from spring 2021 have superior surface reflectance estimation due to the better atmospheric conditions encountered during those flights. Fall 2021 overflights encountered higher atmospheric haze and water vapor loadings, with a larger number of clouds. Bad data flags (-9999) were embedded in the spectroscopic data. These flags serve mainly to mark the periphery of an orthorectified image where no spectra were acquired. Clouds and other valid but unusable regions were still considered bona fide scene content and not altered. However, for surface studies, authors recommend ignoring a large margin of data (1 km or more) around any visible clouds, to avoid their disruption to the downwelling incident light field and corresponding increase in atmospheric correction error.
Data Acquisition, Materials, and Methods
NASA’s Airborne Visible Infrared Imaging Spectrometer - Next Generation (AVIRIS-NG) is a push broom spectral mapping system with a high signal-to-noise ratio designed for high performance spectroscopy. AVIRIS-NG was developed as a successor to the Classic Airborne Visible Infrared Imaging Spectrometer (AVIRIS-C) (Green et al., 1998). The instrument covers the entire solar reflected spectrum from 380-2510 nm with a single Focal Plane Array (FPA), at a spectral sampling of approximately 5 nm. The AVIRIS-NG sensor has a 1 milliradian instantaneous field of view, providing altitude-dependent ground sampling distance ranging from sub-meter to 20 m scales. Its detector has a 640×480-pixel array, from which standard products are generated using the sensor’s 600 cross-track spatial samples and 425 spectral samples. Each acquisition is a “flight line” forming a continuous strip of push broom data that typically takes 1-10 minutes to acquire. Multiple aircraft overflights cover the region of interest in these strips, accumulating a combined map of the target area. For this campaign, AVIRIS-NG was implemented on a Dynamic Aviation King Air B200. The instrument has four components: 1) a sensor with its mount and camera glass mounted at a nadir port; 2) an onboard calibrator (OBC), mounted in the cabin next to the sensor; 3) a forward operator electronics rack, and 4) an aft thermal-control electronics rack.
During spring and fall 2021, AVIRIS-NG acquired data in its standard operating mode over regions of interest in the Atchafalaya and Terrebonne basins of Mississippi River Delta in coastal Louisiana, USA. The area was provisionally split into multiple mosaics-a large “survey” covering the entire domain, which required multiple days to accomplish (Figure 3). Planned flight lines had a 15% overlap area at their margins to accommodate position and geometric sampling uncertainty. The precise direction of flight lines was adjusted to accommodate local time and weather conditions and to ameliorate sun glint effects. Because AVIRIS-NG’s data collection was impeded when clouds are present below or above the aircraft, the team typically decided which days to fly based on an early morning “go/no-go” decision from the daily weather forecast.
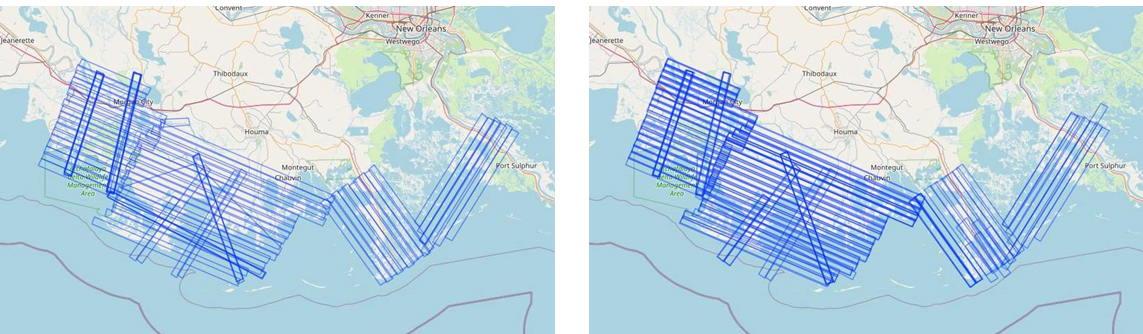
Figure 3. AVIRIS-NG flight lines for Spring, n=75 (left) and Fall, n=125 (right), 2021 showing multiple aircraft overflights required to cover the Delta-X study area.
The AVIRIS-NG data analysis involves a sequence of successively refined products as show in Figure 4. First, the instrument digital numbers were converted into the L1 product provided in this dataset, which is a measurement of radiance at sensor. Data products were geolocated and projected onto a rectilinear grid with embedded map information. Next, surface and atmospheric properties were estimated to produce the Level 2 product, the Hemispherical-Directional surface reflectance (Schaepman-Strub, 2006). The third step produces the Level 2a product: the BRDF-adjusted surface reflectance with an adjustment for water-sun glint (Gao et al., 2021) and the Bidirectional Reflectance Distribution Function (BRDF) effects of canopy vegetation (Queally et al., 2021). Finally, downstream algorithms use these reflectance data to produce maps of vegetation structure and water quality (Fichot et al., 2015).
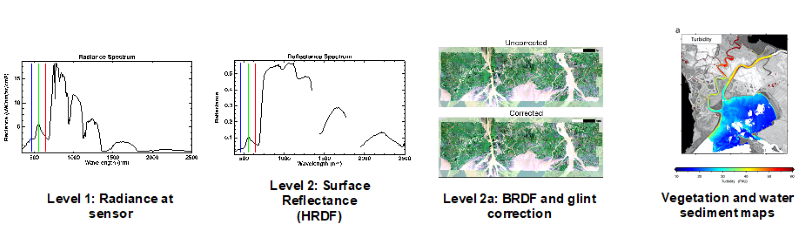
Figure 4. Typical analysis chain, showing the progression from Level 1 (radiance) products to Level 2 (reflectance), Level 2a (sunglint and BRDF correction; image from Greenberg et al., 2021) and Level 3 (vegetation and water property maps; image from Fichot et al., 2015).
The AVIRIS-NG radiance data (Level 1) were derived by calibrating incident radiance spectra measured by the sensor using the techniques described in Thompson et al. (2018a) and Chapman et al. (2019). These radiances were then analyzed to estimate atmospheric state and surface reflectance (Level 2) using the method of Thompson et al. (2018c, 2019). During this stage, a vicarious radiometric correction on the order of 1% is applied which evened out minor discrepancies between the laboratory calibration and flight conditions. This adjustment uses an in situ reference from the Delta-X flight campaign, and a correction procedure detailed in Bruegge et al. (2021). The observed reflectance signal is influenced by the bi-directional reflectance distribution function (BRDF) resulting from variation in solar and instrument viewing angles, manifesting in differences in illumination intensity across various surface cover types within each scene. The BRDF effects were estimated and corrected using the algorithm described in Queally et al. (2021). Only land pixels were corrected in this way; water pixels, which were recognized by a band ratio combination (Greenberg et al., 2021), were instead adjusted to remove specular sun glint using the approach in Gao and Li (2021).
Data Access
These data are available through the Oak Ridge National Laboratory (ORNL) Distributed Active Archive Center (DAAC).
Delta-X: AVIRIS-NG L1B Spectral Radiance Products, MRD, Louisiana, 2021
Contact for Data Center Access Information:
- E-mail: uso@daac.ornl.gov
- Telephone: +1 (865) 241-3952
References
Bruegge, C.J., G.T. Arnold, J. Czapla-Myers, R. Dominguez, M.C. Helmlinger, D.R. Thompson, J.V. den Bosch, and B.N. Wenny. 2021. Vicarious calibration of eMAS, AirMSPI, and AVIRIS sensors during FIREX-AQ. IEEE Transactions on Geoscience and Remote Sensing 59:10286–10297. https://doi.org/10.1109/TGRS.2021.3066997
Cawse-Nicholson, K., P.A. Townsend, D. Schimel, A.M. Assiri, P.L. Blake, M.F. Buongiorno, P. Campbell, N. Carmon, K.A. Casey, R.E. Correa-Pabón, K.M. Dahlin, H. Dashti, P.E. Dennison, H. Dierssen, A. Erickson, J.B. Fisher, R. Frouin, C.K. Gatebe, H. Gholizadeh, M. Gierach, N.F. Glenn, J.A. Goodman, D.M. Griffith, L. Guild, C.R. Hakkenberg, E.J. Hochberg, T.R.H. Holmes, C. Hu, G. Hulley, K.F. Huemmrich, R.M. Kudela, R.F. Kokaly, C.M. Lee, R. Martin, C. Miller, W.J. Moses, F.E. Muller-Karger, J.D. Ortiz, D.B. Otis, N. Pahlevan, T.H. Painter, R. Pavlick, B. Poulter, Y. Qi, V.J. Realmuto, D. Roberts, M.E. Schaepman, F.D. Schneider, F.M. Schwandner, S.P. Serbin, A.N. Shiklomanov, E.N. Stavros, D.R. Thompson, J.L. Torres-Perez, K.R. Turpie, M. Tzortziou, S. Ustin, Q. Yu, Y. Yusup, and Q. Zhang. 2021. NASA’s surface biology and geology designated observable: A perspective on surface imaging algorithms. Remote Sensing of Environment 257:112349. https://doi.org/10.1016/j.rse.2021.112349
Chapman, J.W., D.R. Thompson, M.C. Helmlinger, B.D. Bue, R.O. Green, M.L. Eastwood, S. Geier, W. Olson-Duvall, and S.R. Lundeen. 2019. Spectral and radiometric calibration of the Next Generation Airborne Visible Infrared Spectrometer (AVIRIS-NG). Remote Sensing 11:2129. https://doi.org/10.3390/rs11182129
Fichot, C.G., B.D. Downing, B.A. Bergamaschi, L. Windham-Myers, M. Marvin-DiPasquale, D.R. Thompson, and M.M. Gierach. 2015. High-resolution remote sensing of water quality in the San Francisco Bay–Delta Estuary. Environmental Science & Technology 50:573–583. https://doi.org/10.1021/acs.est.5b03518
Gao, B.-C., and R.-R. Li. 2021. Correction of sunglint effects in high spatial resolution hyperspectral imagery Using SWIR or NIR bands and taking account of spectral variation of refractive index of water. Advances in Environmental and Engineering Research 2:16. https://doi.org/10.21926/aeer.2103017
Green, R.O., M.L. Eastwood, C.M. Sarture, T.G. Chrien, M. Aronsson, B.J. Chippendale, J.A. Faust, B.E. Pavri, C.J. Chovit, M. Solis, M.R. Olah, and O. Williams. 1998. Imaging spectroscopy and the Airborne Visible/Infrared Imaging Spectrometer (AVIRIS). Remote Sensing of Environment 65:227–248. https://doi.org/10.1016/S0034-4257(98)00064-9
Greenberg, E. B., D. R. Thompson, D. J. Jensen, P. A.Townsend, N. Queally, A. Chlus, C.G. Fichot, and J. Harringmeyer. 2021. Measuring remote spectral surface reflectance across the land/water Interface. Manuscript in review.
Hochberg, E.J., S. Andrefouet, and M.R. Tyler. 2003. Sea surface correction of high spatial resolution ikonos images to improve bottom mapping in near-shore environments. IEEE Transactions on Geoscience and Remote Sensing 41:1724–1729. https://doi.org/10.1109/TGRS.2003.815408
Queally, N., Z. Ye, T. Zheng, A. Chlus, F. Schneider, R. Pavlick, and P.A. Townsend. 2021. FlexBRDF: A flexible BRDF correction for grouped processing of airborne imaging spectroscopy flightlines. Earth and Space Science Open Archive. Submitted preprint. https://doi.org/10.1002/essoar.10506891.1
Thompson, D.R., J.W. Boardman, M.L. Eastwood, R.O. Green, J.M. Haag, P. Mouroulis, and B. Van Gorp. 2018a. Imaging spectrometer stray spectral response: In-flight characterization, correction, and validation. Remote Sensing of Environment 204:850–860. https://doi.org/10.1016/j.rse.2017.09.015
Thompson, D.R., K. Cawse-Nicholson, Z. Erickson, C.G. Fichot, C. Frankenberg, B.-C. Gao, M.M. Gierach, R.O. Green, D. Jensen, V. Natraj, and A. Thompson. 2019. A unified approach to estimate land and water reflectances with uncertainties for coastal imaging spectroscopy. Remote Sensing of Environment 231:111198. https://doi.org/10.1016/j.rse.2019.05.017
Thompson, D.R., L. Guanter, A. Berk, B.-C. Gao, R. Richter, D. Schläpfer, and K.J. Thome. 2018b. Retrieval of atmospheric parameters and surface reflectance from visible and shortwave infrared imaging spectroscopy data. Surveys in Geophysics 40:333–360. https://doi.org/10.1007/s10712-018-9488-9
Thompson, D.R., V. Natraj, R.O. Green, M.C. Helmlinger, B.-C. Gao, and M.L. Eastwood. 2018c. Optimal estimation for imaging spectrometer atmospheric correction. Remote Sensing of Environment 216:355–373. https://doi.org/10.1016/j.rse.2018.07.003