Documentation Revision Date: 2022-09-22
Dataset Version: 2
Summary
There are two data files in comma separated values (CSV) format.
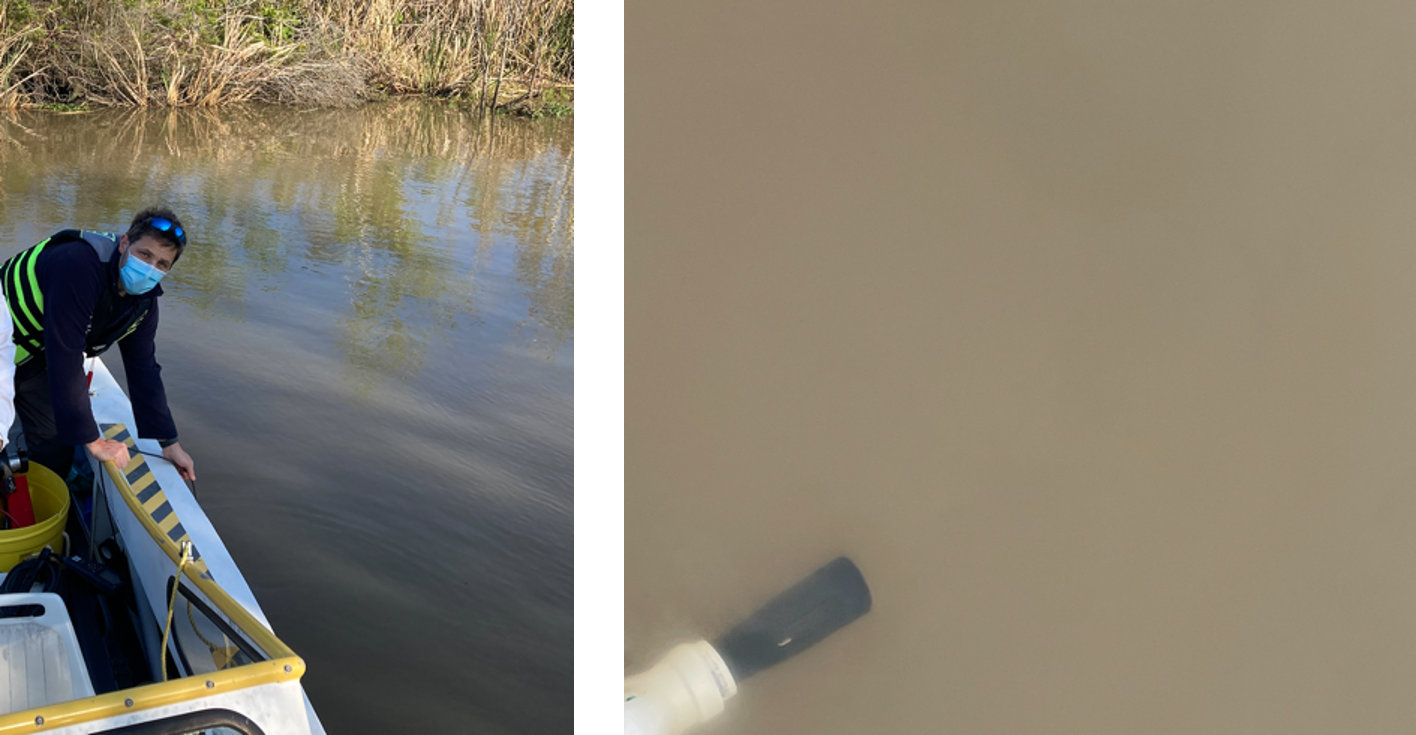
Figure 1: ProDSS probe being deployed by hand off the side of the boat (left), and picture of the probe submerged in the turbid waters of the study area (right).
Citation
Fichot, C.G., J. Harringmeyer, and M. Weiser. 2022. Delta-X: In Situ Water Quality Indicators across MRD, LA, USA, 2021, Version 2. ORNL DAAC, Oak Ridge, Tennessee, USA. https://doi.org/10.3334/ORNLDAAC/2080
Table of Contents
- Dataset Overview
- Data Characteristics
- Application and Derivation
- Quality Assessment
- Data Acquisition, Materials, and Methods
- Data Access
- References
- Dataset Revisions
Dataset Overview
This dataset provides in situ measurements of water temperature (degrees C), salinity (PSU), turbidity (FNU), and chlorophyll-a fluorescence (RFU) in surface of the Atchafalaya River and Terrebonne Basins during the Spring (2021-03-25 to 2021-04-22) and Fall 2021-08-14 to 2021-09-24) field efforts by the Delta-X project. Field sampling was paused on August 25 and resumed on September 13, 2021, due to the landfall of Hurricane Ida on 2021-08-26 approximately 70 km east of the study site. Water quality changes caused by the hurricane were expected to be minimal. Measurements were collected in multiple channels of varying width (from a few meters to >100 m), near Delta-X intensive study sites, in open bays and lakes, and at a few locations in the nearshore Gulf of Mexico using either a YSI ProDSS water quality probe or a YSI EXO3 water quality probe.
Project: Delta-X
The Delta-X mission is a 5-year NASA Earth Venture Suborbital-3 mission to study the Mississippi River Delta in the United States, which is growing and sinking in different areas. River deltas and their wetlands are drowning as a result of sea level rise and reduced sediment inputs. The Delta-X mission will determine which parts will survive and continue to grow, and which parts will be lost. Delta-X begins with airborne and in situ data acquisition and carries through data analysis, model integration, and validation to predict the extent and spatial patterns of future deltaic land loss or gain.
Acknowledgement
This study was funded by the NASA Earth Venture Suborbital-3 Program, grant number NNH17ZDA001N-EVS3.
Data Characteristics
Spatial Coverage: Atchafalaya and Terrebonne Basins, Mississippi River Delta (MRD) floodplain, southern coast of Louisiana, USA
Spatial Resolution: Points
Temporal Coverage: 2021-03-25 to 2021-04-22 (Spring) and 2021-08-14 to 2021-09-24 (Fall)
Temporal Resolution: One-time measurement
Site Boundaries: Latitude and longitude are given in decimal degrees.
| Site | Westernmost Longitude | Easternmost Longitude | Northernmost Latitude | Southernmost Latitude |
|---|---|---|---|---|
| Atchafalaya and Terrebonne Basins | -91.4676 | -90.5696 | 29.7546 | 28.7913 |
Data File Information
This dataset contains two files in comma-separated values (.csv) format: DeltaX_WQ_Indicators_Spring2021.csv and DeltaX_WQ_Indicators_Fall2021.csv.
Missing data are indicated by the no_data value -9999.
Table 1. Data dictionary for DeltaX_WQ_Indicators_Spring2021.csv and DeltaX_WQ_Indicators_Fall2021.csv.
|
Variable |
Unit |
Description |
|---|---|---|
|
basin |
|
Basin name: “Atchafalaya” or “Terrebonne” |
|
site_id |
|
Site identifier with format <basin>_<mmdd>_<station type><station number>, where mm = month and dd = day. See Table 2 for basin and station type abbreviations |
|
campaign |
|
Field campaign: "Spring 2021" or "Fall 2021" |
|
latitude |
degrees north |
Latitude of sampling location |
|
longitude |
degrees east |
Longitude of sampling location |
|
date |
YYYY-MM-DD |
Date of sampling and measurement |
|
time |
HH:MM:SS |
UTC time of sampling |
|
depth |
meters |
Depth of sampling |
|
turbidity |
1 |
Mean turbidity in Formazin Nephelometric Units (FNU) |
|
SD_turbidity |
1 |
Standard deviation of turbidity in FNU |
|
salinity |
g kg-1 |
Mean salinity in Practical Salinity Unit (PSU) |
|
SD_salinity |
g kg-1 |
Standard deviation of salinity in PSU |
|
temperature |
degrees C |
Mean temperature in Celsius |
|
SD_temperature |
degrees C |
Standard deviation of temperature in Celsius |
|
chlorophyll_a_fluorescence |
RFU |
Mean chlorophyll-a fluorescence in relative fluorescence units (RFU) |
|
SD_chlorophyll_a_fluorescence |
RFU |
Standard deviation of chlorophyll-a fluorescence in RFU |
Table 2. Abbreviations encoded in site_id variable.
| Abbreviation | Description |
|---|---|
| Basin names | |
| WLD | Atchafalaya Basin (including Wax Lake Delta) |
| TB | Terrebonne Basin |
| Type of sampling station | |
| S | Full station: Water samples for total suspended solids (TSS) and Particulate Organic Carbon (POC) were collected along with water reflectance, measurements from the Sequoia Scientific® LISST-200X instrument (LISST), and water-quality indicators from ProDSS probe. |
| D | Dry stations: No water samples for TSS were collected. Measurements of water reflectance, from the LISST, and water-quality indicators from ProDSS probe were collected. |
| B | Basic station: Only measurements of LISST, and water-quality indicators from ProDSS probe were collected. |
Application and Derivation
During the Delta-X project, in situ measurements of water temperature, salinity, turbidity, and chlorophyll-a fluorescence in surface waters were collected at a number of sites across the Atchafalaya and Terrebonne basins. These sampling sites spanned large and small channels at locations chosen to cover a representative range of suspended solids concentration from a variety of hydrodynamic and physical settings typically encountered across the Atchafalaya and Terrebonne basins.
These water quality measurements represent discrete measurements and are paired with other measurements of in situ water-quality indicators, beam attenuation coefficient at 670 nm, average suspended particle size, suspended particle size distributions, and in situ and airborne water reflectance (all provided as separate datasets). These location- and time-specific measurements are compared to numerical models to calibrate and validate its parameters. The models quantify the mesoscale (i.e., on the order of 1 ha) patterns of soil accretion that control land loss and gain and predict the resilience of deltaic floodplains under projected relative sea-level rise. Understanding and mitigating the impact of the relative sea-level rise on coastal deltas is urgent. If ignored, relative sea-level rise will very soon have devastating consequences on the livelihood of the half-billion people that live in these low-lying coastal regions.
Quality Assessment
The ProDSS and EXO3 were calibrated for conductivity at the beginning of the campaign and for turbidity every two weeks using the calibration solution recommended and sold by YSI®. The turbidity was calibrated using Milli-Q water (for 0 FNU) and a formazin solution of 124 FNU recommended by YSI, which bracketed the range of turbidity observed in the study area. The chlorophyll-a fluorescence provided here was only calibrated with Milli-Q water in order to zero the instrument. The instrument was pressure-tared on the boat deck before deployment. The instrument was lowered from the side of the boat and the data was collected at the surface for about two minutes at a rate of 1 Hz. The data from the two-minute recording was averaged and a standard deviation of the measurements was calculated.
Data Acquisition, Materials, and Methods
Water quality indicators were measured in surface waters at locations across the Atchafalaya and Terrebonne Basins, portions of the Mississippi River Delta in coastal Louisiana. These locations represent a variety of hydrodynamic conditions within this wetland ecosystem (Figure 2). Sample collection occurred during the Spring (2021-03-25 to 2021-04-22) and Fall (2021-08-14 to 2021-09-24) field efforts by the Delta-X project. Field sampling was paused on August 25 and resumed on September 13, 2021, due to the landfall of Hurricane Ida on 2021-08-26 approximately 70 km east of the study site. Water quality changes caused by the hurricane were expected to have minimal effects on these water quality indicators.
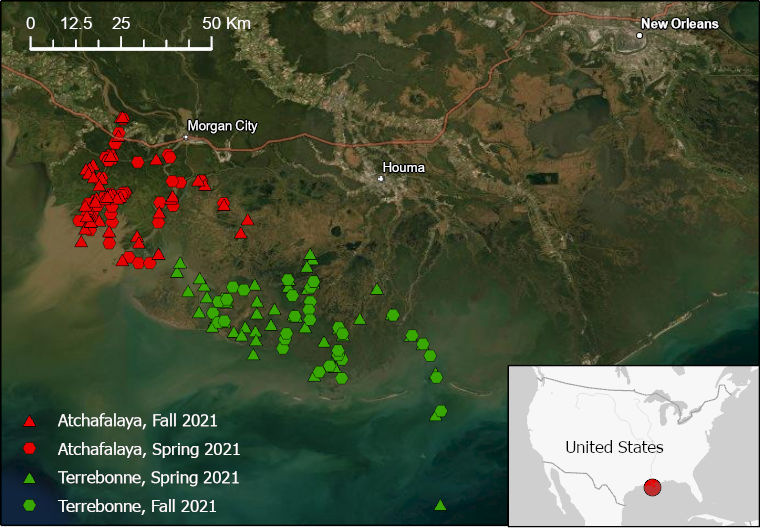
Figure 2: Delta-X 2021 sampling sites for water quality studies labeled by basin and field season.
Sampling Procedure
Each in situ measurement was collected directly by lowering either the YSI® ProDSS water-quality probe (2021-03-25 to 2021-08-14) or the YSI® EXO3 water quality probe (2021-09-13 to 2021-09-24) from the side of the boat and keeping it submerged at about 0.5 m beneath the surface (Figure 1). Measurements were collected at a rate of 1 Hz for a duration of about two minutes before retrieving the instrument. Data from the water-quality probe were then retrieved and exported as individual casts using the commercial YSI® software. Each data collection was processed in MATLAB® to generate the products of interest: water temperature (degrees C), salinity (PSU), turbidity (FNU), chorophyll-a fluorescence (RFU). In the processing, the measurements collected at the surface for about two minutes were averaged and the standard deviation was calculated. Both the ProDSS and the EXO3 probes were calibrated with the same turbidity standard.
Due to technical issues with the ProDSS instrument on 2021-08-23, salinity and turbidity measurements from 2021-08-23 to 2021-08-25 were measured by pouring bottled field samples into the test chamber of the EXO3 on 2021-08-25. The test chamber was fully rinsed with doubly deionized water between measurements.
Data Access
These data are available through the Oak Ridge National Laboratory (ORNL) Distributed Active Archive Center (DAAC).
Delta-X: In Situ Water Quality Indicators across MRD, LA, USA, 2021, Version 2
Contact for Data Center Access Information:
- E-mail: uso@daac.ornl.gov
- Telephone: +1 (865) 241-3952
References
None provided.
Dataset Revisions
| Version | Release Date | Revision Notes |
| 2.0 | 2022-09-22 | Data from Fall 2021 were added. Spring 2021 data were reprocessed and updated. Title was revised. |
| 1.0 | 2022-05-02 | Original release with Spring 2021 data |