Documentation Revision Date: 2025-02-10
Dataset Version: 1
Summary
There are 104 data files in this dataset: 49 files in comma-separated values (CSV) format with in situ water level measurements, 49 files with the in situ measurements from raw water level converted to absolute water surface elevation with respect to NAVD88 (GEOID12B) graphed and provided as image files in JPEG format, five water elevation measurements from boat surveys in CSV format, and one summary file of water level measurements and metadata for the 65 sites in CSV format.
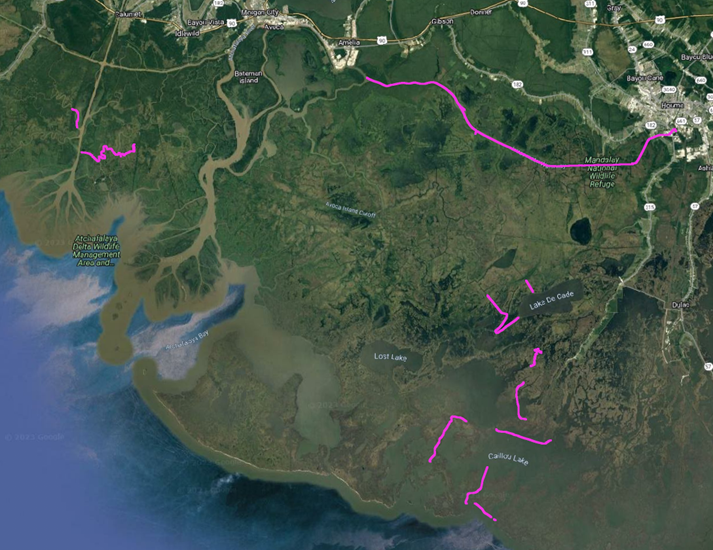
Figure 1. The 65 water level gauge locations in the Atchafalaya and Terrebonne basins, shown as dots where the color indicates the flag.
Citation
Christensen, A.L., J.M. Mallard, M. Simard, T.M. Pavelsky, and A. Rovai. 2025. Delta-X: In-situ Water Surface Elevation, MRD, Louisiana, USA, 2021. ORNL DAAC, Oak Ridge, Tennessee, USA. https://doi.org/10.3334/ORNLDAAC/2086
Table of Contents
- Dataset Overview
- Data Characteristics
- Application and Derivation
- Quality Assessment
- Data Acquisition, Materials, and Methods
- Data Access
- References
- Dataset Revisions
Dataset Overview
This dataset contains in situ water level measurements collected at 49 different locations across the Atchafalaya and Terrebonne basins in the Mississippi River Delta (MRD) floodplain, and 49 files with the in situ measurements from raw water level converted to absolute water surface elevation with respect to NAVD88 (GEOID12B). There were 65 sites included in the study, however, data from 16 of the sites were corrupted, unretrievable from the instrument or the instrument was lost during deployment. Additionally, it contains water surface elevations collected by GNSS mounted to a boat while underway, and a summary file with site information for all 65 sites. Relative water level measurements were recorded every 15-20 minutes using commercial pressure transducers (Levelogger, Solinst) to measure water depth. Water surface elevation was determined by measuring an absolute height conversion at each sensor location using AirSWOT (Denbina et al., 2021) or a survey-grade global navigation satellite system (GNSS).
Project: Delta-X
The Delta-X mission is a 5-year NASA Earth Venture Suborbital-3 mission to study the Mississippi River Delta in the United States, which is growing and sinking in different areas. River deltas and their wetlands are drowning as a result of sea level rise and reduced sediment inputs. The Delta-X mission will determine which parts will survive and continue to grow, and which parts will be lost. Delta-X begins with airborne and in situ data acquisition and carries through data analysis, model integration, and validation to predict the extent and spatial patterns of future deltaic land loss or gain.
Related Datasets
Denbina, M.W., M. Simard, and E. Rodriguez. 2023. Delta-X: AirSWOT L3 Water Surface Elevations, MRD, Louisiana, 2021. ORNL DAAC, Oak Ridge, Tennessee, USA. https://doi.org/10.3334/ORNLDAAC/2133
Denbina, M.W., M. Simard, E. Rodriguez, X. Wu, and C. Michailovsky. 2021. Pre-Delta-X: L2 AirSWOT Water Surface Elevations, Atchafalaya Basin, LA, USA, 2016. ORNL DAAC, Oak Ridge, Tennessee, USA. https://doi.org/10.3334/ORNLDAAC/1818
Acknowledgments
This work was supported by the NASA Earth Venture Suborbital-3 (EVS-3) program (grant NNH17ZDA001N-EVS3) and Jet Propulsion Laboratory's Research and Technology Development.
Data Characteristics
Spatial Coverage: Atchafalaya and Terrebonne Basins, Mississippi River Delta (MRD) floodplain, southern coast of Louisiana, USA
Spatial Resolution: Point
Temporal Coverage: 2021-03-07 to 2021-09-27
Temporal Resolution: 1 second (boat measurements) and 15-20 minutes (site-based measurements)
Site Boundaries: Latitude and longitude are given in decimal degrees
| Site | Westernmost Longitude | Easternmost Longitude | Northernmost Latitude | Southernmost Latitude |
|---|---|---|---|---|
| Atchafalaya and Terrebonne Basins, coastal Louisiana | -91.46977 | -90.25834 | 29.74185 | 29.11453 |
Data file information
This dataset contains 104 data files: 49 files with in situ water level measurements in comma separated values (CSV, *.csv) format, 49 files with the in situ measurements from raw water level converted to absolute water surface elevation with respect to NAVD88 (GEOID12B), graphed and provided as image files in JPEG (*.jpg) format, five water elevation measurements from boat surveys in CSV format, and one summary file of water level measurements in CSV format.
Note: The summary file provides location information for 65 sites; however, for 16 of the instruments, data were corrupted, unretrievable from the instrument, or the instrument was lost during deployment.
Table 1. Data files and descriptions
| File name | Description |
|---|---|
| deltax_water_level_gauges.csv | One summary file with site information for each gauge, for 65 sites |
| deltax_water_level_<Area>_<Site>_site.csv | In situ water level measurements recorded every 15-20 minutes using commercial pressure transducers collected at 49 different locations (49 files). The files are named by <Area> (Atchafalaya, ICWW, or Terrebonne), and <Site> at the area. There are also file names with two sites (<Site_site>) Example file names: deltax_water_level_Terrebonne_CaillouLake.csv deltax_water_level_Terrebonne_CRMS0294_Wetland.csv |
| deltax_water_level_Area_Site_site.jpg | In situ water level measurements converted from raw water level to absolute water surface elevation with respect to NAVD88 (GEOID12B), graphed and provided as image files in JPEG (*.jpg) format. There is one file for each of the 49 csv files above Example file names: deltax_water_level_Terrebonne_CaillouLake.jpg deltax_water_level_Terrebonne_CRMS0294_Wetland.jpg |
| YYYYMMDD_WSE_Boat_Survey.csv | Elevation data from boat surveys (five files) where YYYYMMDD is "20210824" or "20210922" to "20210925". |
Table 2. Variables in the summary file deltax_water_level_gauges.csv
| Variable | Units of measurement | Description | Collected during Pre-Delta-X Campaign? |
|---|---|---|---|
| site_id | - | Name of site where gauge is installed | Yes |
| basin | - | “Atchafalaya” or “Terrebonne” | Yes |
| latitude | degrees north | Water gauge location in decimal degrees | Yes |
| longitude | degrees east | Water gauge location in decimal degrees | Yes |
| logger_type | - | Type of logger used:
|
No |
| flags | - | The flag value indicates the following:
|
No |
| conversion_to_NAVD88 | m | This value should be added to the water level in each gauge time series to convert from RAW water level to absolute water surface elevation with respect to NAVD88 (GEOID12B). These values are derived using AirSWOT observations, GNSS surveys, or Delta-X hydrodynamic models. See flag for more information. -9999 indicates that no conversion value could be derived due to lack of quality AirSWOT or GNSS data. |
No |
| Quality_flags | - | Indicates whether conversions_to_NAVD88 values are “Good” or “Suspect”. -9999 indicates that no conversion is available. Reasons for “Suspect” designation are given in Notes attribute | No |
| notes | - | Information on quality flag designation. | No |
Table 3 . Variables in the files deltax_water_level_Area_Site_site.csv
| Variable | Units of measurement | Description | Collected during Pre-Delta-X Campaign? |
|---|---|---|---|
| date | YYYYMMDD | Date of recording | Yes |
| time | HH:MM:SS | UTC time of recording | Yes |
| raw_water_level | m | The raw water level above the instrument sensor | Yes |
| total_water_depth | m | The height of the water column calculated as raw_water_level plus the distance from the sensor to the sediment bed. This distance was measured during installation | No |
| water_temperature | degrees C | Water temperature | No |
| conductivity | mS cm-1 | Water salinity in millisiemens per cm. -9999 values indicate this instrument did not have a sensor for measuring conductivity. | No |
| water_surface_elevation_NAVD88 | m | The absolute water surface elevation calculated by adding the site-specific conversion_to_NAVD88, see summary csv for details, to the raw water level. -9999 values indicate that the conversion from raw water level to absolute water surface elevation was not possible. |
Yes |
| latitude | degrees north | Site latitude in decimal degrees | |
| longitude | degrees east | Site longitude in decimal degrees |
Table 4. Variables in the files YYYYMMDD_WSE_Boat_Survey.csv
| Variable | Units of measurement | Description |
|---|---|---|
| basin | - | “Atchafalaya” or “Terrebonne” |
| date | YYYYMMDD | Date of recording |
| time | HH:MM:SS | UTC time of recording |
| longitude | degrees east | Latitude of GNSS antenna in decimal degrees |
| latitude | degrees north | Latitude of GNSS antenna in decimal degrees |
| water_surface_elevation | m | Water surface elevation relative to NAVD88 (corrected for height of GNSS antenna above water) |
Application and Derivation
These data were used to calibrate and validate remote sensing observations and hydrodynamic models.
Quality Assessment
The water level gauges recorded relative water level within 1 mm, and the water level gauge data exhibited some small jitters in water level, generally less than 1 cm.
The uncertainty in the conversions derived from AirSWOT and GNSS is expressed as standard deviations in the measurements, which are provided in the notes attribute in the summary CSV.
The final water surface elevation values from the gauges were compared with available conversions to output from the Delta-X ANUGA models (Soloy et al., 2024) and found a RMSE of 0.088 m (Figure 2).
The boat survey data were limited to times when the boat was moving slowly enough such that its speed did not affect the height of the antenna above the water.
The Septentrio PolaRx5 is a high precision, low noise receiver capable of returning 3-5 mm precision in static measurements under ideal conditions.
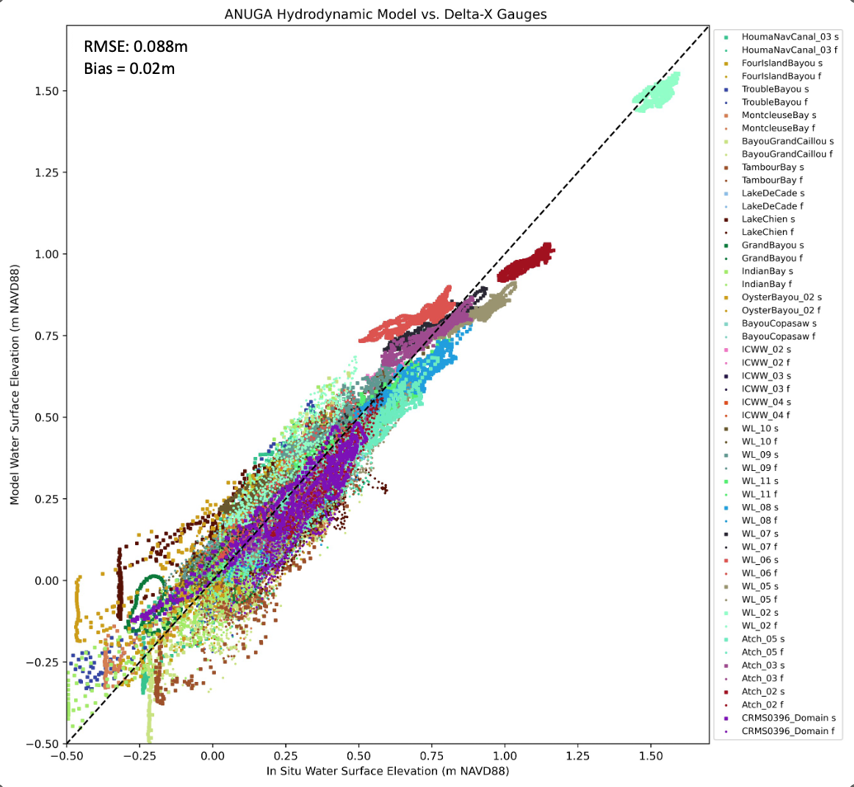
Figure 2. ANUGA hydrodynamic model vs Delta-X gauges.
Data Acquisition, Materials, and Methods
The Delta-X campaign used a commercial water level gauge system from Solinst to measure and continuously log variations in water level throughout the Delta-X domain. Solinst’s water level gauge system measures water surface elevation changes with millimetric accuracy using pressure transducers and has four components: the underwater total pressure transducer or TPT (Levelogger EdgeTM 3001), an atmospheric barometer (BarologgerTM), a data extractor (Data Grabber TM) and analysis software (LeveloggerTM Software Data Compensation Wizard). The TPT combines a pressure sensor, temperature detector, 10-year lithium battery and a datalogger to measure the sum of the atmosphere and water pressure above the sensor. To compensate for atmospheric fluctuations and obtain the height of the water column above the TPT, locally installed barometers, typically secured in a tree above maximum water level, measure and log atmospheric pressure. A single barometer can be used to compensate for all TPT within tens of kilometers. The time tagged TPT and barometer data were transferred with the data extractor device into a tablet or smartphone to be used in the analysis software. The outputs are atmospheric pressure (kPa) and temperature (oC) for the Barologgers, and relative water level (m) and temperature (oC) for the Leveloggers. In addition, instruments of model type LTC also measure conductivity (mS cm-1).
Water Level Gauge Installation and Removal
The water level gauges were installed at 65 sites across the Atchafalaya and Terrebonne basins to make in situ measurements of water level changes during the spring campaign (Figure 1). They were installed within a 2-inch diameter and 10-feet long PVC pipe (5.1 cm x 3.05 m). Vent slits were cut along the pipe to allow water to circulate through the pipe and reduce sedimentation within the pipe. The PVC pipe was inserted vertically about 5 feet deep into the sediment such that the vent slits would be below the water surface. The water level gauge was hung inside the pipe from a threaded PVC cap on the top of the pipe using a non-stretch cord such that it was suspended <10 cm above the sediment, while protecting the device against currents and bio-foul. The water level gauges were removed during the fall field campaign.
The atmospheric barometers were installed at eight sites across the Atchafalaya and Terrebonne basins to ensure all water level gauges were within 30 km of a barometer (Figure 2). These barometers were used to compensate for water level gauges for an accurate record of water level.
Six instruments could not be found at the end of the deployment and were assumed to be lost due to storms, strong river flows, or human removal. These instruments are flagged as ‘Lost’ in the dataset. An additional eleven instruments were damaged due to bio-fouling or corrupted and the data could not be recovered. These instruments are flagged as ‘Unreadable’ in the dataset.
The water level gauge data were opened and processed within Solinst Levelogger Software and related barometric data were used to compensate for atmospheric pressure. The outputs were a time-series of relative water level changes.
In addition to water level data, all instruments also measured water temperature and LTC instruments measured conductivity.
Absolute Water Surface Elevation Conversions
Conversion from raw water level to water surface elevation was done by estimating a conversion value from AirSWOT (27 gauges), GNSS (3 gauges), or Delta-X hydrodynamic models (4 gauges). There were 14 gauges that did not have conversion data and only raw water level values are provided. Flags in the summary file indicate which method was used for the conversion from raw to absolute water surface elevation (flag) and the quality of those conversions (quality_flag).
For AirSWOT conversions, the vertical datums for each water level gauge were estimated by taking the difference between in situ and AirSWOT water levels, averaging AirSWOT data in a 1-km2 region around each gauge. When AirSWOT observed a water level gauge multiple times, the median difference between AirSWOT and the gauge data was used. These vertical datums are recorded in the gauge summary file as “conversion_to_NAVD88” and were added to the raw_water_level to calculate the absolute water surface elevation with respect to geoid NAVD88 12b.
When AirSWOT data were not available, absolute water surface elevations were calculated using a GNSS conversion. These conversions were measured using a Septentrio PolaRx5 or Trimble R12 mounted to the PVC pipes where the gauges were installed. Two independent 10-minute 1-Hz observations were collected immediately after the gauges were removed from the pipes. Post-processed kinematic (PPK) processing was applied using 1-Hz data obtained from eleven base stations within the C4Gnet Real Time Network (operated by the Louisiana State University Center for Geoinformatics).
When neither AirSWOT or GNSS conversions were available, Delta-X hydrodynamic models were used to convert raw water level to water surface elevation. This conversion was done by finding the average bias between raw water level and model water surface elevations during spring and fall simulations.
GNSS Boat Surveys
A GNSS antenna was mounted on the side of the boat used by the University of North Carolina (UNC) team on a pole directly above the depth sounder. This GNSS antenna recorded observations of elevation continuously at 1 Hz on all field days. These data were post-processed using precise point positioning (PPP) and converted to water surface elevation by subtracting the height of the antenna above the water surface when it was mounted on the boat to provide an estimate of water surface elevation. These data are limited to times when the boat was moving slowly enough such that its speed did not affect the height of the antenna above the water.

Figure 3. Map of boat survey areas during the Fall 2021 Delta-X campaign.
Data Access
These data are available through the Oak Ridge National Laboratory (ORNL) Distributed Active Archive Center (DAAC).
Delta-X: In-situ Water Surface Elevation, MRD, Louisiana, USA, 2021
Contact for Data Center Access Information:
- E-mail: uso@daac.ornl.gov
- Telephone: +1 (865) 241-3952
References
Denbina, M.W., M. Simard, and E. Rodriguez. 2023. Delta-X: AirSWOT L3 Water Surface Elevations, MRD, Louisiana, 2021. ORNL DAAC, Oak Ridge, Tennessee, USA. https://doi.org/10.3334/ORNLDAAC/2133
Denbina, M.W., M. Simard, E. Rodriguez, X. Wu, and C. Michailovsky. 2021. Pre-Delta-X: L2 AirSWOT Water Surface Elevations, Atchafalaya Basin, LA, USA, 2016. ORNL DAAC, Oak Ridge, Tennessee, USA. https://doi.org/10.3334/ORNLDAAC/1818
Soloy, A., A.L. Christensen, D.J. Jensen, M.W. Denbina, K.A. Wright, P. Passalacqua, and M. Simard. 2024. Delta-X: ANUGA Hydrodynamic Outputs, Atchafalaya and Terrebonne, MRD, USA. ORNL DAAC, Oak Ridge, Tennessee, USA. https://doi.org/10.3334/ORNLDAAC/2310
Dataset Revisions
|
Version |
Release Date |
Description |
|
1.0 |
99 new files were added, including 98 files corresponding to in situ water level measurements collected at 49 different locations and one summary file of water level measurements and metadata for the 65 sites. |
|
|
1.0 |
2023-03-16 |
Initial release of the dataset containing five data files of boat surveys |