Documentation Revision Date: 2025-12-03
Dataset Version: 1
Summary
There are four data files in this dataset. Two compressed files in Zip (.zip) format contain model input files for spring and fall simulations; the files contain 25 input files each. Two files in netCDF (.nc) format hold the model output data for the spring and fall model simulations.
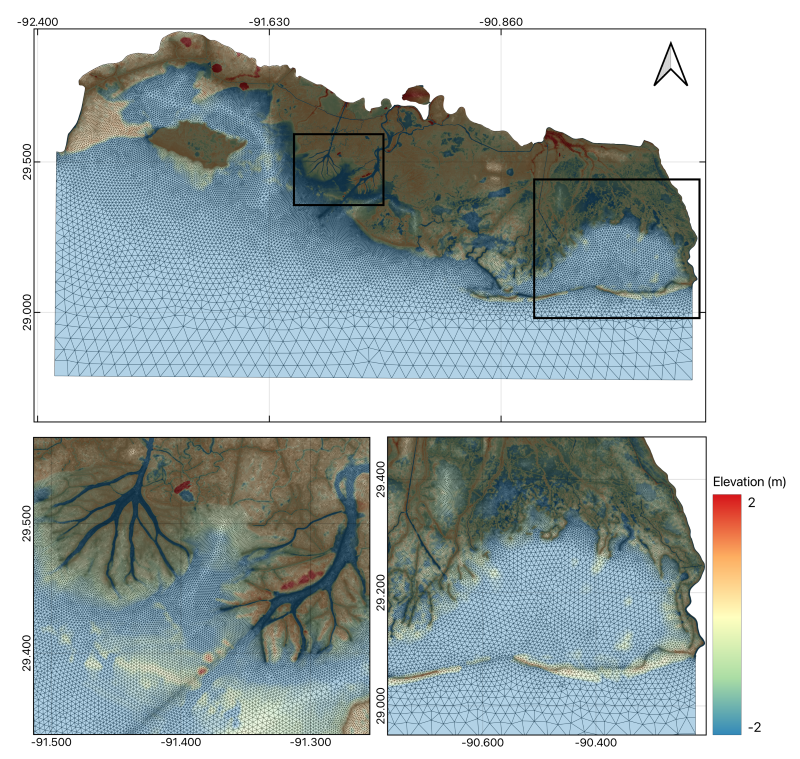
Figure 1. Delft3D FM model mesh and bathymetry for the study area in coastal Louisiana, U.S.
Citation
Payandeh, A.R., M. Simard, and C. Jones. 2025. Delta-X: Delft3D FM, Extended Domain Hydrodynamic Model. ORNL DAAC, Oak Ridge, Tennessee, USA. https://doi.org/10.3334/ORNLDAAC/2464
Table of Contents
- Dataset Overview
- Data Characteristics
- Application and Derivation
- Quality Assessment
- Data Acquisition, Materials, and Methods
- Data Access
- References
Dataset Overview
This dataset contains Delft3D FM hydrodynamic model setup and results for the Atchafalaya and Terrebonne basins in coastal Louisiana, U.S.. The model domain spans from Bayou Lafourche in eastern Terrebonne Bay, encompasses Atchafalaya Bay, and extends westward to Vermilion Bay (Figure 1). Separate simulations were conducted for spring and fall, each covering a 31-day period. Both models were calibrated and validated using Delta-X airborne remote sensing data and in situ measurements. The dataset includes the full set of hydrodynamic model input files for each seasonal simulation, along with a netCDF output file for each model run. Using the provided input files, users can reproduce the simulations and obtain results identical to those in the output netCDF files included in this dataset.
Project: Delta-X
The Delta-X mission is a 5-year NASA Earth Venture Suborbital-3 mission to study the Mississippi River Delta in the United States, which is growing and sinking in different areas. River deltas and their wetlands are drowning as a result of sea level rise and reduced sediment inputs. The Delta-X mission will determine which parts will survive and continue to grow, and which parts will be lost. Delta-X begins with airborne and in situ data acquisition and carries through data analysis, model integration, and validation to predict the extent and spatial patterns of future deltaic land loss or gain.
Related Datasets
Payandeh, A.R., M. Simard, and C. Jones. 2025. Delta-X: Delft3D FM, Weighted Mean Salinity, MRD, Louisiana, USA. ORNL DAAC, Oak Ridge, Tennessee, USA. https://doi.org/10.3334/ORNLDAAC/2420
Payandeh, A.R., M. Simard, and C. Jones. 2025. Delta-X: Delft3d FM, Weighted Mean Hydroperiod, MRD, Louisiana, USA. ORNL DAAC, Oak Ridge, Tennessee, USA. https://doi.org/10.3334/ORNLDAAC/2421
- These datasets were produced using similar methods.
Acknowledgements
This study was funded by the NASA Earth Venture Suborbital-3 Program (grant NH17ZDA001N-EVS3).
Data Characteristics
Spatial Coverage: Atchafalaya River and Terrebonne Basins in southern Louisiana, USA
Spatial Resolution: 25 m
Temporal Coverage: 2021-03-20 to 2021-09-14
Site Boundaries: Latitude and longitude are given in decimal degrees.
| Site | Westernmost Longitude | Easternmost Longitude | Northernmost Latitude | Southernmost Latitude |
|---|---|---|---|---|
| Atchafalaya River and Terrebonne Basins in southern Louisiana, USA | -92.3434 | -90.2076 | 29.9336 | 28.7751 |
Data File Information
There are four data files in this dataset; two compressed files in Zip (.zip) format contain model input files for spring and fall simulations, and two files in netCDF (.nc) format that provide the model output data for those simulations. The input files in the two Zip files are named the same; the files are in a variety of formats, including plain text and netCDF (.nc).
D3DFM_Fall2021_model_input_files.zip: This file contains 25 input files used in the fall model.
D3D3DFM_Spring2021_model_input_files.zip: This file contains 25 input files used in the spring model.
D3DFM_Fall2021_Output.nc4: NetCDF file with output data from the fall simulation.
D3DFM_Spring2021_Output.nc4: NetCDF file with output data from the spring simulation.
Table 1. Input data files contained in the Zip (.zip) files.
| File name | Description |
|---|---|
| FlowFM.mdu | Model definition file |
| Mesh_Final_25m_Interpolated_net.nc | Model mesh and bathymetry |
| initialsalinity.xyz | Spatially varying initial salinity |
| frictioncoefficient.xyz | Spatially varying Chézy roughness coefficients |
| FlowFM_obs.xyn | Location of observation points |
| FlowFM.ext | Delft3d FM external forcing file |
| FlowFM_bnd.ext | Delft3d FM new format external forcing file |
| initialFields.ini | Delft3d FM Initial field file. Friction coefficient, interpolation method=triangulated |
| South.pli | Polyline file defining south boundary coordinates |
| West.pli | Polyline file defining west boundary coordinates |
| East.pli | Polyline file defining east boundary coordinates |
| Atchafalaya.pli | Polyline file defining Atchafalaya River boundary coordinates |
| Wax.pli | Polyline file defining Wax Lake Outlet boundary coordinates |
| SourceSink01.pli | Polyline file defining stream coordinates |
| Stream1.pli | Polyline file defining stream 1 boundary coordinates |
| Stream2.pli | Polyline file defining stream 2 boundary coordinates |
| Stream3.pli | Polyline file defining stream 3 boundary coordinates |
| Stream4.pli | Polyline file defining stream 4 boundary coordinates |
| Stream5.pli | Polyline file defining stream 5 boundary coordinates |
| Discharge.bc | File defining discharge at river boundaries (quantity=discharge bnd, unit = m3 s-1). Atchafalaya River and Wax Lake Outlet hourly discharge data from the USGS stations at Morgan City (ID: 07381600) and Calumet (ID: 07381590), respectively |
| Neumann.bc | File defining Neumann boundary condition |
| Salinity.bc | File defining salinity boundary condition (quantity = salinitybnd, unit = ppt). The discharge boundary condition was applied to the Atchafalaya River and Wax Lake Outlet using hourly salinity discharge data from the USGS stations at Morgan City (ID: 07381600) and Calumet (ID: 07381590), respectively, and from the NOAA tide station at Eugene Island (Station ID: 8764314) at the southern model boundary. |
| WaterLevel.bc | File defining water level boundary condition (quantity = water level bnd, unit = m). Data were water level time series from the NOAA tide station at Eugene Island (Station ID: 8764314) at the southern model boundary |
| SourceSink01.tim | File defining discharge and salinity in stream boundary condition. |
| windxy.tim | File defining wind magnitude and direction. Wind forcing was incorporated using data from the NOAA tide station at Eugene Island (Station ID: 8764314) at the southern model boundary |
Table 2. Variables in the output NetCDF data files from the model simulations.
| Variable Name | Units | Description |
|---|---|---|
| wgs84 | - | WGS 84 coordinate system metadata |
| mesh2d | - | Topology data of 2D mesh |
| mesh2d_node_x | degrees east | x-coordinate (longitude) of mesh nodes |
| mesh2d_node_y | degrees north | y-coordinate (latitude) of mesh nodes |
| mesh2d_node_z | m | z-coordinate (altitude) of mesh nodes |
| mesh2d_edge_x | degrees east | Characteristic x-coordinate of the mesh edge (e.g., midpoint) |
| mesh2d_edge_y | degrees north | Characteristic y-coordinate of the mesh edge (e.g., midpoint) |
| mesh2d_edge_nodes | - | Start and end nodes of mesh edges |
| mesh2d_face_nodes | - | Vertex nodes of mesh faces (counterclockwise) |
| mesh2d_edge_faces | - | Neighboring faces of mesh edges |
| mesh2d_face_x | degrees east | Characteristic x-coordinate of mesh face |
| mesh2d_face_y | degrees north | Characteristic y-coordinate of mesh face |
| mesh2d_face_x_bnd | degrees east | x-coordinate bounds of mesh faces (corner coordinates) |
| mesh2d_face_y_bnd | degrees north | y-coordinate bounds of mesh faces (corner coordinates) |
| mesh2d_face_z | m | z-coordinate of mesh faces |
| mesh2d_s1 | m | Water levels in each output time step (hourly) |
| mesh2d_sa1 | psu | Salinity in each output time step (hourly) |
| mesh2d_waterdepth | m | Water depth in each output time step (hourly) |
Application and Derivation
Delta-X begins with airborne and in situ data acquisition and carries through data analysis, model integration, and validation to predict the extent and spatial patterns of future deltaic land loss or gain. Hydrodynamic models such as the Delft3d FM (Deltares, 2025) are important to these processes in simulating river discharge conditions.
Quality Assessment
The hydrodynamic model was calibrated and validated using a multi-sensor approach integrating airborne remote sensing and in situ observations. Calibration began with water surface elevation data from AirSWOT (Denbina et al., 2023), covering both spring and fall 2021. Spatially varying Chézy roughness coefficient maps based on vegetation types (Jensen et al., 2024) were adjusted to minimize error and get the best performance. Spatially varying Chézy roughness coefficients were tuned to minimize error. In general, model results were in agreement with AirSWOT, with an RMSE of 0.09 m and R² of 0.82 in spring, and 0.11 m and 0.41 in fall. In vegetated wetlands, Chézy roughness coefficients were further refined using UAVSAR-derived water level changes (Jones et al., 2022), with the highest errors generally within ±4 cm in forested areas or dynamic wetting and drying zones. Final validation using Delta-X tide gauge data (Christensen et al., 2025), yielded R² values of 0.86 in spring and 0.62 in fall, with corresponding RMSE values of 0.11 m and 0.10 m, respectively (Figure 2).
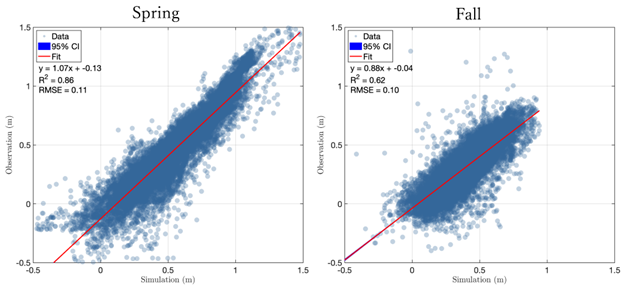
Figure 2. Comparison between simulated and measured water levels at Delta-X tide gauge stations.
Data Acquisition, Materials, and Methods
Model Description
A two-dimensional, depth-averaged hydrodynamic model was developed using the Delft3D Flexible Mesh Suite (Delft3D FM). Delft3D FM employs a finite-volume approach to solve the unsteady, nonlinear shallow water equations on an unstructured computational grid (Deltares, 2025). The model mesh was generated using Aquaveo’s Surface Water Modeling System (SMS) (Zundel, 2000), with spatial resolution adapted to balance computational cost and physical detail needed to resolve. High-resolution triangular elements (~25 m) were used in areas with complex topography and important flow features such as secondary channels, levees, and narrow bayous to accurately capture connectivity. In contrast, coarser elements were applied in relatively flat regions, including open water and low-relief floodplains. To ensure the mesh met numerical modeling standards, it underwent thorough quality checks for orthogonality, smoothness, and overall integrity. The final mesh consisted of 774,734 nodes and 1,543,682 elements. Elevation data from the Delta-X lidar-derived digital elevation model (DEM) (Christensen et al., 2023) were interpolated onto the mesh to define model topo-bathymetry. Boundary conditions included water level time series from the NOAA tide station at Eugene Island (Station ID: 8764314) at the southern model boundary. Neumann (free outflow) conditions were applied at both eastern and western boundaries. The discharge boundary condition was applied to the Atchafalaya River and Wax Lake Outlet using hourly discharge data from the USGS stations at Morgan City (ID: 07381600) and Calumet (ID: 07381590), respectively. Wind forcing was incorporated using data from the same NOAA station.
Data Access
These data are available through the Oak Ridge National Laboratory (ORNL) Distributed Active Archive Center (DAAC).
Delta-X: Delft3D FM, Extended Domain Hydrodynamic Model
Contact for Data Center Access Information:
- E-mail: uso@daac.ornl.gov
- Telephone: +1 (865) 241-3952
References
Christensen, A.L., J.M. Mallard, M. Simard, T.M. Pavelsky, and A. Rovai. 2025. Delta-X: In-situ Water Surface Elevation, MRD, Louisiana, USA, 2021. ORNL DAAC, Oak Ridge, Tennessee, USA. https://doi.org/10.3334/ORNLDAAC/2086
Christensen, A.L., M.W. Denbina, and M. Simard. 2023. Delta-X: Digital Elevation Model, MRD, LA, USA, 2021. ORNL DAAC, Oak Ridge, Tennessee, USA. https://doi.org/10.3334/ORNLDAAC/2181
Deltares. 2025. Delft3d FM user manual. Deltares; Delft, The Netherlands. https://content.oss.deltares.nl/delft3d/D-Flow_FM_User_Manual.pdf
Denbina, M.W., M. Simard, and E. Rodriguez. 2023. Delta-X: AirSWOT L3 Water Surface Elevations, MRD, Louisiana, 2021. ORNL DAAC, Oak Ridge, Tennessee, USA. https://doi.org/10.3334/ORNLDAAC/2133
Jensen, D.J., E. Castaneda-Moya, E. Solohin, D.R. Thompson, and M. Simard. 2024. Delta-X AVIRIS-NG L3 Derived Vegetation Types, MRD, Louisiana, USA. ORNL DAAC, Oak Ridge, Tennessee, USA. https://doi.org/10.3334/ORNLDAAC/2352
Jones, C., T. Oliver-Cabrera, M. Simard, and Y. Lou. 2022. Delta-X: UAVSAR L3 Water Level Changes, MRD, Louisiana, 2021. ORNL DAAC, Oak Ridge, Tennessee, USA. https://doi.org/10.3334/ORNLDAAC/2058
Payandeh, A.R., M. Simard, and C. Jones. 2025. Delta-X: Delft3d FM, Weighted Mean Hydroperiod, MRD, Louisiana, USA. ORNL DAAC, Oak Ridge, Tennessee, USA. https://doi.org/10.3334/ORNLDAAC/2421
Payandeh, A.R., M. Simard, and C. Jones. 2025. Delta-X: Delft3D FM, Weighted Mean Salinity, MRD, Louisiana, USA. ORNL DAAC, Oak Ridge, Tennessee, USA. https://doi.org/10.3334/ORNLDAAC/2420
Zundel, A. 2000. Surface-water modeling system reference manual. Brigham Young University, Environmental Modeling Research Laboratory; Provo, Utah.