Documentation Revision Date: 2024-06-03
Dataset Version: 1
Summary
This dataset holds 36 files. There are 32 NetCDF (*.nc) files containing model input, outputs, and hydrodynamic information. Model run scripts are provided in three compressed (*.zip) files and one Python (*.py) script.
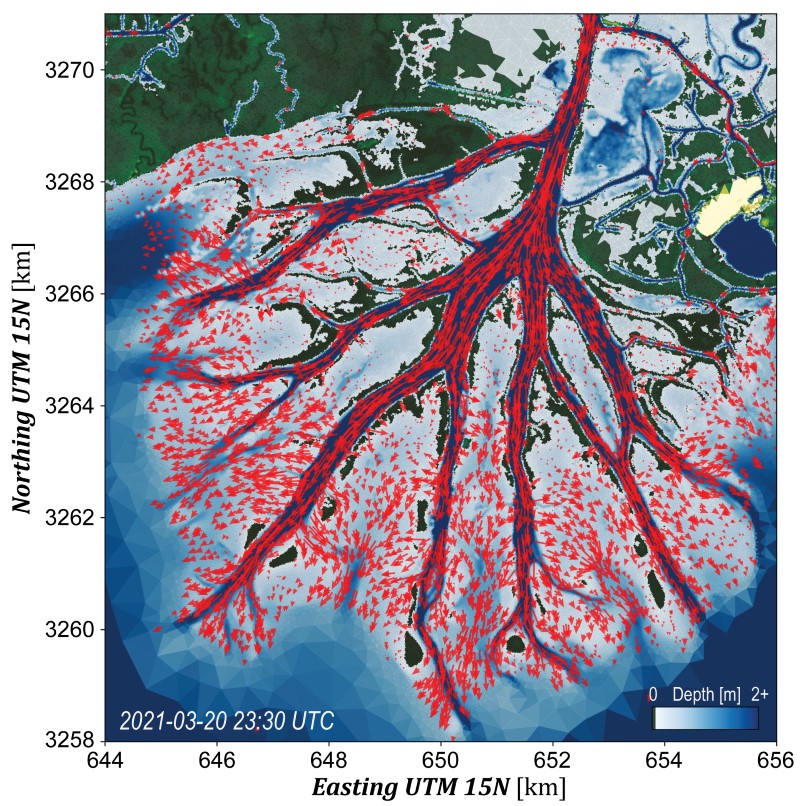
Figure 1. ANUGA flow directions and depth at one timestep during the 2021 Spring campaign.
Citation
Wright, K.A., and P. Passalacqua. 2024. Delta-X: Calibrated ANUGA Hydrodynamic Outputs for the Atchafalaya Basin, MRD, LA. ORNL DAAC, Oak Ridge, Tennessee, USA. https://doi.org/10.3334/ORNLDAAC/2306
Table of Contents
- Dataset Overview
- Data Characteristics
- Application and Derivation
- Quality Assessment
- Data Acquisition, Materials, and Methods
- Data Access
- References
Dataset Overview
This dataset provides ANUGA hydrodynamic modeling results and input run-scripts for the Atchafalaya basin in the Mississippi River Delta in southern Louisiana, USA, during three windows of time corresponding to the Delta-X and Pre-Delta-X field campaigns in fall 2016, spring 2021, and fall 2021. ANUGA is a 2D depth-integrated hydrodynamic model which uses the Finite Volume Method (FVM) to numerically solve the shallow water momentum and continuity equations for fluid flow in broad-scale geophysical systems. Each iteration of the model was extensively calibrated using a database of in-situ and remotely-sensed observations, including about 54 water level gauges, numerous water surface profiles collected by AirSWOT or lidar, and water level change measurements derived from UAVSAR. The model was forced using observational data collected from NOAA and USGS, and the model mesh was specifically designed to capture channel-island connectivity using high-resolution Planet Labs imagery spanning over a decade. In total, over a month of simulation outputs are included in this dataset, covering different seasons and hydrological conditions in the Atchafalaya and Wax Lake Delta systems. These model outputs can be leveraged with other Delta-X datasets to provide contextual information about water levels or flow velocities at different times or locations within the Atchafalaya basin, and the model codes provided can be used to simulate additional time periods for further analysis in this region. Model outputs are presented in NetCDF (*.nc) format and run-scripts are in Python (*.py) or contained in compressed (*.zip) file format.
Project: Delta-X
The Delta-X mission is a 5-year NASA Earth Venture Suborbital-3 mission to study the Mississippi River Delta in the United States, which is growing and sinking in different areas. River deltas and their wetlands are drowning as a result of sea level rise and reduced sediment inputs. The Delta-X mission will determine which parts will survive and continue to grow, and which parts will be lost. Delta-X begins with airborne and in situ data acquisition and carries through data analysis, model integration, and validation to predict the extent and spatial patterns of future deltaic land loss or gain.
Related Publications
Donatelli, C., P. Passalacqua, K. Wright, G. Salter, M. P. Lamb, D. Jensen, and S. Fagherazzi. 2023. Quantifying Flow Velocities in River Deltas via Remotely Sensed Suspended Sediment Concentration. Geophysical Research Letters 50:e2022GL101392. https://doi.org/10.1029/2022GL101392
Salter, G., P. Passalacqua, K. Wright, S. Feil, D. Jensen, M. Simard, and M. P. Lamb. 2022. Spatial Patterns of Deltaic Deposition/Erosion Revealed by Streaklines Extracted From Remotely-Sensed Suspended Sediment Concentration. Geophysical Research Letters 49:e2022GL098443. https://doi.org/10.1029/2022GL098443
Wright, K., P. Passalacqua, M. Simard, and C. E. Jones. 2022a. Integrating Connectivity Into Hydrodynamic Models: An Automated Open-Source Method to Refine an Unstructured Mesh Using Remote Sensing. Journal of Advances in Modeling Earth Systems 14:e2022MS003025. https://doi.org/10.1029/2022MS003025
Wright, K., J. Hariharan, P. Passalacqua, G. Salter, and M. P. Lamb. 2022b. From Grains to Plastics: Modeling Nourishment Patterns and Hydraulic Sorting of Fluvially Transported Materials in Deltas. Journal of Geophysical Research: Earth Surface 127e2022JF006769. https://doi.org/10.1029/2022JF006769
Related Datasets
Soloy, A., A.L. Christensen, D.J. Jensen, M.W. Denbina, K.A. Wright, P. Passalacqua, and M. Simard. 2024. Delta-X: ANUGA Hydrodynamic Outputs, Atchafalaya and Terrebonne, MRD, USA. ORNL DAAC, Oak Ridge, Tennessee, USA. https://doi.org/10.3334/ORNLDAAC/2310
Denbina, M. W., M. Simard, T. M. Pavelsky, A. I. Christensen, K. Liu, and C. Lyon. 2020. Pre-Delta-X: Channel Bathymetry of the Atchafalaya Basin, LA, USA, 2016. ORNL Distributed Active Archive Center. https://doi.org/10.3334/ORNLDAAC/1807
Acknowledgments
This work was supported by NASA Earth Venture Suborbital-3 (EVS-3) program (grant NNH17ZDA001N-EVS3).
Data Characteristics
Spatial Coverage: Atchafalaya basin, Mississippi River Delta, Louisiana, USA
Spatial Resolution: 25 m to 1 km
Temporal Coverage:
- Pre-Delta-X (PDX) 2016-10-15 to 2016-10-18
- Delta-X Spring Campaign (DXS) 2021-03-20 to 2021-04-02
- Delta-X Fall Campaign (DXF) 2021-08-14 to 2021-08-27
Temporal Resolution:
- Pre-Delta-X (PDX): 15 minutes
- Delta-X (DXS and DXF): 30 minutes
Site Boundaries: Latitude and longitude are given in decimal degrees.
| Site | Westernmost Longitude | Easternmost Longitude | Northernmost Latitude | Southernmost Latitude |
|---|---|---|---|---|
| Atchafalaya basin, LA, USA | -88.65 | -88.30 | 29.54 | 29.14 |
Data File Information
This dataset holds 36 files. There are 32 NetCDF (*.nc) files containing model input, outputs, and hydrodynamic information. Model run scripts are provided in three compressed (*.zip) files and one Python (*.py) script.
Output NetCDF Files
NetCDF files contain hydrodynamic outputs from ANUGA and some input variables.
Files are named: Hydro_WLAD_YYYYMMDD_Campaign.nc, where
- YYYYMMDD is the date being analyzed
- Campaign is PDX (Pre-Delta-X), DXS (Delta-X Spring), or DXF (Delta-X Fall).
Table 1. Data dictionary for Hydro_WLAD_YYYYMMDD_Campaign.nc files.
| Variable | Units | Type | Description |
|---|---|---|---|
| mesh | Input | Topology of the unstructured triangular mesh, provided as an array of node indices defining each triangle. There are three nodes per cell, 775615 nodes in total, and 1544332 cells in total. Indices begin at 0. | |
| x | m | Input | Easting coordinates of each triangle node in UTM zone 15N (EPSG: 32615). |
| y | m | Input | Northing coordinates of each triangle node in UTM zone 15N (EPSG: 32615). |
| lat | degrees north | Input | Latitude of each triangle node in WGS84 coordinates (EPSG: 4326). |
| lon | degrees east | Input | Longitude of each triangle node in WGS84 coordinates (EPSG: 4326). |
| topo | m | Input | Bed elevation of the centroid of each cell in the mesh in meters above the NAVD88 orthometric datum (using Geoid 12A). Elevations derived using the Pre-Delta-X mosaic DEM from Denbina et al., (2020) with minor adjustments in small channels. |
| fric_class | 1 | Input | Friction class ID for each cell in the mesh, provided as an integer. Each cell with the same class ID used the same friction coefficients, which are also specified in each file. |
| mannings_n | 1 | Input | Manning’s roughness coefficients used for each friction class. The values are unitless, but the version of the formula used is in metric units. |
| baptist_m | m-2 | Input | Vegetation stem density used in each friction class, used in the Baptist equation for vegetated resistance. |
| baptist_D | m | Input | Vegetation stem diameter used in each friction class, used in the Baptist equation for vegetated resistance. |
| baptist_h | m | Input | Vegetation stem height used in each friction class, used in the Baptist equation for vegetated resistance. Represents total stem height, not submerged height. |
| Time | seconds | Output | Time value in UTC of each saved model timestep, provided in “seconds since model start time.” Model start time for each file is specified in the Units attribute for the Time variable. |
| xvel | m s-1 | Output | Depth-integrated x-velocity at each cell centroid at each timestep. |
| yvel | m s-1 | Output | Depth-integrated y-velocity at each cell centroid at each timestep. |
| xmom | m2 s-1 | Output | Depth-integrated x-momentum (product of x-velocity and flow depth) at each cell centroid at each time step. |
| ymom | m2 s-1 | Output | Depth-integrated y-momentum (product of y-velocity and flow depth) at each cell centroid at each time step. |
| depth | m | Output | Flow depth at each cell centroid at each time step. |
| stage | m | Output | Water surface elevation at each cell centroid at each time step, specified in meters above the NAVD88 orthometric datum (using Geoid 12A). In dry cells, the stage is equal to the bed elevation. |
Input Run-Scripts
Input run-scripts include three compressed (*.zip) files, and one Python (*.py) script:
- Compressed (*.zip) files (Scripts_DXS.zip, Scripts_DXF.zip, and Scripts_PDX.zip):
- Contain files for rerunning the model under the conditions for a specific campaign. See Tables 2-5 for additional details on the contents of the compressed files.
- baptist_operator.py
- A Python script implementing the custom “Baptist” vegetated friction formulation defined in Baptist et al., (2007). In order to run any model implementation properly, this file should be copied into the “operators” subfolder wherever the active implementation of ANUGA is installed.
Table 2. Contents of “BoundaryConditions” subdirectory. This is present in all compressed files (Scripts_DXS.zip, Scripts_DXF.zip, and Scripts_PDX.zip)
| Filename | Description |
|---|---|
| Tides_*.csv or NOAA*.csv | NOAA water level observations at the Amerada Pass or Eugene tidal stations. These files are used for tidal forcing. |
| Q_*.csv or USGS_*.csv | USGS discharge observations at Calumet, Morgan City, and (if available) in the Gulf Intracoastal Waterway near Franklin. These files are used for stream inflows or outflows. |
| Wind_*.csv | NOAA wind observations at the Amerada Pass or Eugene tidal stations. Winds were not used for any of the simulations, but the functionality is available if desired. |
| IC_*.csv | Initial condition file containing the “depth”, “xmom” (x-momentum), or “ymom” (y-momentum) values from a previous model run. |
| FrictionMap*.tif | Raster map used to classify each model grid cell into the appropriate friction class. This information is also available in each of the Hydro_*.nc files. |
Table 3. Contents of “BathymetryPolygons” subdirectory. This is present in all compressed files (Scripts_DXS.zip, Scripts_DXF.zip, and Scripts_PDX.zip)
| Filename | Description |
|---|---|
| *Reg*_Res*.csv | Geospatial coordinates of the polygons used to refine/coarsen the model mesh in localized regions. The digits following “Res” in the filename indicate the desired resolution within that mesh element, specified as “maximum triangle area.” Coordinates of each polygon are in UTM 15N (EPSG: 32615). |
| WLAD_Boundary.csv | Geospatial coordinates of the model bounding polygon. Coordinates of the polygon are in UTM 15N (EPSG: 32615). |
| WLAD2_topo_Carved-ndwi.csv | Bed elevation of the centroid of each cell in the mesh in meters above the NAVD88 orthometric datum (using Geoid 12A). Elevations were derived using the Pre-Delta-X mosaic DEM from Denbina et al., (2020) with minor adjustments in small channels. This information is also available in each of the Hydro_*.nc files. |
Table 4. Python scripts for the Delta-X campaigns. These are unique to Scripts_DXS.zip and Scripts_DXF.zip
| Filename | Description |
|---|---|
| settings.py | Configuration Python file used tracking major model settings, including the model start time, timestep, environmental forcing information, and friction coefficients. |
| prepare_boundaries.py | Serial Python script for downloading and pre-processing environmental forcing data from NOAA and USGS corresponding with the simulation dates specified in settings.py. Typically only run once with the result saved for future use. |
| prepare_topography.py | Serial Python script with which one can convert an ASCII DEM file into a compatible ANUGA topography file. Typically only run once with the result saved for future use. |
| tools.py | Helper Python script which contains a collection of neatly-packaged functions used repeatedly in each simulation. |
| run_parallel.py | Parallel Python script which runs an ANUGA simulation corresponding to the associated Delta-X campaign in 2021. Running this script as-is will reproduce the outputs provided above. Note that file paths for input files may need to be adjusted. |
Table 5. Python scripts for the Pre-Delta-X campaign. These are unique to Scripts_PDX.zip.
| Filename | Description |
|---|---|
| makeTopo.py | Serial Python script with which one can convert an ASCII DEM file into a compatible ANUGA topography file. Typically, only ran once with the result saved for repeated future use. |
| runWLAD_parallel.py | Parallel Python script which runs an ANUGA simulation corresponding to the Pre-Delta-X demonstration campaign in 2016. Running this script as-is will reproduce the outputs provided above. Note that file paths for input files may need to be adjusted. |
Application and Derivation
Outputs from the calibrated hydrodynamic model can connect fine-scale in-situ measurements with coarse-scale remote sensing measurements by providing information about hydrological processes at intermediate scales and in locations that were not directly measured. They can provide contextual information for use with in-situ water levels, ADCP surveys, AirSWOT-derived water levels, UAVSAR-derived water level changes, and be used as an input for sediment transport analyses.
Quality Assessment
Friction coefficients were initially chosen based on the best available estimates from field data and the literature, and then tuned through trial-and-error during the calibration process until the model was deemed to provide sufficient results. The calibration process consisted of comparing simulated water level changes throughout the Atchafalaya basin to up to 54 water level gauges, numerous water surface profiles collected by AirSWOT (in 2021) or lidar (in 2016), and water level change measurements derived from UAVSAR.
Precise statistics were computed regarding spatial variations in the mean tidal elevations, the tidal range, the timing of the tidal signal, and metrics related to the correlation of the modeled and observed data. However, because these observational datasets differed in type, source agency, vertical datum, temporal frequency, spatial resolution, and in general had different sources and degrees of uncertainty, it remains very difficult to use these quantitative measures to directly calibrate a complex 2D model. The authors often had to reply on qualitative measures using best judgement, particularly when data sources offered competing answers regarding errors in the model. While not perfect, the result of this iterative process, carried out over several years of detailed analysis, is an extensively calibrated hydrodynamic model that aligns well with all available data sources.
The vertical uncertainty at most of the water level gauges was found to average below 5 cm across the entire basin, with the best performance near the coast in the active deltaic regions and largest channels, and the worst performance in the regions of the upstream wetlands fed by small streams not resolved at the highest mesh resolution.
Data Acquisition, Materials, and Methods
ANUGA is a 2D depth-integrated hydrodynamic model which uses the Finite Volume Method (FVM) to numerically solve the shallow water momentum and continuity equations for fluid flow in geophysical systems (Roberts et al., 2015). ANUGA is coded in Python, with computationally expensive subroutines coded in C for efficiency, and is available as a Python package from typical sources (e.g. conda-forge, GitHub). ANUGA was designed specifically for coastal contexts, and has performed well in numerous applications (Davies and Roberts, 2015; Mungkasi and Roberts, 2013; Nielsen et al., 2005). The model uses an unstructured triangular mesh, which can vary in resolution spatially to highlight features of interest or improve computational efficiency. ANUGA can also easily be run in parallel to further boost performance. ANUGA was chosen for this application due to its ease of use, fully open-source nature, good computational efficiency, and flexibility regarding the resolution of the unstructured mesh and ability to add features to the model, such as different friction parameterizations.
All ANUGA simulations contained within this data delivery were conducted on the Texas Advanced Computing Center (TACC) using the Stampede2 computing cluster.
Model Inputs
The construction of the model, including the choice of model boundaries, the design of the model mesh, and the sources of various boundary conditions, have all been described in detail in Wright et al. (2022a). In brief, the boundaries were chosen to correspond to long-term monitoring stations in the region, which supply the model boundary conditions. The mesh was designed to be high-resolution in places expected to have significant hydrodynamic activity using ten years of Planet Labs optical imagery, as well as UAVSAR data collected during the 2016 Pre-Delta-X campaign. The model bathymetry is based on the Delta-X mosaic DEM, with some mild corrections in smaller upstream channels in which data was unavailable, following the methodology described in Zhang et al. (2022).
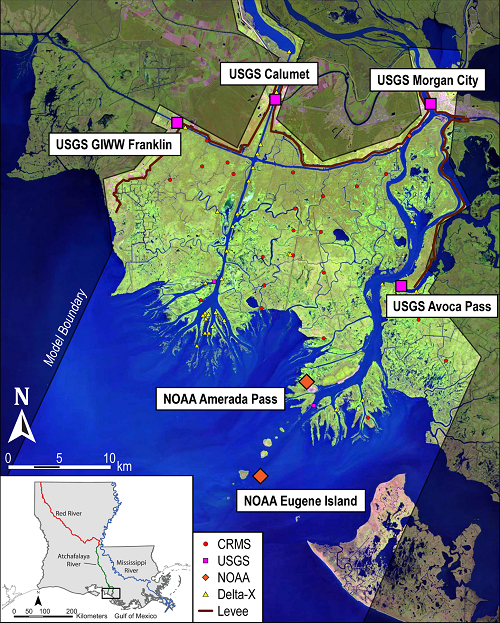
Figure 2. Boundary of the ANUGA model, as well as the location of all in-situ gauges used for model boundary conditions (large icons) or model calibration/validation (small icons) during at least one of the campaigns. Figure adapted from Wright et al. (2022a).
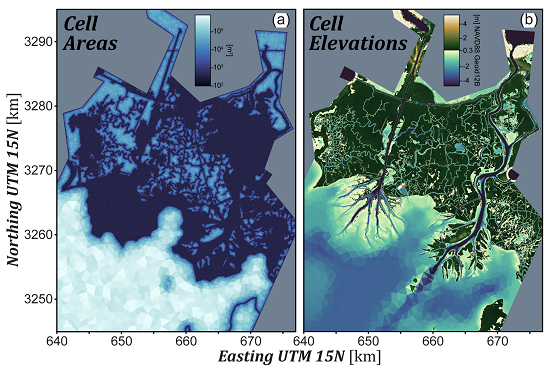
Figure 3: Model mesh resolution and bed elevation. Figure from Wright et al. (2022a).
Model Settings
Simulation dates for each campaign were chosen to maximize the number of remote sensing data acquisitions that occurred within each simulation window. The model was designed and calibrated to capture ambient flow conditions in the Spring and Fall in this basin, so it is not expected to be reliable (scientifically or numerically) during large extreme events. For this reason, in the Fall 2021 campaign, the simulation window was shifted earlier in order to avoid the landfall of Hurricane Ida, and therefore, did not overlap with any of the UAVSAR flights during that campaign.
Friction is assigned in the model using several classes derived from (a) unsupervised clustering performed on optical imagery over the basin to delineate vegetation classes and (b) best practices for modeling the flow through open water and channels of varying depths and widths. Each model grid cell is assigned to one friction class. Open water classes parameterize friction using Manning’s equation (built-in to ANUGA), and vegetated classes parameterize friction using a custom implementation of the equation presented in Baptist et al. (2007) (not built-in to ANUGA and provided as part of this dataset). Each friction class has four coefficients: Manning’s n, vegetation density (m), vegetation stem diameter (D), and vegetation stem height (h). The friction coefficients are constant throughout each campaign, but differ between different campaigns, in accordance with changes in vegetation density and hydrological conditions in the Spring and Fall. The friction coefficients and friction class IDs of each cell are provided within each NetCDF file.
Data Access
These data are available through the Oak Ridge National Laboratory (ORNL) Distributed Active Archive Center (DAAC).
Delta-X: Calibrated ANUGA Hydrodynamic Outputs for the Atchafalaya Basin, MRD, LA
Contact for Data Center Access Information:
- E-mail: uso@daac.ornl.gov
- Telephone: +1 (865) 241-3952
References
Baptist, M. J., V. Babovic, J. Rodríguez Uthurburu, M. Keijzer, R. E. Uittenbogaard, A. Mynett, and A. Verwey. 2007. On inducing equations for vegetation resistance. Journal of Hydraulic Research 45:435–450. https://doi.org/10.1080/00221686.2007.9521778
Davies, G., and S. Roberts. 2015. Open source flood simulation with a 2D discontinuous-elevation hydrodynamic model. Proceedings of 21st International Congress on Modelling and Simulation, Gold Coast, Australia, 29 Nov to 4 Dec 2015. https://doi.org/10.36334/modsim.2015.l5.davies
Denbina, M. W., M. Simard, T. M. Pavelsky, A. I. Christensen, K. Liu, and C. Lyon. 2020. Pre-Delta-X: Channel Bathymetry of the Atchafalaya Basin, LA, USA, 2016. ORNL Distributed Active Archive Center. https://doi.org/10.3334/ORNLDAAC/1807
Donatelli, C., P. Passalacqua, K. Wright, G. Salter, M. P. Lamb, D. Jensen, and S. Fagherazzi. 2023. Quantifying Flow Velocities in River Deltas via Remotely Sensed Suspended Sediment Concentration. Geophysical Research Letters 50:e2022GL101392. https://doi.org/10.1029/2022GL101392
Mungkasi, S., and S. Roberts. 2013. Validation of ANUGA hydraulic model using exact solutions to shallow water wave problems. In Journal of Physics: Conference series. (Vol. 423). IOP Publishing. http://doi.org/10.1088/1742-6596/423/1/012029
Nielsen, O., S. Roberts, D. Gray, A. McPherson, and A. Hitchman. 2005. Hydrodymamic modelling of coastal inundation. Modelling and Simulation Society of Australia and New Zealand Inc. https://d28rz98at9flks.cloudfront.net/69673/69673.pdf
Roberts, S., O. Nielsen, D. Gray, J. Sexton, and G. Davies. 2015. ANUGA user manual, Release 2.0. https://doi.org/10.13140/RG.2.2.12401.99686
Salter, G., P. Passalacqua, K. Wright, S. Feil, D. Jensen, M. Simard, and M. P. Lamb. 2022. Spatial Patterns of Deltaic Deposition/Erosion Revealed by Streaklines Extracted From Remotely-Sensed Suspended Sediment Concentration. Geophysical Research Letters 49:e2022GL098443. https://doi.org/10.1029/2022GL098443
Soloy, A., A.L. Christensen, D.J. Jensen, M.W. Denbina, K.A. Wright, P. Passalacqua, and M. Simard. 2024. Delta-X: ANUGA Hydrodynamic Outputs, Atchafalaya and Terrebonne, MRD, USA. ORNL DAAC, Oak Ridge, Tennessee, USA. https://doi.org/10.3334/ORNLDAAC/2310
Wright, K., P. Passalacqua, M. Simard, and C. E. Jones. 2022a. Integrating Connectivity Into Hydrodynamic Models: An Automated Open-Source Method to Refine an Unstructured Mesh Using Remote Sensing. Journal of Advances in Modeling Earth Systems 14:e2022MS003025. https://doi.org/10.1029/2022MS003025
Wright, K., J. Hariharan, P. Passalacqua, G. Salter, and M. P. Lamb. 2022b. From Grains to Plastics: Modeling Nourishment Patterns and Hydraulic Sorting of Fluvially Transported Materials in Deltas. Journal of Geophysical Research: Earth Surface 127e2022JF006769. https://doi.org/10.1029/2022JF006769
Zhang, X., K. Wright, P. Passalacqua, M. Simard, and S. Fagherazzi. 2022. Improving Channel Hydrological Connectivity in Coastal Hydrodynamic Models With Remotely Sensed Channel Networks. Journal of Geophysical Research: Earth Surface 127:e2021JF006294. https://doi.org/10.1029/2021JF006294