Documentation Revision Date: 2016-09-29
Data Set Version: Version 2
|
Please note that this version was superseded by Version 3 on 2016/09/27.
Follow this link to the latest version: Thornton, P.E., M.M. Thornton, and R.S. Vose. 2016. Daymet V3: Annual Tile Summary Cross-Validation Statistics for North America, Hawaii ORNL DAAC, Oak Ridge, Tennessee, USA. http://dx.doi.org/10.3334/ORNLDAAC/1348 Contact ORNL DAAC User Services (support-ornl@earthdata.nasa.gov) if you need additional assistance. |
Summary
Summarized by tile are average and period-of-record mean absolute error (MAE) and bias statistics for the input weather observations of tmin, tmax, and prcp. Also available are tile-wide values of total ground weather stations, total station-days evaluated, and mean observed input parameter values. Summary statistics are also available for the Gaussian distribution functions, used in the Daymet interpolation method, as mean and standard deviations of the radius of the kernel weights and x, y, and z components of the 3-dimensional regression formula.
The data are distributed as shape files that represent the 2-degree by 2-degree tile structure in which the Daymet model estimates are derived. The annual cross-validation statistics are provided as a separate shape file for the North American domain for each of the three variables for each year of available Daymet input data (i.e., 3 files/year for 35 years).
Also provided are the complete time series of annual summary cross-validation statistics for the three Daymet input parameters in comma separated files (*.csv). There is one file for each of the three parameters for each tile.
Figure 1 shows four different annual tile-wide summary cross-validation statistics for 1980 daily precipitation; mean absolute error (MAE) for single day predictions ("daymae"), mean prediction bias ("bias"), mean absolute error for period of record predictions ("pormae"), and mean absolute error as a percentage for period of record predictions (“pormpae”).
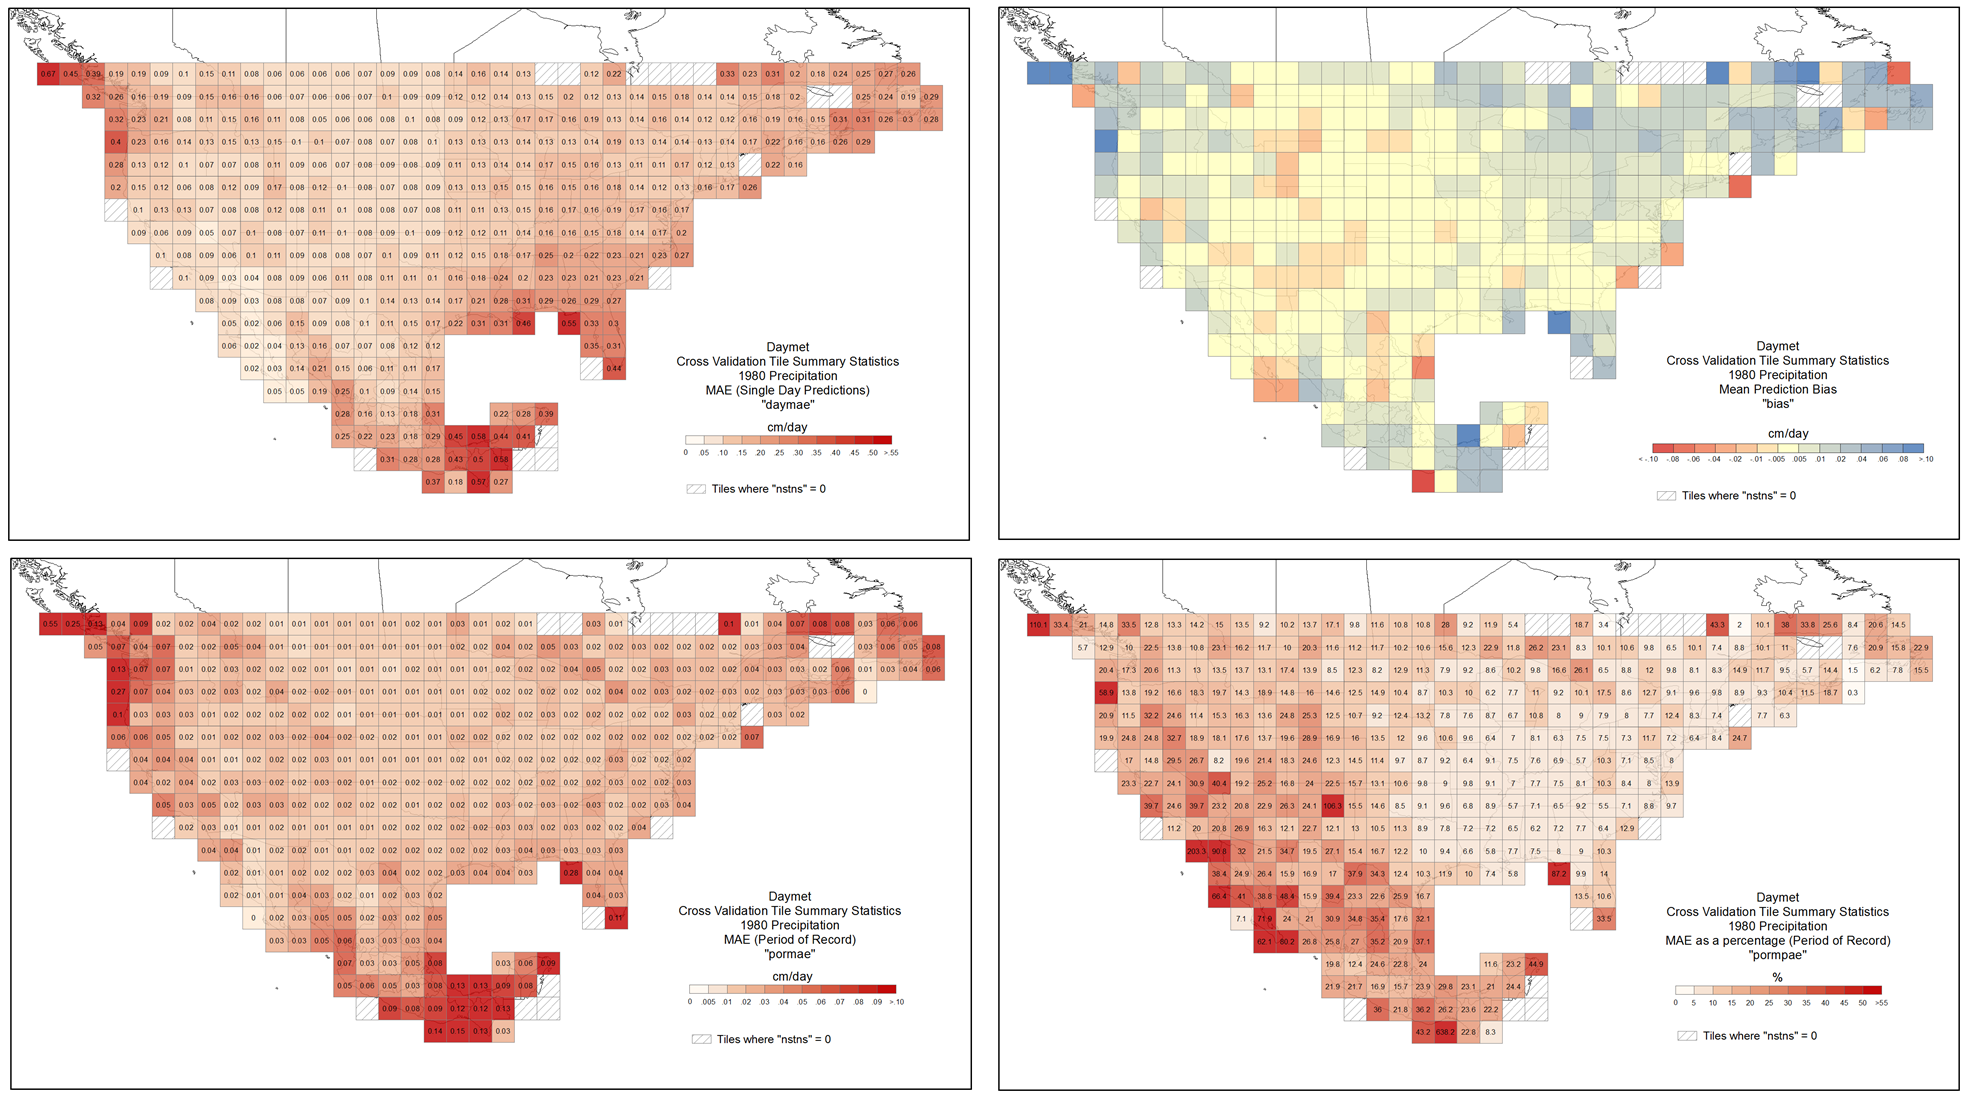
Figure 1. Annual summary cross-validation statistics for 1980 precipitation: MAE of prediction for daymae, pormae, pormpae, and mean bias for 2-degree tiles.
Citation
Thornton, P.E., and M.M. Thornton. 2016. Daymet: Annual 2-degree Tile Summary Cross-Validation Statistics for North America. ORNL DAAC, Oak Ridge, Tennessee, USA. http://dx.doi.org/10.3334/ORNLDAAC/1303
Table of Contents
- Data Set Overview
- Data Characteristics
- Application and Derivation
- Quality Assessment
- Data Acquisition, Materials, and Methods
- Data Access
- References
- Data Set Revisions
Data Set Overview
Project: Daymet
This data set provides annual tile-wide summary cross-validation statistics for minimum temperature (tmin), maximum temperature (tmax), and daily total precipitation (prcp) of the Daymet data set (Daymet: Daily Surface Weather Data on a 1-km Grid for North America, Version 2), for the temporal period 1980 through 2014, the most recently processed calendar year of Daymet. The cross-validation statistics were generated by the Daymet model algorithm from the station-based daily observations and predictions and summarized for each of the 2-degree by 2-degree tile regimen in which Daymet is derived.
Average and period-of-record mean absolute error (MAE) and bias statistics for the input weather observations of tmin, tmax, and prcp were calculated along with tile-wide values of total ground weather stations per tile, total station days, and mean observed values per tile. The Gaussian distribution kernel weights and 3-dimensional regression components from the interpolation methodology are reported for the three variables.
Related Data Set:
Thornton, P.E., M.M. Thornton, B.W. Mayer, N. Wilhelmi, Y. Wei, R. Devarakonda, and R.B. Cook. 2014. Daymet: Daily Surface Weather Data on a 1-km Grid for North America, Version 2. Data set. Available on-line [http://daac.ornl.gov] from Oak Ridge National Laboratory Distributed Active Archive Center, Oak Ridge, Tennessee, USA. http://dx.doi.org/10.3334/ORNLDAAC/1219
Data Characteristics
The annual cross-validation statistics are provided for North America as a separate shape file for each of the three variables for each year of available Daymet input data (i.e., 3 files/year for 35 years).
Also the complete time series of annual cross-validation statistics for a variable is provided in a single comma separated file (*.csv). There is one file for each of the three variables.
Shape Files
Daymet cross-validation data are available as shape files for North America – Mexico, USA, and Canada south of 52N – with a spatial resolution of 2 degrees.
The shape files geometric polygon structure represents the 2 degree x 2 degree tile “grid” in which the Daymet model is processed and output.
Three shape files with cross-validation statistical information for each of the three Daymet daily weather input variables minimum temperature (tmin), maximum temperature (tmax), and total precipitation (prcp) are available each year of available Daymet data. There are a total of 105 shape files.
The North American shape files are zipped for convenience and contain five files (*.dbf,*.prj,*.shp,*.shp.xml, and *.shx).
File names follow this syntax: xval_pppp_yyyy.shp (*.zip)
Where:
xval distinguishes these as Daymet cross-validation data files;
pppp is the respective Daymet input meteorological variable (tmin, tmax, and prcp); and
yyyy is year.
Data Dictionary:
Fields within each shape file contain the tile-wide summary cross-validation statistics.
Shape files for temperature (tmin and tmax) Cross-Validation Statistics have these attributes.
|
Field |
Units/format |
Description |
|
Xmin |
decimal degrees |
Approximate minimum longitude of tile |
|
Xmax |
decimal degrees |
Approximate maximum longitude of tile |
|
Ymin |
decimal degrees |
Approximate minimum latitude of tile |
|
Ymax |
decimal degrees |
Approximate maximum latitude of tile |
|
year |
YYYY |
Daymet processing year |
|
tileid |
Daymet Tile ID |
|
|
nstns3x3 |
stations |
number of stations in 3x3 tile region surrounding the central tile (tileid) |
|
nstns |
stations |
number of stations evaluated (tileid) |
|
nstndays |
days |
number of station-days evaluated (tileid) |
|
rad90mean |
meter |
mean: radius capturing 90% of filter kernel weight |
|
rad90std |
meter |
standard deviation: radius capturing 90% of filter kernel weight |
|
daymae |
degrees Celsius |
mean absolute error for single-day predictions |
|
pormae |
degrees Celsius |
mean absolute error for period-of-record predictions |
|
bias |
degrees Celsius |
mean prediction bias |
|
tamean |
degrees Celsius |
mean observed temperature (tmin and tmax) |
|
xlrmean |
degrees C/meter |
3-d regression: mean x-component |
|
xlrstdv |
degrees C/meter |
3-d regression: among-station std dev of x-component |
|
ylrmean |
degrees C/meter |
3-d regression: mean y-component |
|
ylrstdv |
degrees C/meter |
3-d regression: among-station std dev of y-component |
|
zlrmean |
degrees C/meter |
3-d regression: mean z-component |
|
zlrstdv |
degrees C/meter |
3-d regression: among-station std dev of z-component |
Shape files for precipitation (prcp) Cross-Validation Statistics have these attributes.
|
Field |
Units/format |
Description |
|
Xmin |
decimal degrees |
Approximate minimum longitude of tile |
|
Xmax |
decimal degrees |
Approximate maximum longitude of tile |
|
Ymin |
decimal degrees |
Approximate minimum latitude of tile |
|
Ymax |
decimal degrees |
Approximate maximum latitude of tile |
|
year |
YYYY |
Daymet processing year |
|
tileid |
Daymet Tile ID |
|
|
nstns3x3 |
stations |
number of stations in 3x3 tile region surrounding the central tile (tileid) |
|
nstns |
stations |
number of stations evaluated (tileid) |
|
nstndays |
days |
number of station-days evaluated (tileid) |
|
rad90mean |
meter |
mean: radius capturing 90% of filter kernel weight |
|
rad90std |
meter |
standard deviation: radius capturing 90% of filter kernel weight |
|
daymae |
cm/day |
mean absolute error for single-day predictions |
|
pormae |
cm/day |
mean absolute error for period-of-record predictions |
|
pormpae |
% |
mean absolute error as a percentage, for period of record predictions |
|
bias |
cm/day |
mean prediction bias |
|
ppmean |
cm/day |
mean observed daily total precipitation |
|
xlrmean |
1/meter |
3-d regression: mean x-component |
|
xlrstdv |
1/meter |
3-d regression: among-station std dev of x-component |
|
ylrmean |
1/meter |
3-d regression: mean y-component |
|
ylrstdv |
1/meter |
3-d regression: among-station std dev of y-component |
|
zlrmean |
1/meter |
3-d regression: mean z-component |
|
zlrstdv |
1/meter |
3-d regression: among-station std dev of z-component |
User’s Notes
- When “nstns” is zero (0), no input weather station data are available within that tile. All attributes are recorded as nodata (-9999) or "nan".
- When “nstns” have very low values (e.g. 1, 2, or 3) denoting limited input data available for that tile, values for the 3-dimensional regression components may be set to “nan” where the regressions algorithm failed.
- Floating point precision has been carried forward from the Daymet model for all attributes.
Spatial Data Properties
Spatial Representation: vector
Vector Format: shape file
Nodata Value: -9999
Spatial Reference Properties
Type: Geographic
"GEOGCS['GCS_WGS_1984',
DATUM['WGS_1984',
SPHEROID['WGS_84',6378137.0,298.257223563]],
PRIMEM['Greenwich',0.0],
UNIT['Degree',0.0174532925199433]]"
Comma Separated Files
The complete time series (1980-2014) of annual cross-validation statistics for a variable is provided in a single comma separated file (*.csv) -- one file for each of the three variables.
File names follow this syntax: xval_pppp_yyyy-yyyy.csv
Where:
xval distinguishes these as Daymet cross-validation data files;
pppp is the respective Daymet input meteorological variable (tmin, tmax, and prcp); and
yyyy-yyyy is the range of annual summary statistics included in the file.
Data File Columns:
The first column in the *.csv files (pppp) indicates the variable and the remaining columns are the same as the attribute fields in the respective temperature and precipitation shape files.
Example data records: xval_tmin_1980-2014.csv
|
pppp,year,tileid,nstns3x3,nstns,nstndays,rad90mean,rad90stdv,daymae,pormae,bias,tamean,xlrmean,xlrstdv,ylrmean,ylrstdv,zlrmean,zlrstdv tmin,1980,9402,274,7,2440,70869.69598,3407.694504,2.247534956,1.569762955,-0.036558511,19.78422131,-1.63E-06,1.84E-05,-5.50E-07,2.05E-05,-0.005625534,0.00070347 tmin,1980,9403,349,1,365,67391.66637,0,1.408607311,0.362330488,-0.362330488,21.44794521,-9.75E-06,0,1.86E-05,0,-0.0055475,0 … tmin,2014,12661,23,1,359,269892.1173,0,2.086786393,1.725761521,1.725761521,-3.542896936,nan,nan,nan,nan,nan,nan tmin,2014,12662,23,6,2069,222924.8585,26394.05484,1.495518096,0.671129179,-0.241127927,-1.305219913,7.61E-06,2.87E-06,-8.33E-06,2.53E-06,-0.00783864,0.001134132 tmin,2014,12663,27,0,0,-9999,-9999,-9999,-9999,-9999,-9999,-9999,-9999,-9999,-9999,-9999,-9999 |
Example data records: xval_tmax_1980-2014.csv
|
pppp,year,tileid,nstns3x3,nstns,nstndays,rad90mean,rad90stdv,daymae,pormae,bias,tamean,xlrmean,xlrstdv,ylrmean,ylrstdv,zlrmean,zlrstdv tmax,1980,9402,268,7,2470,70098.68631,3536.915168,1.598939817,0.705968608,-0.152744454,32.04473684,2.16E-05,1.58E-05,8.47E-05,2.29E-05,-0.007316183,0.00049859 tmax,1980,9403,343,2,698,65768.2673,6.410693902,3.53901007,3.336011606,-0.636168483,37.17492837,4.52E-06,6.95E-06,-3.18E-05,1.86E-05,-0.006291728,0.000134242 … tmax,2014,12661,23,1,361,269892.1173,0,1.570174058,0.808686223,0.808686223,5.394459834,nan,nan,nan,nan,nan,nan tmax,2014,12662,23,6,2080,222924.8585,26394.05484,1.581390139,0.61139589,0.066809276,6.296346154,1.34E-05,2.98E-06,-1.39E-05,3.08E-06,-0.006621289,0.001530597 tmax,2014,12663,27,0,0,-9999,-9999,-9999,-9999,-9999,-9999,-9999,-9999,-9999,-9999,-9999,-9999 |
Example data records: xval_prcp_1980-2014.csv
|
pppp,year,tileid,nstns3x3,nstns,nstndays,rad90mean,rad90stdv,daymae,pormae,pormpae,bias,ppmean,xlrmean,xlrstdv,ylrmean,ylrstdv,zlrmean,zlrstdv prcp,1980,9402,293,8,2783,49416.6094,3629.13058,0.367402143,0.14272381,43.16201199,-0.082371536,0.320970176,6.49E-09,3.37E-06,-4.16E-07,6.38E-06,8.10E-05,6.13E-05 prcp,1980,9403,371,2,730,51252.8156,18.26042728,0.177868655,0.150577116,638.1771137,0.00203571,0.124616438,-7.88E-07,5.19E-07,-4.45E-07,9.38E-07,4.07E-05,3.93E-06 … prcp,2014,12661,23,1,356,191164.8662,0,0.261805432,0.096687587,25.53091608,-0.096687587,0.378707865,3.01E-07,0,4.36E-08,0,0.000184898,0 prcp,2014,12662,22,5,1717,161737.6659,26601.34836,0.309491565,0.054964155,18.88746257,0.023351956,0.326435644,3.82E-07,8.93E-07,-7.82E-08,4.97E-07,0.000305412,0.000173946 prcp,2014,12663,24,0,0,-9999,-9999,-9999,-9999,-9999,-9999,nan,-9999,-9999,-9999,-9999,-9999,-9999 |
User’s Notes
- When “nstns” is zero (0), no input weather station data are available within that tile. All attributes are recorded as nodata (-9999) or "nan".
- When “nstns” have very low values (e.g. 1, 2, or 3) denoting limited input data available for that tile, values for the 3-dimensional regression components may be set to “nan” where the regressions algorithm failed.
- Floating point precision has been carried forward from the Daymet model for all attributes.
Application and Derivation
The Daymet cross-validation analysis are used to characterize the sensitivity of Daymet model methods to the variation of parameters and to estimate the prediction errors associated with the final selected parameters. The general cross-validation protocol is to withhold one observation at a time from a sample, generating a prediction error for the withheld case by comparing with the observed value, and repeating over all observations in the sample to generate an average prediction error. The mean absolute error and bias are the basic error prediction error statistics. MAE does not exaggerate the influence of outliers as would a root mean square error and provides a more robust parameterization framework. Both the absolute value and sign of the prediction are considered in the generation of MAE and bias, respectively.
Quality Assessment
Occurrence of No Data and Not A Number (nan) field values
For tiles that had no input weather stations located within the 2 degree by 2 degree tile processing extent (e.g. nstns = 0), there are no cross-validation data available. For these tiles, the nodata values are represented with -9999 or "nan" values. For tiles with very low weather station inputs (e.g. nstns <= 3), it is often the case that the 3-dimensional regression components calculations failed. In those cases, the regression values are represented with “nan” values in the attribute fields.
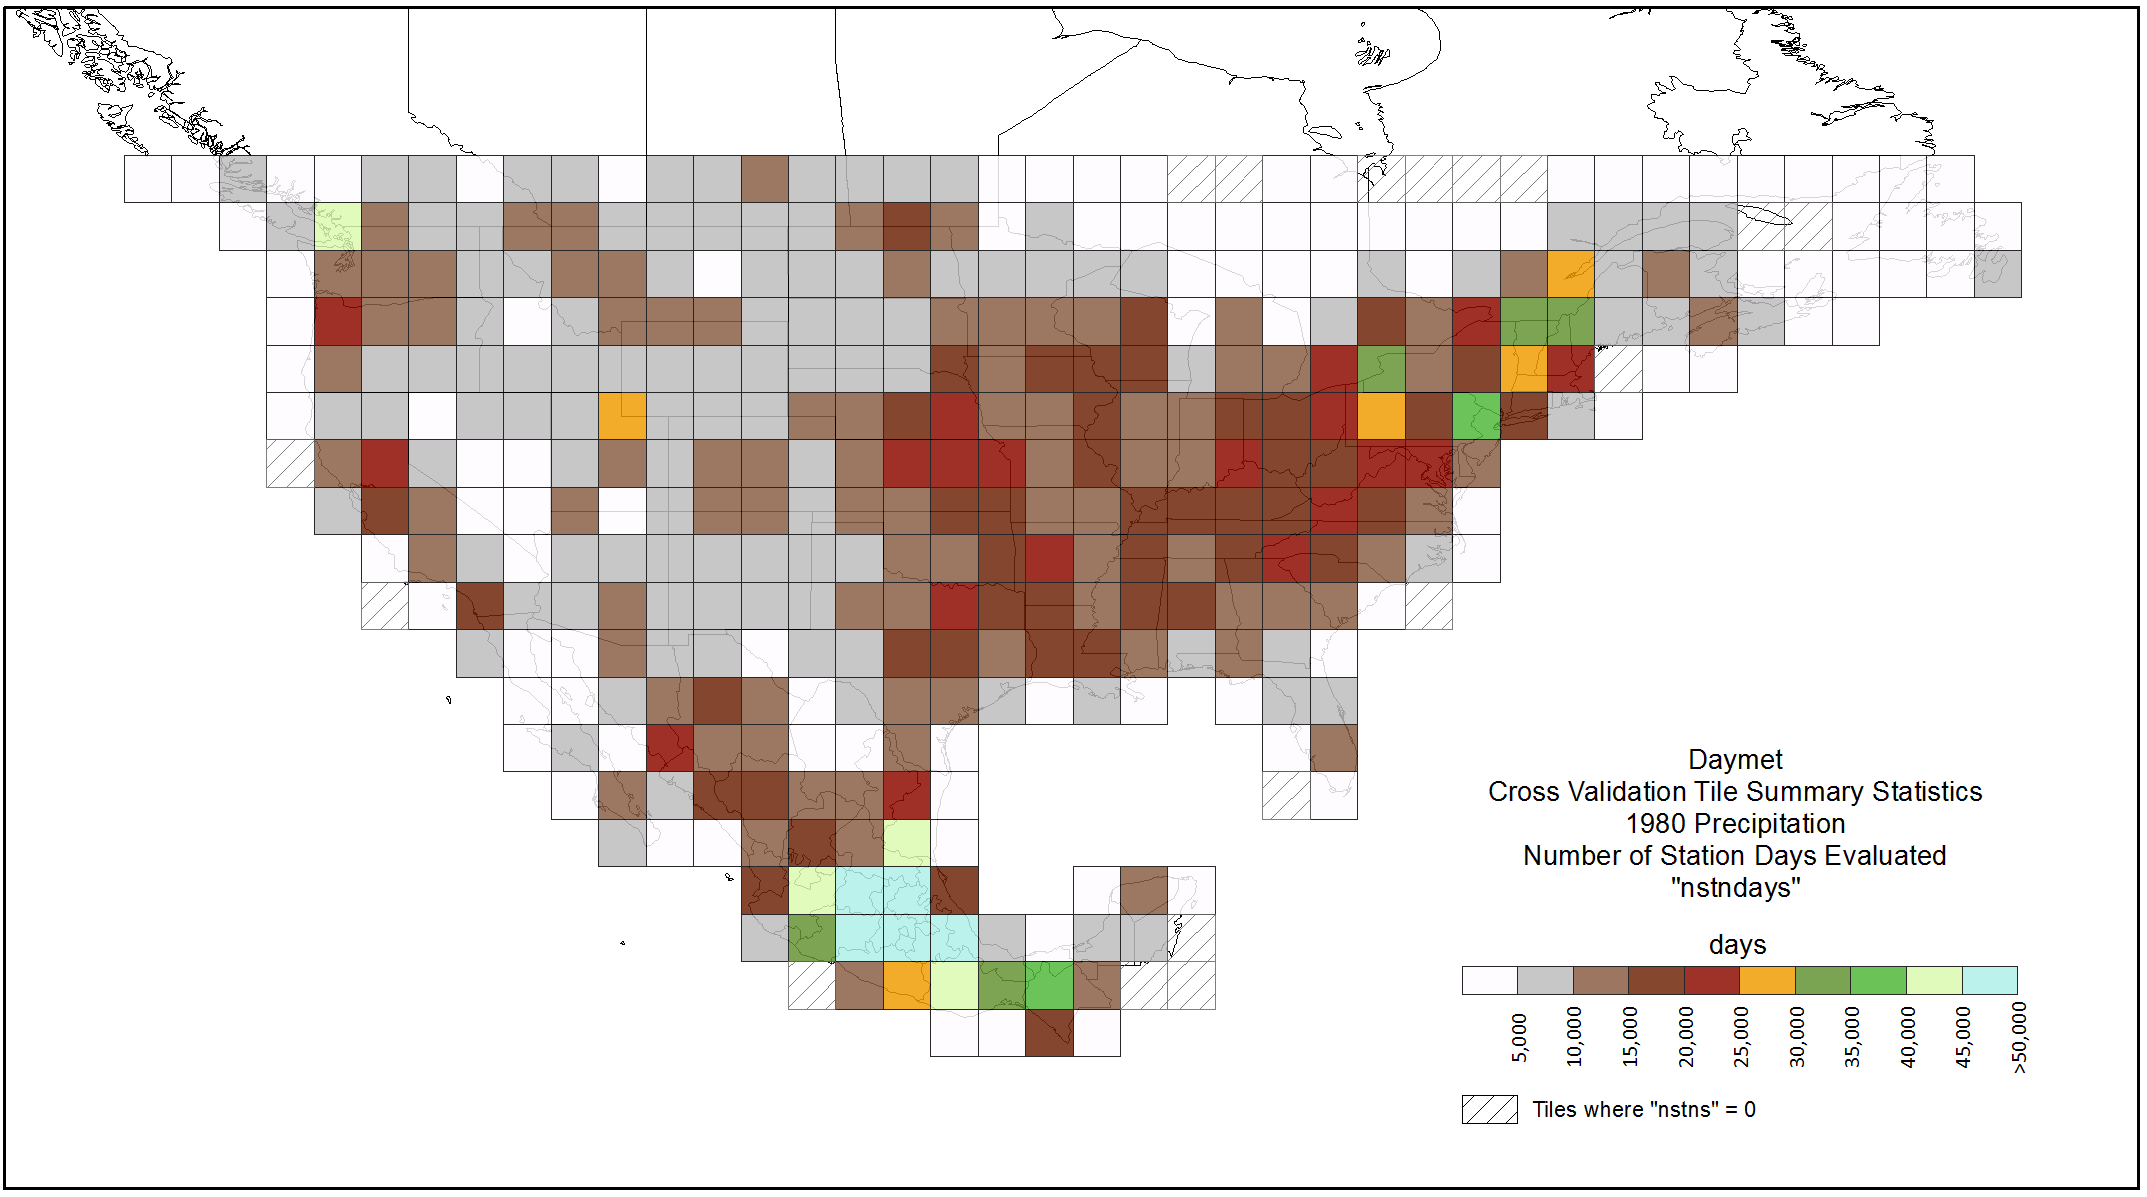
Figure 2. Daymet cross-validation showing the number of station-days evaluated, "nstndays", per 2-degree by 2-degree Daymet tile for 1980 precipitation.
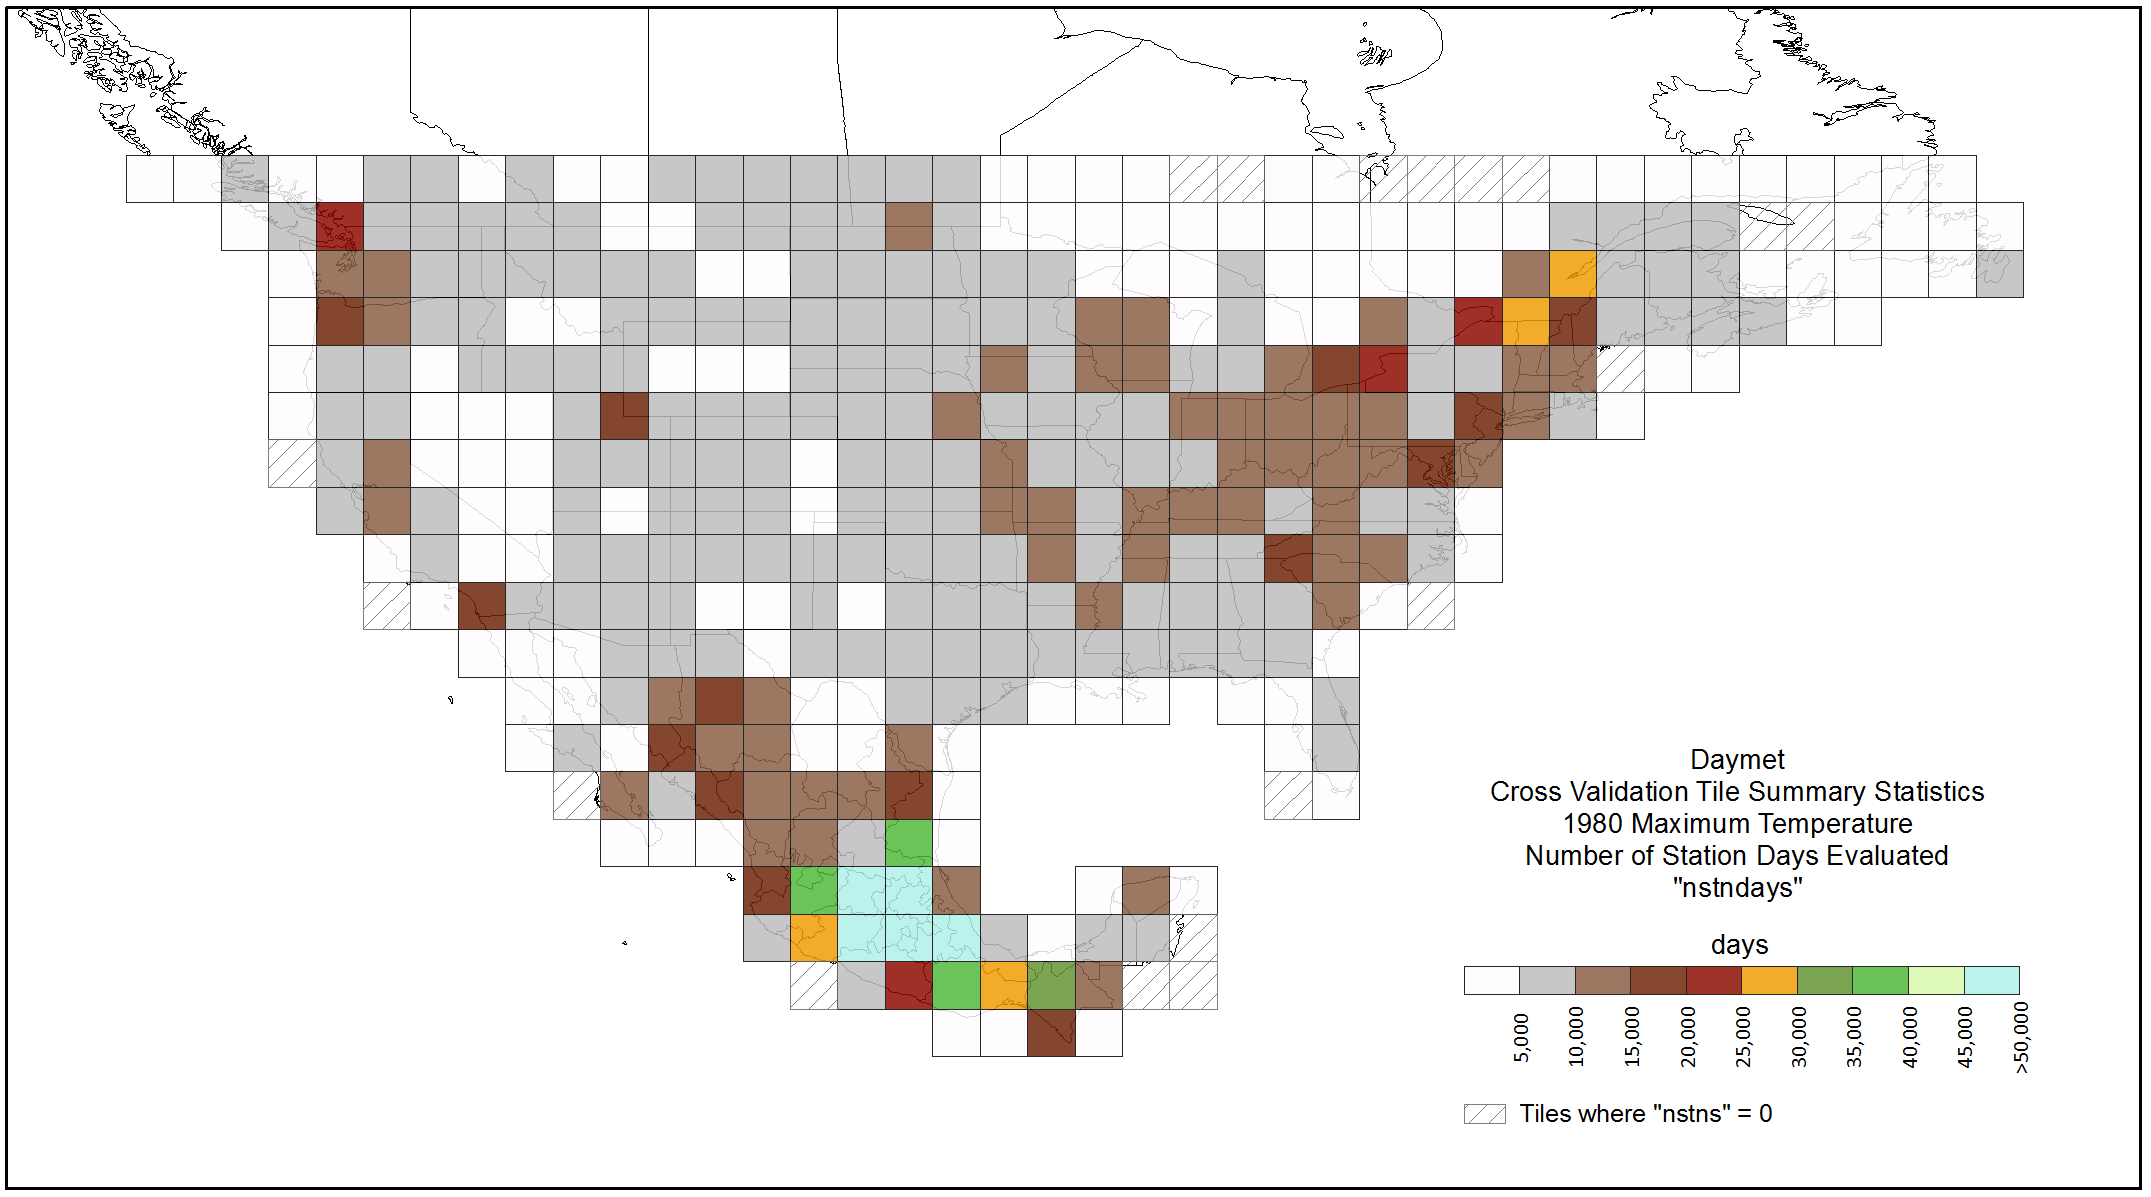
Figure 3. Daymet cross-validation showing the number of station-days evaluated, "nstndays", per 2-degree by 2-degree Daymet tile for 1980 maximum temperature.
Data Acquisition, Materials, and Methods
Cross-validation Protocol
The Daymet cross-validation summary statistics are used to test the sensitivity of Daymet model methods to the variation of parameters and to estimate the prediction errors associated with the final selected parameters.
The general cross-validation protocol is to withhold one observation at a time from the sample, generating a prediction error for the withheld case by comparing with the observed value, and repeating over all observations in the sample to generate an average prediction error. The mean absolute error and bias are the basic error prediction error statistics. MAE does not exaggerate the influence of outliers as would a root mean square error and provides a more robust parameterization framework. Both the absolute value and sign of the prediction are considered in the generation of MAE and bias, respectively.
The mean absolute error for single prediction days, or "daymae" is determined as below:

The bias for the single prediction days is determined as below:

The mean absolute error for the period of record predictions, or pormae, is determined as below:


Figure 4. Daymet cross-validation tile-wide summary statistics for 1980 maximum temperature -- mean absolute error for single day predictions ("daymae").
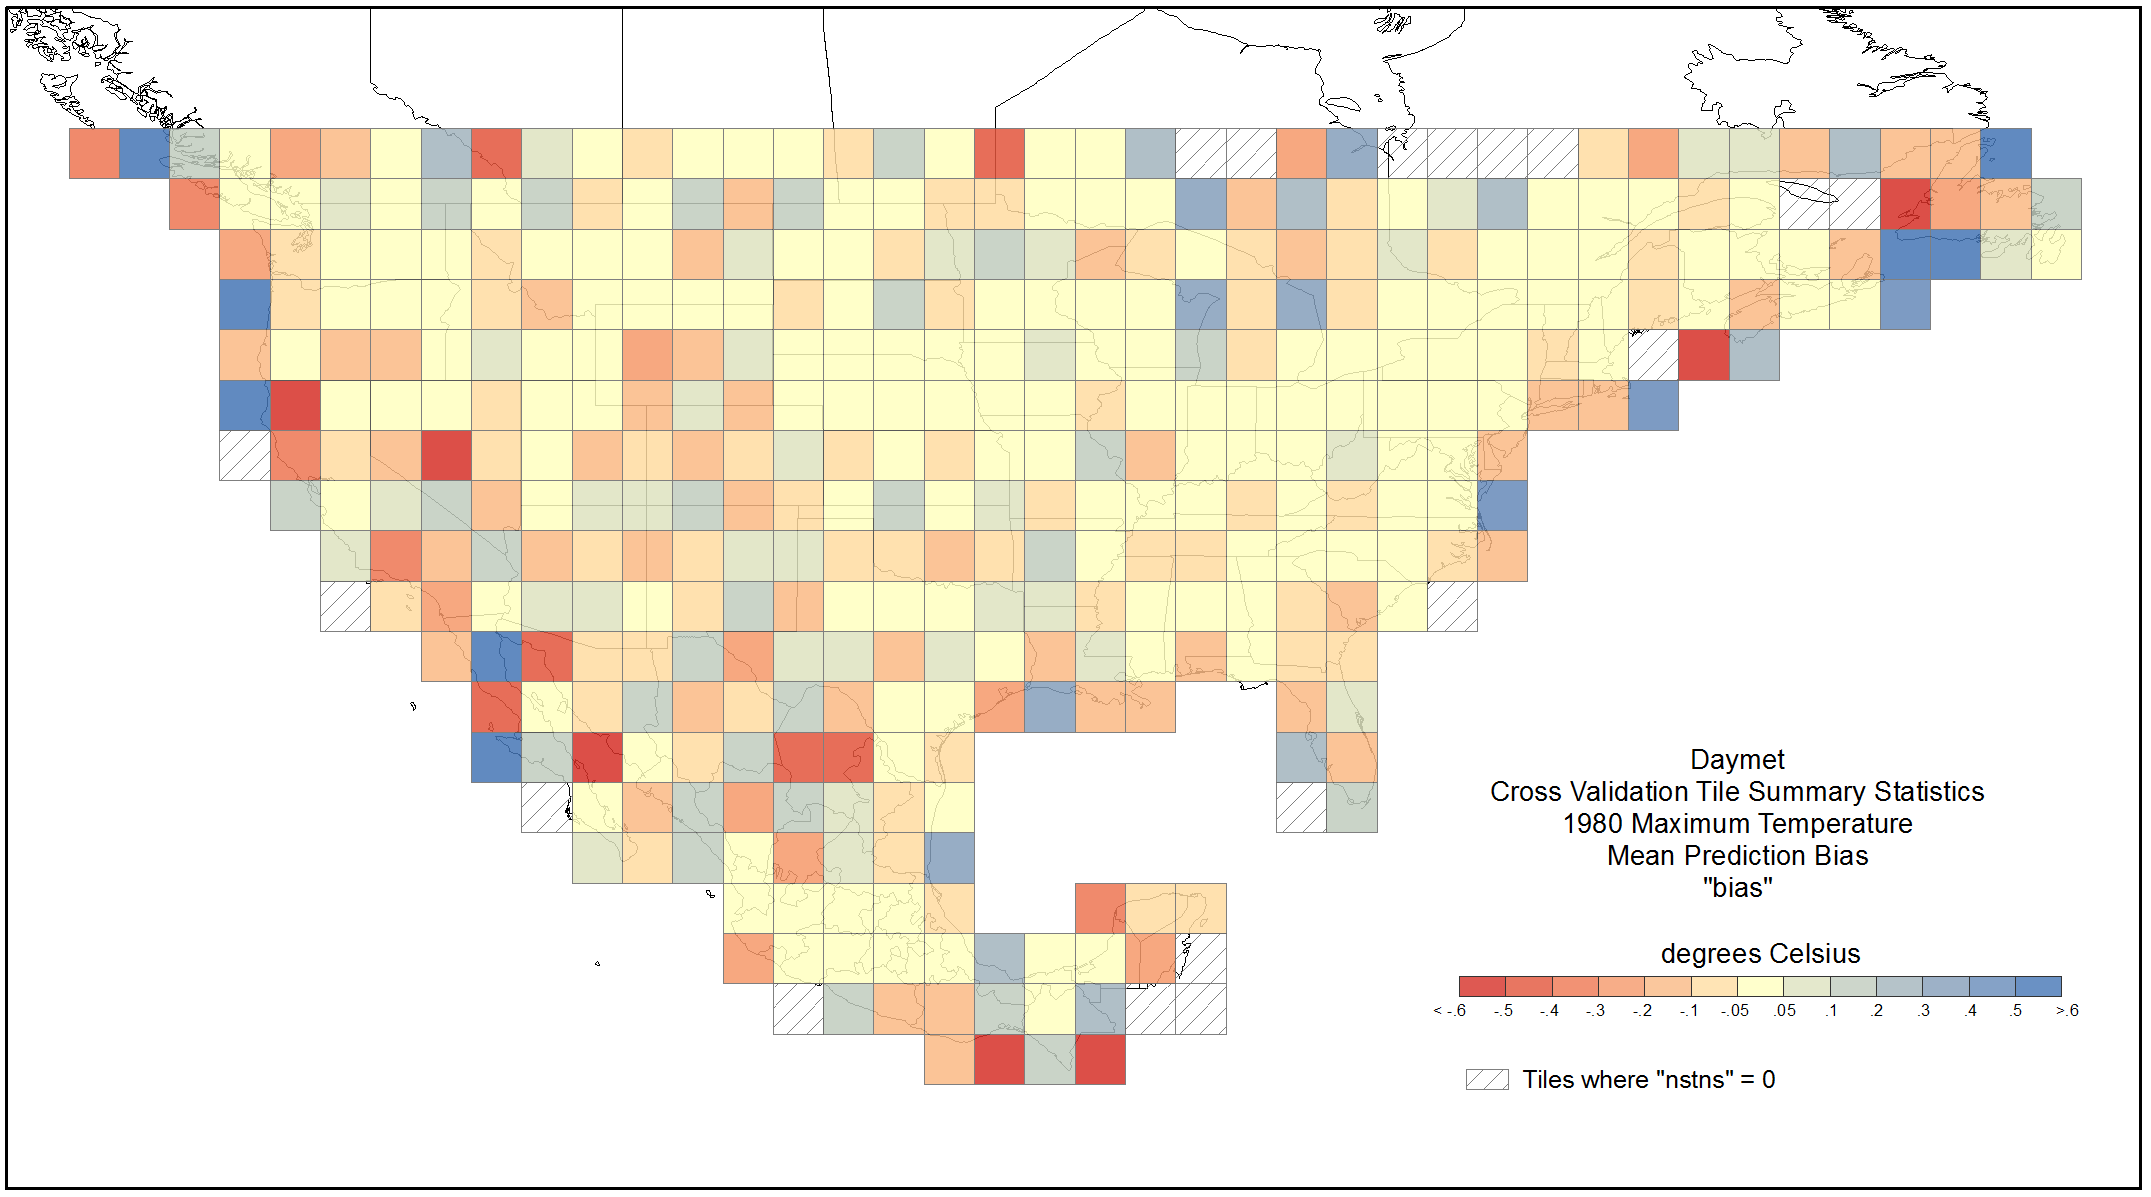
Figure 5. Daymet cross-validation tile-wide summary statistics for 1980 maximum temperature -- mean prediction bias ("bias").
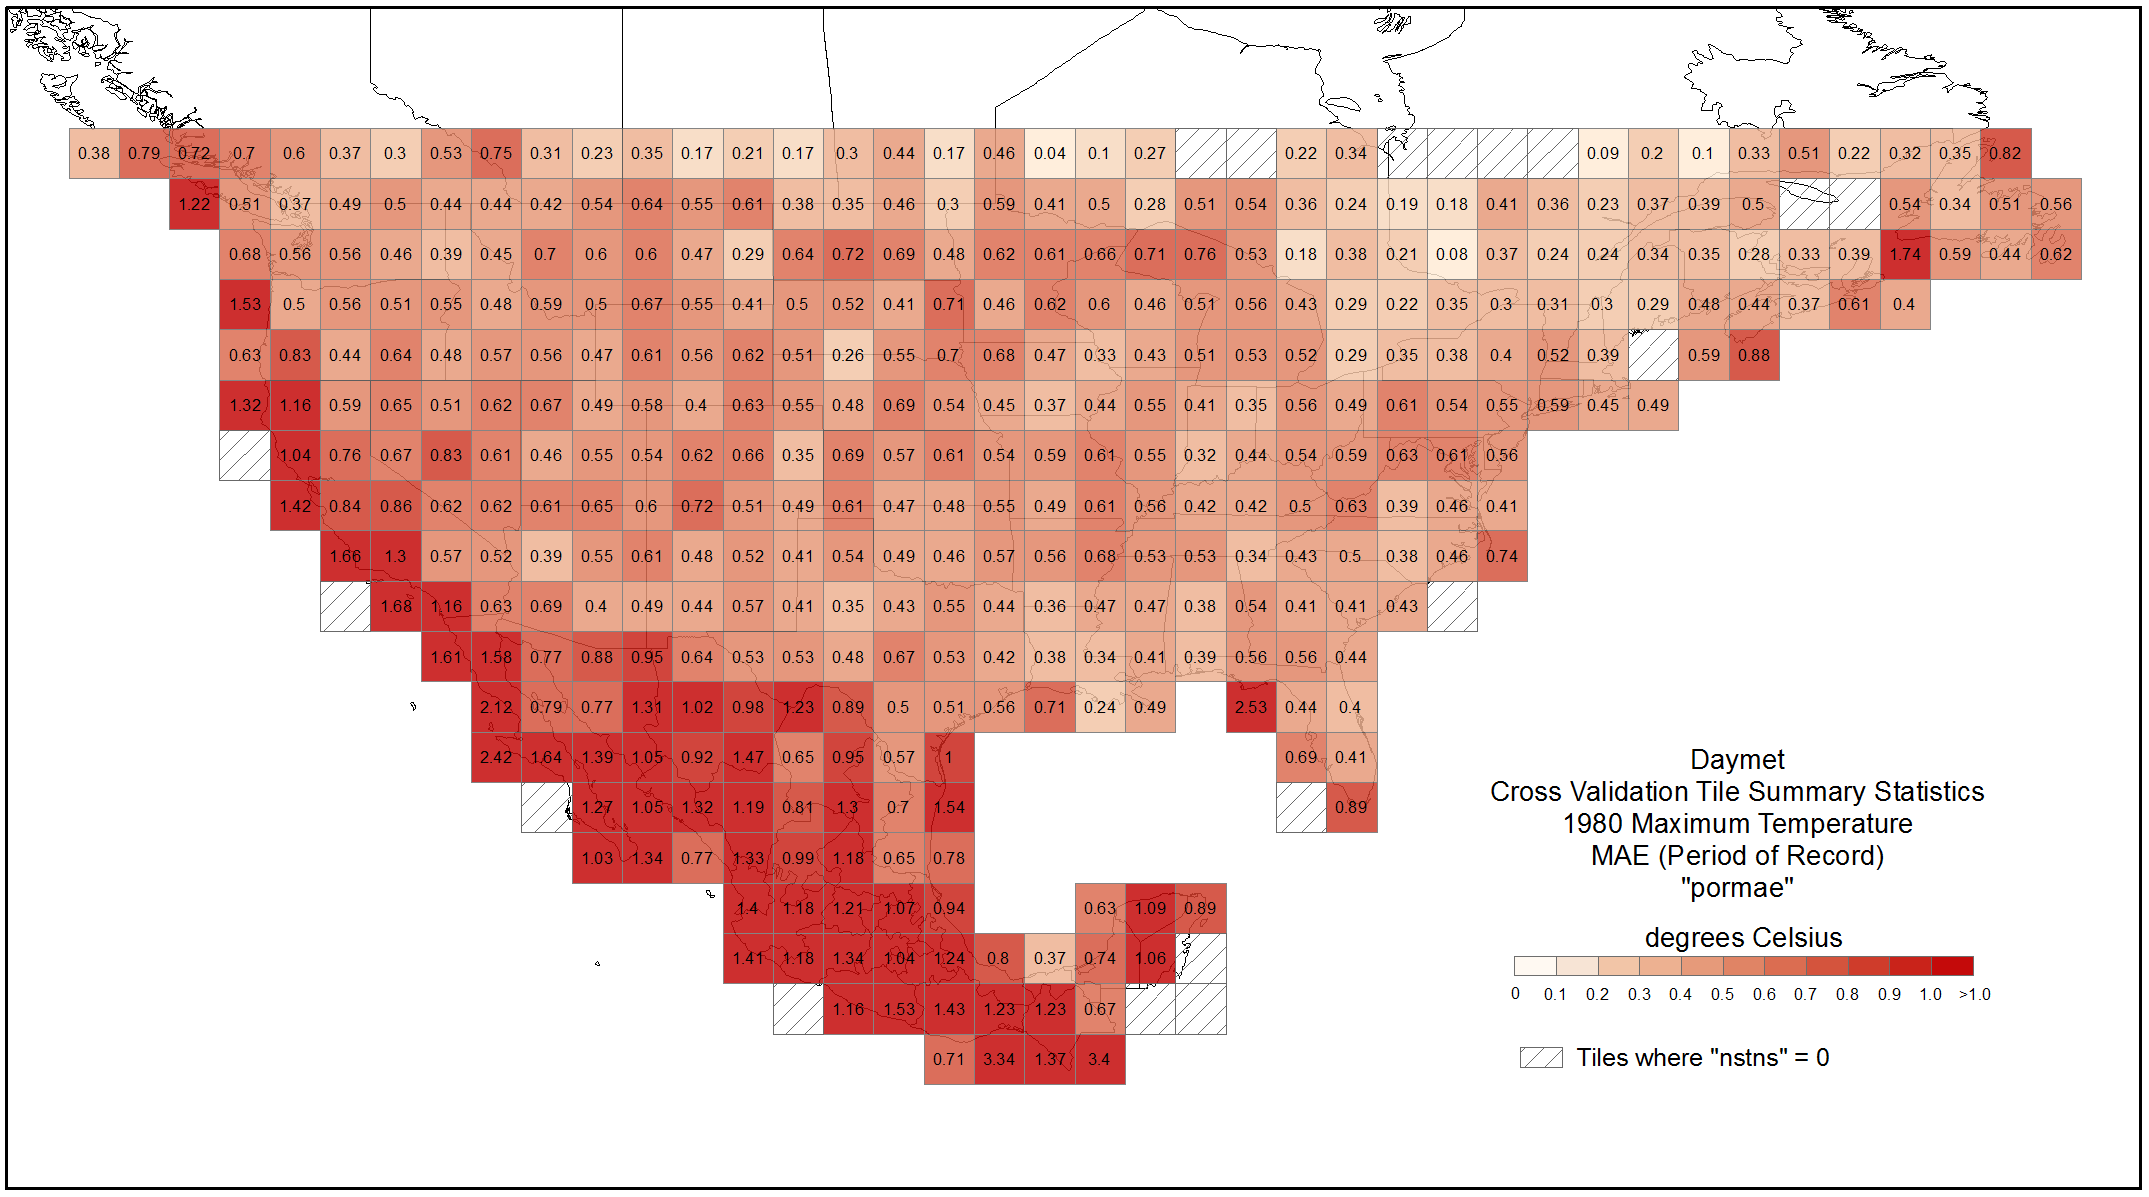
Figure 6. Daymet cross-validation tile-wide summary statistics for 1980 maximum temperature -- mean absolute error for period of record predictions ("pormae”).
Data Sources
The Daymet model requires spatially referenced ground observations of daily maximum and minimum temperature and precipitation. These observations have been obtained from a number of sources throughout this current Daymet campaign.
- The ground observations for the United States came from two main sources.
- The first is the Cooperative Summary of the Day network of weather stations archived and distributed by the National Climate Data Center (NCDC). These data have recently come under the umbrella and are distributed as part of the Global Historical Climatology Network (GHCN)-Daily (Menne et al., 2012) data set.
- The second source of surface observation data for the United States is the SNOwpack and TELemetry (SNOTEL) data set managed and distributed by the Natural Resources Conservation Service (NRCS). These stations are primarily in high elevation regions in the Western US and Alaska and are principle in maintaining critical snow pack information.
- Canadian surface observations were provided by the Government of Canada (Environment Canada) and through the GHCN-Daily data set.
- The Servicio Meteorológico Nacional provided surface weather observations within Mexico.
Data Access
These data are available through the Oak Ridge National Laboratory (ORNL) Distributed Active Archive Center (DAAC).
Daymet: Annual 2-degree Tile Summary Cross-Validation Statistics for North America
Contact for Data Center Access Information:
- E-mail: uso@daac.ornl.gov
- Telephone: +1 (865) 241-3952
References
Menne, M.J., I. Durre, R.S. Vose, B.E. Gleason, and T.G. Houston, 2012: An overview of the Global Historical Climatology Network-Daily Database. Journal of Atmospheric and Oceanic Technology, 29, 897-910, doi:10.1175/JTECH-D-11-00103.1
Thornton, P.E., M.M. Thornton, B.W. Mayer, N. Wilhelmi, Y. Wei, R. Devarakonda, and R.B. Cook. 2014. Daymet: Daily Surface Weather Data on a 1-km Grid for North America, Version 2. ORNL DAAC, Oak Ridge, Tennessee, USA. http://dx.doi.org/10.3334/ORNLDAAC/1219
Thornton, P.E., S.W. Running, and M.A. White. 1997. Generating surfaces of daily meteorological variables over large regions of complex terrain. Journal of Hydrology 190: 214 - 251. http://dx.doi.org/10.1016/S0022-1694(96)03128-9
Thornton, P.E., H. Hasenauer, and M.A. White. 2000. Simultaneous estimation of daily solar radiation and humidity from observed temperature and precipitation: An application over complex terrain in Austria. Agricultural and Forest Meteorology 104:255 - 271. http://dx.doi.org/10.1016/S0168-1923(00)00170-2
Thornton, P.E. and S.W. Running. 1999. An improved algorithm for estimating incident daily solar radiation from measurements of temperature, humidity, and precipitation. Agriculture and Forest Meteorology. 93:211 - 228. http://dx.doi.org/10.1016/S0168-1923(98)00126-9
Data Set Revisions
The ORNL DAAC is publishing Version 2.0 of the Tile Summary Cross Validation Statistics. Version and change history documentation will be provided.
ORNL DAAC Version Record:
|
Daymet Product Version |
ORNL DAAC Release Date |
Description |
|
Version 2, Tile Summary Cross Validation |
April 29, 2016 |
ORNL DAAC archived and released Version 2 of Daymet Tile Summary Cross Validation Statistics |