Documentation Revision Date: 2024-06-17
Dataset Version: 4
Summary
These data are provided to facilitate station-level cross validation analyses that can offer insights into the regional accuracy of the Daymet model for the three station-level input parameters. Regression statistics and mean absolute error can be derived to assess temporal and spatial patterns of uncertainty.
There are 450 netCDF files that contain the daily input observations and cross-validation results. Each variable-region-year combination is a separate file. There are 120 files each for North America and Hawaii, and 210 files for Puerto Rico. Provided as additional files, are 450 corresponding text files (.txt) that contain metadata for every surface weather station used in Daymet processing for the variable-region-year combinations.
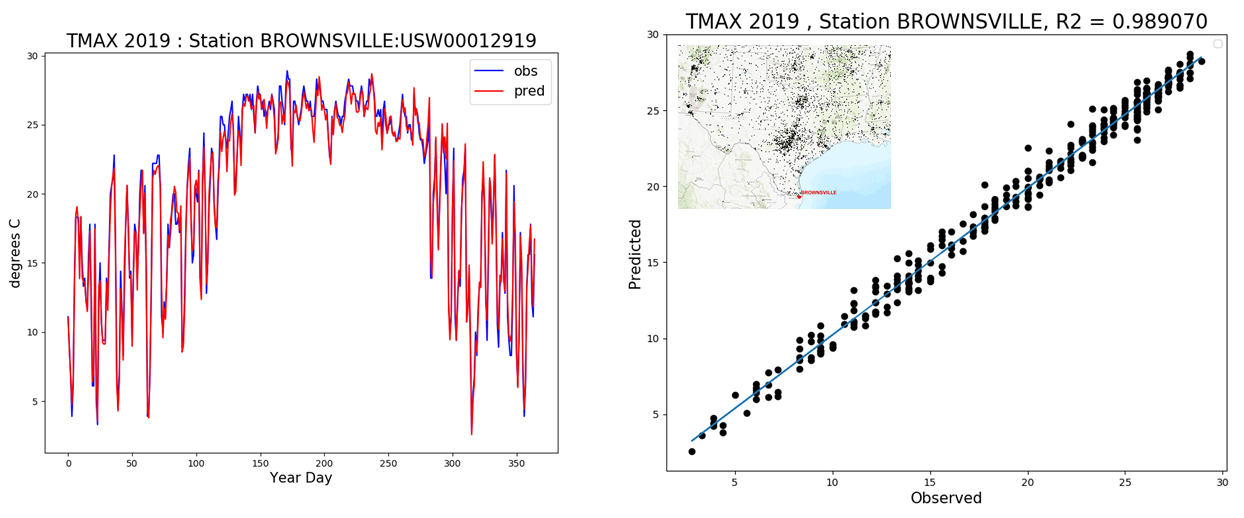
Figure 1. Plot of daily maximum temperature observed vs predicted using Daymet's cross-validation protocol (left) for one station from the Daymet 2019 cross-validation dataset. The right plot shows those data plotted on a 1:1 line with an R2 of 98.9%. The station location (Southern Texas on the Gulf Coast) is shown in the inset.
Citation
Thornton, M.M., Y. Wei, P.E. Thornton, R. Shrestha, and S-C. Kao. 2020. Daymet: Station-Level Inputs and Cross-Validation Result for North America, Version 4. ORNL DAAC, Oak Ridge, Tennessee, USA. https://doi.org/10.3334/ORNLDAAC/1850
Table of Contents
- Dataset Overview
- Data Characteristics
- Application and Derivation
- Quality Assessment
- Data Acquisition, Materials, and Methods
- Data Access
- References
- Dataset Revisions
Dataset Overview
This dataset reports the station-level daily weather observation data and the corresponding cross-validation results for three Daymet V4 model parameters: minimum temperature (tmin), maximum temperature (tmax), and daily total precipitation (prcp) across continental North America (including Canada, the United States, and Mexico), Hawaii, and Puerto Rico. Each data file contains the daily observations and cross-validation results for one parameter for each modeled region and each year, that is, from 1980 to the current calendar year for stations across continental North America and Hawaii and from 1950 to teh current year for Puerto Rico. Also included are corresponding station metadata files listing every surface weather station used in Daymet processing for each parameter, region, and year and containing the station name, station identification, latitude, and longitude.
These data are provided to facilitate station-level cross validation analyses that can offer insights into the regional accuracy of the Daymet model for the three station-level input parameters. Regression statistics and mean absolute error can be derived to assess temporal and spatial patterns of uncertainty.
Project: Daymet
Daymet provides long-term, continuous, gridded estimates of daily weather and climatology variables by interpolating and extrapolating ground-based observations through statistical modeling techniques. The Daymet data products provide driver data for biogeochemical terrestrial modeling and have myriad applications in many Earth science, natural resource, biodiversity, and agricultural research areas. Daymet weather variables include daily minimum and maximum temperature, precipitation, vapor pressure, shortwave radiation, snow water equivalent, and day length produced on a 1 km x 1 km gridded surface over continental North America and Hawaii from 1980 and over Puerto Rico from 1950 through the end of the most recent full calendar year.
Daymet is a research product of the Environmental Sciences Division at Oak Ridge National Laboratory, Oak Ridge, TN. Daymet is supported by NASA through the Earth Science Data and Information System (ESDIS) and the Terrestrial Ecology Program. Daymet algorithm and processing development is also supported by the Office of Biological and Environmental Research within the U.S. Department of Energy's Office of Science.
Related Publication
Thornton, P.E., Shrestha, R., Thornton, M. et al. Gridded daily weather data for North America with comprehensive uncertainty quantification. Sci Data 8, 190 (2021). https://doi.org/10.1038/s41597-021-00973-0
Related Datasets
Thornton, M.M., R. Shrestha, Y. Wei, P.E. Thornton, and S. Kao. 2020. Daymet: Daily Surface Weather Data on a 1-km Grid for North America, Version 4. ORNL DAAC, Oak Ridge, Tennessee, USA. https://doi.org/10.3334/ORNLDAAC/1840
Thornton, M.M., R. Shrestha, Y. Wei, P.E. Thornton, and S. Kao. 2020. Daymet: Annual Climate Summaries on a 1-km Grid for North America, Version 4. ORNL DAAC, Oak Ridge, Tennessee, USA. https://doi.org/10.3334/ORNLDAAC/1852
Thornton, M.M., R. Shrestha, Y. Wei, P.E. Thornton, and S. Kao. 2012. Daymet: Monthly Climate Summaries on a 1-km Grid for North America, Version 4. ORNL DAAC, Oak Ridge, Tennessee, USA. https://doi.org/10.3334/ORNLDAAC/1855
Acknowledgments
The continued development of the Daymet algorithm and processing is supported in part by the Energy Exascale Earth System Model (E3SM) project, funded by the U.S. Department of Energy, Office of Science, Office of Biological and Environmental Research.
Puerto Rico data for Daymet V4 is available for an extended temporal period starting in 1950. Support was provided by the DOE NGEE Tropics Phase 2 funding to extend the temporal period.
Data Characteristics
Spatial Coverage: Continental North America (Mexico, United States, Canada), Hawaii, and Puerto Rico
Spatial Resolution: Point locations
Temporal Coverage
Continental North America (Mexico, United States, Canada) and Hawaii: 1980–2019
Puerto Rico: 1950–2019
Temporal Resolution: Daily
Study Area: (All latitude and longitude given in decimal degrees)
| Site | Westernmost Longitude | Easternmost Longitude | Northernmost Latitude | Southernmost Latitude |
|---|---|---|---|---|
| Continental North America, Puerto Rico, and Hawaii |
-176.65 |
-52.6667 | 82.5167 | 14.6167 |
Data File Information
Observation and Predicted Values Files
There are 450 netCDF files that contain the daily input observations and predicted values. Each variable-region-year combination is a separate file. There are 120 files each for North America and Hawaii, and 210 files for Puerto Rico. These station-level files contain daily data from Daymet input surface weather stations as separate files for each of the three input variables, for each region, and each year of available data. Note: that there may be a different number of stations from year to year and between the three variables.
Filename format: daymet_v4_stnxval_<pppp>_<region>_<yyyy>.nc, where
<pppp> is the respective meteorological variable (tmax, tmin, and prcp)
<region> is 'na' (for continental North America), 'hi' (for Hawaii), or 'pr' (for Puerto Rico), and
<yyyy> is year (1950 through 2019).
Table 1. Parameters included in all netCDF files.
| Parameter | Abbr | Units | Description |
|---|---|---|---|
| Station Identification | station_id | The ground weather station identification (as a string value) as extracted from the GHCN-Daily input files. | |
| Station Name | station_name | The ground weather station name (as a string value) as extracted from the GHCN-Daily input files. | |
| Station Elevation | stnz | meters | The station elevation reported in the metadata readme as extracted from the GHCN-Daily input files. |
| Days Since 1950-01-01 | time | day | The day number since the beginning of the dataset. Data are in a daily time step, defined as 24-hour day based on local time from mid-night to mid-night. |
| Beginning/End of Time Range | time_bnds | day | The start and end time points for each day (24-hr period based on local time). |
| Station Index | stns | An integer station index within the netCDF file. | |
| Station Longitude | stn_lon | decimal degrees | The station longitude in WGS 84 (EPSG:4326) reported in the metadata readme as extracted from the GHCN-Daily input files. |
| Station Latitude | snt_lat | decimal degrees | The station latitude in WGS 84 (EPSG:4326) reported in the metadata readme as extracted from the GHCN-Daily input files. |
Table 2. Parameters specific to precipitation netCDF files.
| Parameter | Abbr | Units | Description |
|---|---|---|---|
| Observation | obs | mm | Station observed daily total precipitation in millimeters, sum of all forms converted to water-equivalent. Data are in a daily time step, defined as 24-hour day based on local time from mid-night to mid-night. |
| Predicted | pred | mm | Daymet model predicted daily total precipitation in millimeters, using Daymet’s cross-validation protocol, sum of all forms converted to water-equivalent. Data are in a daily time step, defined as 24-hour day based on local time from mid-night to mid-night. |
Table 3. Parameters specific to maximum and minimum temperature netCDF files.
| Parameter | Abbr | Units | Description |
|---|---|---|---|
| Observation | obs | degrees C | Station observed daily maximum (or minimum respective of file) 2-meter air temperature in degrees Celsius. Data are in a daily time step, defined as 24-hour day based on local time from mid-night to mid-night. |
| Predicted | pred | degrees C | Daymet model predicted daily maximum (or minimum respective of file) 2 m air temperature in degrees Celsius using Daymet’s cross-validation protocol. Data are in a daily time step, defined as 24-hour day based on local time from mid-night to mid-night. |
Station Metadata Files
Provided as supplementary files are 450 text (.txt) files that contain metadata information for every surface weather station included in the corresponding netCDF files for each variable, region, and year data file. These are the surface weather stations used in Daymet processing for the variable-region-year combinations. Each file represents a unique variable-region-year combination and is in a comma-separated value format.
Filename format: stnxval_<pppp>_<region>_<yyyy>.nc, where
<pppp> is the respective meteorological variable (tmax, tmin, and prcp)
<region> is 'na' (for continental North America), 'hi' (for Hawaii), or 'pr' (for Puerto Rico), and
<yyyy> is year (1950 through 2019).
Table 4. Fields in the station metadata files.
| Parameter | Abbr | Units | Description |
|---|---|---|---|
| Station Identification | stn_id | The ground weather station identification (as a string value) as extracted from the GHCN-Daily input files. | |
| Station Name | stn_name | The ground weather station name (as a string value) as extracted from the GHCN-Daily input files. | |
| Station Longitude | stn_lat | decimal degrees | The station latitude in WGS 84 (EPSG:4326) reported in the metadata readme as extracted from the GHCN-Daily input files. |
| Station Latitude | snt_lon | decimal degrees | The station longitude in WGS 84 (EPSG:4326) reported in the metadata readme as extracted from the GHCN-Daily input files. |
The Daymet Calendar
The Daymet calendar is based on a standard calendar year. All Daymet years, including leap years, have 1–365 days. For leap years, the Daymet data includes leap day (February 29) and December 31 is discarded from leap years to maintain a 365-day year.
Version Information
The data are stored and distributed as an individual CF-Compliant netCDF file for each year, region, and variable. The most current Daymet data are being delivered to the user in both Daymet software and Daymet data versions. Version information is recorded in the header file of each of the CF-netCDF files within the Global Attribute fields; Version_software and Version_data. All Daymet data are provisional and subject to revision.
Application and Derivation
The purpose of the cross-validation analysis is to provide users with details needed to evaluate the fitness of the Daymet data products for each particular application.
The cross-validation analysis treats each variable-station-year of data from the input station lists as a unique cross-validation record (CVR). Each primary variable (tmax, tmin, and prcp) is handled separately at each station location and for each year. For each such record, estimates of the primary variable are made by dropping that record from the input station list and using the estimation methods described in Thornton et al. (2021) to make estimates for the primary variable on each day of the year. From each CVR, only days with non-missing observed data are used to calculate error statistics. The number of missing days in each CVR is used to provide appropriate weights when reporting multi-station averages or time series summaries for the cross-validation results.
These CVRs include all of the relevant metadata associated with each station, to allow users to assess patterns of error in relation to station location, observation type, station network, year of observation, seasonal patterns, or other analyses as deemed appropriate by the users.
Many different summary statistics can be computed from these paired daily observations and cross-validation results, such as mean absolute error, root mean squared error or bias. Different time periods can also be evaluated, according to the user's needs.
Overall, the Daymet data have broad applications over a wide variety of research areas, including hydrology, terrestrial vegetation growth models, carbon cycle science, and regional to large scale climate change analysis. Measurements of near-surface meteorological conditions are made at many locations, but researchers are often faced with having to perform ecosystem process simulations in areas where no meteorological measurements have been taken. The gridded surfaces of the Daymet data were developed to overcome these limitations.
Quality Assessment
Within the Daymet model algorithm, the Daymet cross-validation analyses were used to test the sensitivity of Daymet model methods to the variation of parameters and to estimate the prediction errors associated with the final selected parameters. The general cross-validation protocol is to withhold one observation at a time from a sample, generate a prediction error for the withheld case by comparison with observed values within the sample, and repeat over all observations in the sample to generate an average prediction error. The sample, in this case, was derived from the distribution of nearby stations based on the moving Gaussian distribution of stations for tmax, tmin, or prcp on a given day. Interest is in both the absolute value and the sign of prediction errors generated in this manner.
Data Acquisition, Materials, and Methods
All versions of the Daymet algorithm, including this Version 4, use as its core input daily observations of minimum temperature, maximum temperature, and precipitation from a network of ground-based weather stations. The surface weather input observations for processing Daymet were obtained from the NOAA National Centers for Environmental Information's Global Historical Climatology Network (GHCN)-Daily data set (Menne et al., 2012). For the initial release of the Daymet V4 dataset, the input files were obtained on February 5, 2020, and the GHCN-Daily was version 3.27. Three separate input station files were generated for the continental North America, Puerto Rico, and Hawaii study area, and these 3 spatially distinct areas were applied separately through the Daymet algorithm.
The Daymet approach to estimating daily surface weather parameters at locations lacking instrumentation is based on a combination of interpolation and extrapolation, using inputs from multiple instrumented sites and weights for each site that reflect the spatial and temporal relationships of the estimation location to the instrumental observations. The approximate number of instrumental observations to use for each estimation is defined as a parameter for each of the primary Daymet variables. As part of a series of algorithm modifications intended to improve robustness in regions of very low station density, the Daymet V4 algorithm drops the iterative station density calculation and instead defines a search radius for each estimation location which is sized to capture exactly the average number of input stations, based on pre-calculated arrays of station distances. Given the pre-processed input station observations and the pre-calculated station lists and interpolation weights for each location in the estimation grid, two separate workflows are used to produce the primary Daymet output variables: one for the daily temperature variables (tmax and tmin) and another for the daily precipitation variable (prcp).
The changes to the Daymet algorithms implemented for V4 and the resulting differences from the V3 data products are described in detail in Thornton et al., 2021.
In addition to daily maximum and minimum temperature and daily total precipitation, the Daymet data record includes estimates of other important surface weather quantities that are not routinely observed or are available as observations from only a small fraction of the temperature and precipitation observing stations. These secondary output variables are daily total shortwave radiation (srad), daily average water vapor pressure (vp), duration of the daylight period (daylength), and a simple estimate of accumulated snowpack, measured as snowpack water equivalent (swe). The daylength estimate is based on geographic location and time of year. Estimates for the other secondary variables (srad, vp, and swe) are derived from the primary temperature and precipitation variables on the basis of theory and empirical relationships, as further described in Thornton et al. 2021.
Data Access
These data are available through the Oak Ridge National Laboratory (ORNL) Distributed Active Archive Center (DAAC).
Daymet: Station-Level Inputs and Cross-Validation Result for North America, Version 4
Contact for Data Center Access Information:
- E-mail: uso@daac.ornl.gov
- Telephone: +1 (865) 241-3952
References
Menne, M.J., I. Durre, B. Korzeniewski, S. McNeal, K. Thomas, X. Yin, S. Anthony, R. Ray, R.S. Vose, B.E. Gleason, and T.G. Houston 2012. Global Historical Climatology Network - Daily (GHCN-Daily), Version 3. NOAA National Climatic Data Center. Version 3.27-upd-2020020523. https://doi.org/10.7289/V5D21VHZ
Menne, M.J., I. Durre, R.S. Vose, B.E. Gleason, and T.G. Houston. 2012. An Overview of the Global Historical Climatology Network-Daily Database. Journal of Atmospheric and Oceanic Technology, 29: 897-910. http://doi.org/10.7289/V5D21VHZ
Thornton, M.M., R. Shrestha, Y. Wei, P.E. Thornton, and S. Kao. 2020. Daymet: Daily Surface Weather Data on a 1-km Grid for North America, Version 4. ORNL DAAC, Oak Ridge, Tennessee, USA. https://doi.org/10.3334/ORNLDAAC/1840
Thornton, M.M., R. Shrestha, Y. Wei, P.E. Thornton, and S. Kao. 2020. Daymet: Annual Climate Summaries on a 1-km Grid for North America, Version 4. ORNL DAAC, Oak Ridge, Tennessee, USA. https://doi.org/10.3334/ORNLDAAC/1852
Thornton, M.M., R. Shrestha, Y. Wei, P.E. Thornton, and S. Kao. 2012. Daymet: Monthly Climate Summaries on a 1-km Grid for North America, Version 4. ORNL DAAC, Oak Ridge, Tennessee, USA. https://doi.org/10.3334/ORNLDAAC/1855
Thornton, P.E., Shrestha, R., Thornton, M. et al. Gridded daily weather data for North America with comprehensive uncertainty quantification. Sci Data 8, 190 (2021). https://doi.org/10.1038/s41597-021-00973-0
Dataset Revisions
Note: The ORNL DAAC revised its methods for versioning datasets to be more consistent with data versioning practices at the NASA Earth Science Data and Information System (ESDIS) and the general Earth Science data community. With the revised versioning strategy, the dataset version number (including both major and minor version numbers) remain unchanged when a release only appends new data and existing data are not changed. At the time of publication of 2023 Daymet data, the version numbers of Daymet datasets, including the Version 4 and prior versions are updated as shown in the revision tables below.
ORNL DAAC Version Record for Version 4
|
ORNL DAAC Release Date |
Daymet Product Version | Description |
|---|---|---|
| April 7, 2022 | Version 4 | This release added Station-Level Inputs and Model Predicted Values for North America for year 2021. |
| April 7, 2021 | This release added Station-Level Inputs and Model Predicted Values for North America for year 2020 | |
| December 15, 2020 | This release provided Station-Level Inputs and Model Predicted Values for North America and Hawaii for years 1980-2019 and for Puerto Rico for 1950–2019. |
ORNL DAAC Release Record for Version 3
| ORNL DAAC Release Date | Daymet Product Version | Description |
|---|---|---|
| March 31, 2020 | Version 3 | This release added Station-Level Inputs and Model Predicted Values for North America for year 2019. |
| April 8, 2019 | This release added Station-Level Inputs and Model Predicted Values for North America for year 2018. | |
| July 6, 2018 | This release added Station-Level Inputs and Model Predicted Values for North America for year 2017. | |
| May 25, 2017 | This release added Station-Level Inputs and Model Predicted Values for North America for year 2016 |