Documentation Revision Date: 2023-05-25
Dataset Version: 1
Summary
These data are based on daily weather station data inputs that are not considered “archive” quality. Thus, these data should be considered provisional and still likely to change as reporting stations finalize their data.
Daymet version 4 monthly latency daily data cover the time period from January 2021 onward. This dataset will be updated on a monthly basis to add data for a previous month. Data are available in netCDF-4 file format. Each file contains one month of daily data for one variable.
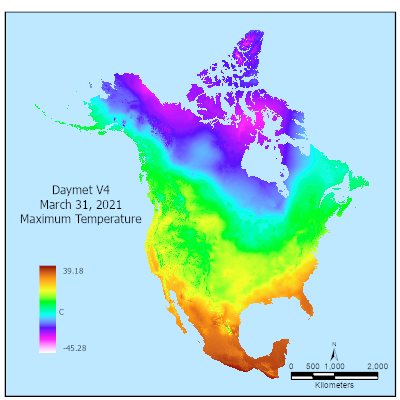
Figure1: Daymet V4 maximum daily temperature shown for March 31, 2021.
Citation
Thornton, M.M., R. Shrestha, P.E. Thornton, S-C. Kao, Y. Wei, and B.E. Wilson. 2021. Daymet Version 4 Monthly Latency: Daily Surface Weather Data. ORNL DAAC, Oak Ridge, Tennessee, USA. https://doi.org/10.3334/ORNLDAAC/1904
Table of Contents
- Dataset Overview
- Data Characteristics
- Application and Derivation
- Quality Assessment
- Data Acquisition, Materials, and Methods
- Data Access
- References
- Dataset Revisions
Dataset Overview
This dataset provides Daymet Version 4 daily data on a monthly cycle as 1-km gridded estimates of daily weather variables for minimum temperature (tmin), maximum temperature (tmax), precipitation (prcp), shortwave radiation (srad), vapor pressure (vp), snow water equivalent (swe), and day length. Data are derived from the Daymet version 4 software where the primary inputs are daily observations of near-surface maximum and minimum air temperature and daily total precipitation from weather stations. The main algorithm to estimate primary Daymet variables (tmax, tmin, and prcp) at each Daymet grid is based on a combination of interpolation and extrapolation, using inputs from multiple weather stations and weights that reflect the spatial and temporal relationships between a Daymet grid and the surrounding weather stations. Secondary variables (srad, vp, and swe) are derived from the primary variables (tmax, tmin, and prcp) based on atmospheric theory and empirical relationships. The day length (dayl) estimate is based on geographic location and time of year. Data are available for the Continental North America, Puerto Rico, and Hawaii as separate spatial layers in a Lambert Conformal Conic projection and are distributed in standardized Climate and Forecast (CF)-compliant netCDF file formats.
These data are based on daily weather station data inputs that are not considered “archive” quality. Thus, these data should be considered provisional and still likely to change as reporting stations finalize their data.
Daymet version 4 monthly latency daily data cover the time period from January 2021 onward. This dataset will be updated on a monthly basis to add data for a previous month. Data are available in netCDF-4 file format. Each file contains one month of daily data for one variable.
Project: Daymet
Daymet provides continuous, gridded estimates of daily weather and climatology variables by interpolating and extrapolating ground-based observations through statistical modeling techniques. The Daymet data products provide driver data for biogeochemical terrestrial modeling and have myriad applications in many Earth science, natural resource, biodiversity, and agricultural research areas. Daymet weather variables include daily minimum and maximum temperature, precipitation, vapor pressure, shortwave radiation, snow water equivalent, and day length produced on a 1 km x 1 km gridded surface over continental North America and Hawaii from 1980 and over Puerto Rico from 1950 through the end of the most recent full calendar year.
Daymet is a research product of the Environmental Sciences Division at Oak Ridge National Laboratory, Oak Ridge, TN. Daymet is supported by NASA through the Earth Science Data and Information System (ESDIS) and the Terrestrial Ecology Program. Daymet algorithm and processing development is also supported by the Office of Biological and Environmental Research within the U.S. Department of Energy's Office of Science.
Related Publication
Thornton, Peter E., Rupesh Shrestha, Michele Thornton, Shih-Chieh Kao, Yaxing Wei, and Bruce E. Wilson. 2021. “Gridded Daily Weather Data for North America with Comprehensive Uncertainty Quantification.” Scientific Data 8 (1). https://doi.org/10.1038/s41597-021-00973-0.
Related Dataset(s)
Thornton, M.M., R. Shrestha, Y. Wei, P.E. Thornton, S. Kao, and B.E. Wilson. 2020. Daymet: Daily Surface Weather Data on a 1-km Grid for North America, Version 4. ORNL DAAC, Oak Ridge, Tennessee, USA. https://doi.org/10.3334/ORNLDAAC/1840
Thornton, M.M., Y. Wei, P.E. Thornton, R. Shrestha, S. Kao, and B.E. Wilson. 2020. Daymet: Station-Level Inputs and Cross-Validation Result for North America, Version 4. ORNL DAAC, Oak Ridge, Tennessee, USA. https://doi.org/10.3334/ORNLDAAC/1850
Acknowledgments
The continued development of the Daymet algorithm and processing is supported in part by the Energy Exascale Earth System Model (E3SM) project, funded by the U.S. Department of Energy, Office of Science, Office of Biological and Environmental Research.
Daymet is supported by NASA through the Earth Science Data and Information System (ESDIS) and the Terrestrial Ecology Program.
Data Characteristics
Spatial Coverage: Continental North America (Mexico, United States, Canada), Puerto Rico, Hawaii
Spatial Resolution: 1-km grid
Temporal Coverage: The dataset covers the time period 2021-01-01 - the last full calendar month produced on an approximated mid-month update
Temporal Resolution: Daily
Study Areas (All latitude and longitude given in decimal degrees)
| Site | Westernmost Longitude | Easternmost Longitude | Northernmost Latitude | Southernmost Latitude |
|---|---|---|---|---|
| Continental North America | -178.1333 | -53.0567 | 82.9143 | 14.0749 |
| Puerto Rico | -67.9927 | -64.1195 | 19.9381 | 16.8444 |
| Hawaii | -160.3055 | -154.7715 | 23.5186 | 17.9539 |
Data File Information
Filename format: daymet_v4ll_daily_<region>_<pppp>_<yyyy><mm>.nc, where
<region> 'na' (continental North America), 'pr' (Puerto Rico), 'hi' (Hawaii)
<pppp> is the respective parameter abbreviation (dayl, prcp, srad, swe, tmax, tmin, and vp),
<yyyy><mm> is year and month
Example filename: daymet_v4ll_daily_na_tmax_202101.nc
Table 1. Parameters, abbreviations, units, and descriptions.
| Parameter | Abbr | Units | Description |
|---|---|---|---|
| Day length | dayl | s/day | Duration of the daylight period in seconds per day. This calculation is based on the period of the day during which the sun is above a hypothetical flat horizon |
| Precipitation | prcp | mm | Daily total precipitation in millimeters. Sum of all forms of precipitation converted to a water-equivalent depth. |
| Shortwave radiation | srad | W/m2 | Incident shortwave radiation flux density in watts per square meter, taken as an average over the daylight period of the day. Note: Daily total radiation (MJ/m2/day) can be calculated as follows: ((srad (W/m2) * dayl (s/day)) / l,000,000) |
| Snow water equivalent | swe | kg/m2 | Snow water equivalent in kilograms per square meter. The amount of water contained within the snowpack. |
| Maximum air temperature | tmax | degrees C | Daily maximum 2 m air temperature in degrees Celsius. |
| Minimum air temperature | tmin | degrees C | Daily minimum 2 m air temperature in degrees Celsius. |
| Water vapor pressure | vp | Pa | Water vapor pressure in pascals. Daily average partial pressure of water vapor. |
Coordinate Reference System
Projection System: Lambert Conformal Conic
Parameters
Projection units: meters
Datum (spheroid): WGS_84
1st standard parallel: 25 deg N
2nd standard parallel: 60 deg N
Central meridian: -100 deg (W)
Latitude of origin: 42.5 deg N
False easting: 0
False northing: 0
PROJ.4: +proj=lcc +lat_1=25 +lat_2=60 +lat_0=42.5 +lon_0=-100 +x_0=0 +y_0=0 +ellps=WGS84 +units=m +no_defs
The Daymet Calendar
The Daymet calendar is based on a standard calendar year. All Daymet years, including leap years, have 1–365 days. For leap years, the Daymet data include leap day (February 29) and December 31 is discarded from leap years to maintain a 365-day year.
Application and Derivation
Access to daily high-resolution gridded surface weather data based on direct observations and over long time periods is essential for many studies and applications including vegetation, wildlife, soil health, hydrological modelling, and as driver data in Earth system models. Gridded weather products are important historical references to support ecological, agricultural, water resources management, and climate change studies, particularly in regions with sparse weather stations and/or intermittent historical meteorological observations. The gridded products provide a spatially and temporally consistent approach to assimilate available weather station data, taking into account the changes in temperature, precipitation, downwelling radiation, and humidity caused by factors such as elevation, prevailing winds, storm tracks, and proximity to large water bodies.
Quality Assessment
Within the Daymet algorithm, the Daymet cross-validation analyses were used to test the sensitivity of Daymet methods to the variation of parameters and to estimate the prediction errors associated with the final selected parameters. The general cross-validation protocol is to withhold one observation at a time from a sample, generate a prediction error for the withheld case by comparison with observed values within the sample, and repeat over all observations in the sample to generate an average prediction error. Interest is in both the absolute value and the sign of prediction errors generated in this manner.
These data are based on daily weather station data inputs that are not considered “archive” quality. Thus, these data should be considered provisional and still likely to change as reporting stations finalize their data.
Data Acquisition, Materials, and Methods
Modifications to the Daymet V4 core algorithm were necessary to allow a less than calendar year update. Due to secondary variable spin-up requirements, the Daymet core algorithm design requires 365 days, but is not constrained by a "calendar year" boundary and provides for an arbitrary STARTDAY/STOPDAY input file set. In order to handle partial year input files, incomplete calendar years are combined with prior year's data. For example, a run that provides data for April of 2021 has input daily weather station data ranging from May 2020 to April 2021. Each lower latency run will start from and require a new input dataset.
All versions of the Daymet algorithm, including this Version 4, use as its core input daily observations of minimum temperature, maximum temperature, and precipitation from a network of ground-based weather stations. The surface weather input observations for processing Daymet were obtained from the NOAA National Centers for Environmental Information's Global Historical Climatology Network (GHCN)-Daily data set (Menne et al., 2012). Three separate input station files were generated for the continental North America, Puerto Rico, and Hawaii study areas and these three spatially distinct areas were applied separately through the Daymet algorithm.
The Daymet approach to estimating daily surface weather parameters at locations lacking instrumentation is based on a combination of interpolation and extrapolation, using inputs from multiple instrumented sites and weights for each site that reflect the spatial and temporal relationships of the estimation location to the instrumental observations. The approximate number of instrumental observations to use for each estimation is defined as a parameter for each of the primary Daymet variables. As part of a series of algorithm modifications intended to improve robustness in regions of very low station density, the Daymet V4 algorithm drops the iterative station density calculation and instead defines a search radius for each estimation location which is sized to capture exactly the average number of input stations, based on pre-calculated arrays of station distances. Given the pre-processed input station observations and the pre-calculated station lists and interpolation weights for each location in the estimation grid, two separate workflows are used to produce the primary Daymet output variables: one for the daily temperature variables (tmax and tmin) and another for the daily precipitation variable (prcp).
The Daymet Version 4 methodology and dataset is described in Thornton, et al., 2021.
In addition to daily maximum and minimum temperature and daily total precipitation, the Daymet data record includes estimates of other important surface weather quantities that are not routinely observed, or are available as observations from only a small fraction of the temperature and precipitation observing stations. These secondary output variables are daily total shortwave radiation (srad), daily average water vapor pressure (vp), duration of the daylight period (dayl), and a simple estimate of accumulated snowpack, measured as snowpack water equivalent (swe). The daylength estimate is based on geographic location and time of year. Estimates for the other secondary variables (srad, vp, and swe) are derived from the primary temperature and precipitation variables on the basis of theory and empirical relationships, as further described in Thornton et al. 2021.
Data Access
These data are available through the Oak Ridge National Laboratory (ORNL) Distributed Active Archive Center (DAAC).
Daymet Version 4 Monthly Latency: Daily Surface Weather Data
Contact for Data Center Access Information:
- E-mail: uso@daac.ornl.gov
- Telephone: +1 (865) 241-3952
References
Menne, M.J., I. Durre, B. Korzeniewski, S. McNeal, K. Thomas, X. Yin, S. Anthony, R. Ray, R.S. Vose, B.E. Gleason, and T.G. Houston 2012. Global Historical Climatology Network - Daily (GHCN-Daily), Version 3. NOAA National Climatic Data Center. Version 3.27-upd-2020020523. https://doi.org/10.7289/V5D21VHZ
Menne, M.J., I. Durre, R.S. Vose, B.E. Gleason, and T.G. Houston. 2012. An Overview of the Global Historical Climatology Network-Daily Database. Journal of Atmospheric and Oceanic Technology, 29: 897-910. https://doi.org/10.1175/JTECH-D-11-00103.1
Thornton, Peter E., Rupesh Shrestha, Michele Thornton, Shih-Chieh Kao, Yaxing Wei, and Bruce E. Wilson. 2021. “Gridded Daily Weather Data for North America with Comprehensive Uncertainty Quantification.” Scientific Data 8 (1). https://doi.org/10.1038/s41597-021-00973-0.
Dataset Revisions
ORNL DAAC Version Record for Version 4 Monthly Latency
|
Daymet Product Version |
ORNL DAAC Release Date | Description |
|---|---|---|
| Version 4.0 Monthly Latency | 05/25/2023 | Data for July 2022 through December 2022 were not produced and users needing data for those months should consult https://doi.org/10.3334/ORNLDAAC/2129. Production of the monthly latency data was paused during these months while the Daymet team investigated a data quality question. |
| Version 4.0 Monthly Latency | For ORNL DAAC release information of the monthly latency daily gridded mosaic for North America, Puerto Rico, and Hawaii, please see the companion file, Daymet_V4_Daily_MonthlyLatency_changelog.txt. | |
| Version 4.0 Monthly Latency | 2021-05-28 | ORNL DAAC released daily gridded mosaics for January through April, 2021 for each Daymet Version 4 variable for the continental North American spatial area. |