Documentation Revision Date: 2024-06-27
Dataset Version: 3
Summary
There are a total of 123 files in this data set. There are 120 shape files and 3 csv files. The data are distributed as shape files that represent the 2-degree by 2-degree tile structure in which the Daymet model estimates are derived. The annual cross-validation statistics are provided as a separate shape file for the North American domain for each of the three variables for each year of available Daymet input data (i.e., 3 files/year for 40years).
Also provided are the complete time series of annual summary cross-validation statistics for the three Daymet input parameters in comma separated files (*.csv). There is one file for each of the three parameters for each tile.
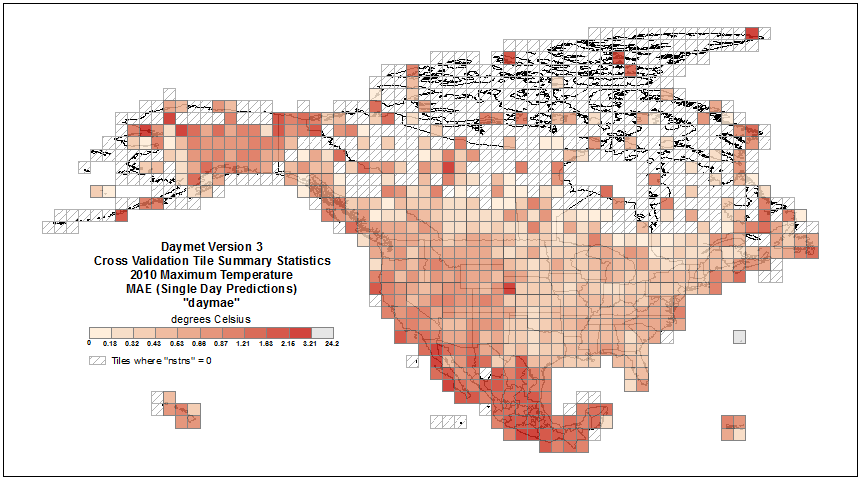
Figure 1: Daymet V3 cross-validation tile-wide summary statistics for 2010 maximum temperature - "daymae" - mean absolute error for single day predictions.
Citation
Thornton, P.E., M.M. Thornton, and R.S. Vose. 2016. Daymet: Annual Tile Summary Cross-Validation Statistics for North America, Version 3. ORNL DAAC, Oak Ridge, Tennessee, USA. https://doi.org/10.3334/ORNLDAAC/1348
Table of Contents
- Dataset Overview
- Data Characteristics
- Application and Derivation
- Quality Assessment
- Data Acquisition, Materials, and Methods
- Data Access
- References
- Dataset Revisions
Dataset Overview
Project: Daymet
This data set provides annual summary cross-validation statistics for minimum temperature (tmin), maximum temperature (tmax), and daily total precipitation (prcp) of "Daymet: Daily Surface Weather Data on a 1-km Grid for North America, Version 3" (Thornton et al., 2016). The cross-validation statistics were generated by the Daymet model algorithm from the station-based daily observations and predictions and are summarized for each of the 2-degree by 2-degree tiles in the regimen in which Daymet is derived. Data are available for the temporal period 1980 through 2019, the most recently processed calendar year of Daymet Version 3.
Summarized by tile are average and period-of-record mean absolute error (MAE) and bias statistics for the input weather observations of tmin, tmax, and prcp. Also available are tile-wide values of number of ground weather stations evaluated, total station-days evaluated, and mean observed input parameter values. Summary statistics are also available for the Gaussian distribution functions, used in the Daymet interpolation method, as mean and standard deviations of the radius of the kernel weights and x, y, and z components of the 3-dimensional regression formula.
Related Data Sets:
Thornton, P.E., M.M. Thornton, B.W. Mayer, Y. Wei, R. Devarakonda, R.S. Vose, and R.B. Cook. 2016. Daymet: Daily Surface Weather Data on a 1-km Grid for North America, Version 3. ORNL DAAC, Oak Ridge, Tennessee, USA. http://dx.doi.org/10.3334/ORNLDAAC/1328
Data Characteristics
The annual cross-validation statistics are provided for North America as a separate shape file for each of the three variables for each year of available Daymet input data (i.e., 3 files/year for 40 years).
Also the complete time series of annual cross-validation statistics for a variable is provided in a single comma separated file (*.csv). There is one file for each of the three variables.
Spatial Coverage: North America and Hawaii: including Canada, Mexico, the United States of America, Puerto Rico, and Bermuda.
Spatial Resolution: 2-degree x 2-degree
Temporal Coverage: 1980-01-01 to 2019-12-31
Temporal Resolution: Annual
Site boundaries: (All latitudes and longitudes given in decimal degrees)
| Site | Westernmost Longitude | Easternmost Longitude | Northernmost Latitude | Southernmost Latitude | Geodetic Datum |
|---|---|---|---|---|---|
|
North America, Puerto Rico, and Hawaii |
-180 | -52 | 84 | 14 | WGS_1984 |
Data File Information
Shape Files
There are 120 shape files associated with this data set. Daymet cross-validation data are available as shape files covering North America (Canada, United States, Mexico, Puerto Rico) and Hawaii – with a spatial resolution of 2 degrees.
The shape files geometric polygon structure represents the 2 degree x 2 degree tile “grid” in which the Daymet model is processed and output. Note that this vector file is an approximation of the Daymet 2-degree raster tile grid.
Three shape files with cross-validation statistical information for each of the three Daymet daily weather input variables minimum temperature (tmin), maximum temperature (tmax), and total precipitation (prcp) are available each year of available Daymet data.
The North American shape files are zipped for convenience and contain four files (*.dbf,*.prj,*.shp, and *.shx).
File names follow this syntax: DaymetV3_xval_pppp_yyyy.shp (*.zip)
Where:
xval distinguishes these as Daymet tile summary cross-validation data files;
pppp is the respective Daymet input meteorological variable (tmin, tmax, and prcp); and
yyyy is year.
Data Dictionary:
Fields within each shape file contain the tile-wide summary cross-validation statistics.
Shape files for temperature (tmin and tmax) Cross-Validation Statistics have these attributes.
|
Field |
Units/format |
Description |
|
Xmin |
decimal degrees |
Approximate minimum longitude of tile |
|
Xmax |
decimal degrees |
Approximate maximum longitude of tile |
|
Ymin |
decimal degrees |
Approximate minimum latitude of tile |
|
Ymax |
decimal degrees |
Approximate maximum latitude of tile |
|
year |
YYYY |
Daymet processing year |
|
tileid |
Daymet Tile ID |
|
|
nstns |
stations |
number of stations evaluated (tileid) |
|
nstndays |
days |
number of station-days evaluated (tileid) |
|
rad90mean |
meter |
mean: radius capturing 90% of filter kernel weight |
|
rad90std |
meter |
standard deviation: radius capturing 90% of filter kernel weight |
|
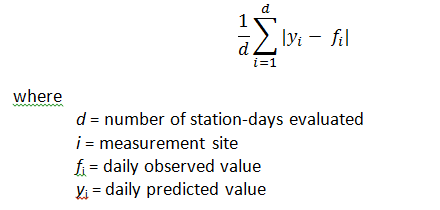
daymae |
degrees Celsius |
mean absolute error for single-day predictions |
|
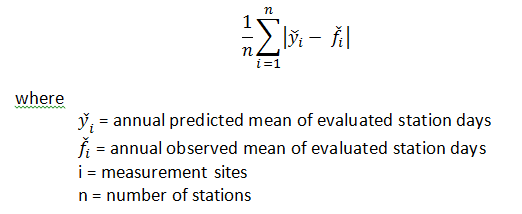
pormae |
degrees Celsius |
mean absolute error for period-of-record predictions |
|
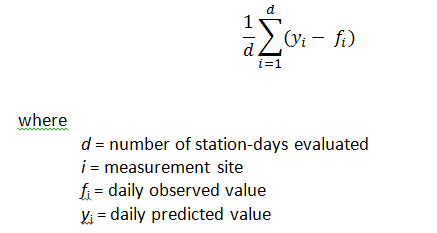
bias |
degrees Celsius |
mean prediction bias |
|
tamean |
degrees Celsius |
mean observed temperature (tmin and tmax) |
|
xlrmean |
degrees C/meter |
3-d regression: mean x-component |
|
xlrstdv |
degrees C/meter |
3-d regression: among-station std dev of x-component |
|
ylrmean |
degrees C/meter |
3-d regression: mean y-component |
|
ylrstdv |
degrees C/meter |
3-d regression: among-station std dev of y-component |
|
zlrmean |
degrees C/meter |
3-d regression: mean z-component |
|
zlrstdv |
degrees C/meter |
3-d regression: among-station std dev of z-component |
Shape files for precipitation (prcp) Cross-Validation Statistics have these attributes.
|
Field |
Units/format |
Description |
|
Xmin |
decimal degrees |
Approximate minimum longitude of tile |
|
Xmax |
decimal degrees |
Approximate maximum longitude of tile |
|
Ymin |
decimal degrees |
Approximate minimum latitude of tile |
|
Ymax |
decimal degrees |
Approximate maximum latitude of tile |
|
year |
YYYY |
Daymet processing year |
|
tileid |
Daymet Tile ID |
|
|
nstns |
stations |
number of stations evaluated (tileid) |
|
nstndays |
days |
number of station-days evaluated (tileid) |
|
rad90mean |
meter |
mean: radius capturing 90% of filter kernel weight |
|
rad90std |
meter |
standard deviation: radius capturing 90% of filter kernel weight |
|
daymae |
cm/day |
mean absolute error for single-day predictions |
|
pormae |
cm/day |
mean absolute error for period-of-record predictions |
|
pormpae |
% |
mean absolute error as a percentage, for period of record predictions |
|
bias |
cm/day |
mean prediction bias |
|
ppmean |
cm/day |
mean observed daily total precipitation |
|
xlrmean |
1/meter |
3-d regression: mean x-component |
|
xlrstdv |
1/meter |
3-d regression: among-station std dev of x-component |
|
ylrmean |
1/meter |
3-d regression: mean y-component |
|
ylrstdv |
1/meter |
3-d regression: among-station std dev of y-component |
|
zlrmean |
1/meter |
3-d regression: mean z-component |
|
zlrstdv |
1/meter |
3-d regression: among-station std dev of z-component |
User’s Notes
- When “nstns” is zero (0), no input weather station data are available within that tile. All attributes are recorded as nodata (-9999) or "nan".
- When “nstns” have very low values (e.g. 1, 2, or 3) denoting limited input data available for that tile, values for the 3-dimensional regression components may be set to “nan” where the regressions algorithm failed.
- Floating point precision has been carried forward from the Daymet model for all attributes.
Spatial Data Properties
Spatial Representation: vector
Vector Format: shape file
Nodata Value: -9999
Spatial Reference Properties
Type: Geographic
"GEOGCS['GCS_WGS_1984',
DATUM['WGS_1984',
SPHEROID['WGS_84',6378137.0,298.257223563]],
PRIMEM['Greenwich',0.0],
UNIT['Degree',0.0174532925199433]]"
Comma Separated Files
There are 3 comma separated files with this data set. The complete time series (1980-2019) of annual cross-validation statistics for a variable is provided in a single comma separated file (*.csv) -- one file for each of the three variables.
File names follow this syntax: DaymetV3_xval_pppp_yyyy-yyyy.csv
Where:
xval distinguishes these as Daymet cross-validation data files;
pppp is the respective Daymet input meteorological variable (tmin, tmax, and prcp); and
yyyy-yyyy is the range of annual summary statistics included in the file.
User’s Notes
- When “nstns” is zero (0), no input weather station data are available within that tile. All attributes are recorded as nodata (-9999) or "nan".
- When “nstns” have very low values (e.g. 1, 2, or 3) denoting limited input data available for that tile, values for the 3-dimensional regression components may be set to “nan” where the regressions algorithm failed.
- Floating point precision has been carried forward from the Daymet model for all attributes.
Application and Derivation
The Daymet cross-validation analysis are used to characterize the sensitivity of Daymet model methods to the variation of parameters and to estimate the prediction errors associated with the final selected parameters. The general cross-validation protocol is to withhold one observation at a time from a sample, generating a prediction error for the withheld case by comparing with the observed value, and repeating over all observations in the sample to generate an average prediction error. The mean absolute error and bias are the basic error prediction error statistics. MAE does not exaggerate the influence of outliers as would a root mean square error and provides a more robust parameterization framework. Both the absolute value and sign of the prediction are considered in the generation of MAE and bias, respectively.
Quality Assessment
Occurrence of No Data and Not A Number (nan) field values
For tiles that had no input weather stations located within the 2 degree by 2 degree tile processing extent (e.g. nstns = 0), there are no cross-validation data available. For these tiles, the nodata values are represented with -9999 or "nan" values. For tiles with very low weather station inputs (e.g. nstns <= 3), it is often the case that the 3-dimensional regression components calculations failed. In those cases, the regression values are represented with “nan” values in the attribute fields.
Data Acquisition, Materials, and Methods
Cross-validation Protocol
The Daymet cross-validation summary statistics are used to test the sensitivity of Daymet model methods to the variation of parameters and to estimate the prediction errors associated with the final selected parameters (Thornton, 1999).
The general cross-validation protocol is to withhold one observation at a time from the sample, generating a prediction error for the withheld case by comparing with the observed value, and repeating over all observations in the sample to generate an average prediction error. The mean absolute error and bias are the basic error prediction error statistics. MAE does not exaggerate the influence of outliers as would a root mean square error and provides a more robust parameterization framework. Both the absolute value and sign of the prediction are considered in the generation of MAE and bias, respectively.
The mean absolute error for single prediction days, or "daymae" is determined as below:
The bias for the single prediction days is determined as below:
The mean absolute error for the period of record predictions, or pormae, is determined as below:
Version 3.0 Daymet model inputs of spatially referenced ground observations of daily maximum and minimum temperature and precipitation were obtained from the NOAA National Centers for Environmental Information's Global Historical Climatology Network (GHCN)-Daily data set from Version 3.22 of the data distribution (Menne et al., 2012). The sparse network of Mexican stations available through the GHCN-Daily network was augmented with additional stations provided by the Servicio Meteorológico Nacional of Mexico. These data were obtained through an agreement with NOAA/GHCN-Daily in which GHCN-D acquired the station data directly from the Servicio Meteorológico Nacional and processed this data through the same QA/QC measures as all GHCN-D data are subject ensuring credibility to the data provenance of these additional data. The additional Mexican data were then provided to the NASA Daymet processing group.
Data Access
These data are available through the Oak Ridge National Laboratory (ORNL) Distributed Active Archive Center (DAAC).
Daymet: Annual Tile Summary Cross-Validation Statistics for North America, Version 3
Contact for Data Center Access Information:
- E-mail: uso@daac.ornl.gov
- Telephone: +1 (865) 241-3952
References
Menne, M.J., I. Durre, R.S. Vose, B.E. Gleason, and T.G. Houston, 2012: An overview of the Global Historical Climatology Network-Daily Database. Journal of Atmospheric and Oceanic Technology, 29, 897-910, doi:10.1175/JTECH-D-11-00103.1. http://dx.doi.org/10.1175/JTECH-D-11-00103.1
Menne, M.J., I. Durre, B. Korzeniewski, S. McNeal, K. Thomas, X. Yin, S. Anthony, R. Ray, R.S. Vose, B.E.Gleason, and T.G. Houston, 2012: Global Historical Climatology Network -Daily (GHCN-Daily), Version 3.22. NOAA National Climatic Data Center. http://doi.org/10.7289/V5D21VHZ February 29, 2016.
Thornton, P.E. and S.W. Running. 1999. An improved algorithm for estimating incident daily solar radiation from measurements of temperature, humidity, and precipitation. Agriculture and Forest Meteorology. 93:211 - 228. http://dx.doi.org/10.1016/S0168-1923(98)00126-9
Thornton, P.E., M.M. Thornton, B.W. Mayer, Y. Wei, R. Devarakonda, R.S. Vose, and R.B. Cook. 2016. Daymet: Daily Surface Weather Data on a 1-km Grid for North America, Version 3. ORNL DAAC, Oak Ridge, Tennessee, USA. http://dx.doi.org/10.3334/ORNLDAAC/1328
Dataset Revisions
Note: The ORNL DAAC revised its methods for versioning datasets to be more consistent with data versioning practices at the NASA Earth Science Data and Information System (ESDIS) and the general Earth Science data community. With the revised versioning strategy, the dataset version number (including both major and minor version numbers) remain unchanged when a release only appends new data and existing data are not changed. At the time of publication of 2023 Daymet data, the version numbers of Daymet datasets, including the Version 4 and prior versions are updated as shown in the revision tables below.
ORNL DAAC Release Record for Version 3
| ORNL DAAC Release Date | Daymet Product Version | Description |
|---|---|---|
| March 31, 2020 | Version 3 | This release added data for 2019 for Daymet Version 3. |
| June 24, 2019 | This release added data for 2018 for Daymet Version 3. | |
| June 27, 2018 | This release added data for 2017 for Daymet Version 3. | |
| April 24, 2017 | Initial release of this dataset |
ORNL DAAC Release Record for Version 2
| ORNL DAAC Release Date | Daymet Product Version | Description |
|---|---|---|
| April 29, 2016 | Version 2 | ORNL DAAC released the Version 2 Daymet Tile Summary Cross Validation Statistics |