Documentation Revision Date: 2024-06-21
Dataset Version: 3
Summary
Daymet V3 daily gridded data are available for download from the ORNL DAAC through website search and order tools or directly by browsing the Daymet data directories. Access through a THREDDS Data Server is also available. In addition, the ORNL DAAC hosts a separate Daymet Project web site which provides customized tools for accessing the data.
Files are available in netCDF format for three separate spatial areas: continental North America (including Canada, the United States, and Mexico), Hawaii, and Puerto Rico. The file naming structure indicates the spatial region.
For each spatial region, there are 280 *.nc4 files. One file for each of the seven Daymet parameters for 40 years (1980 - 2019). In total, there are 840 files.
Version and change history documentation is provided in Section 8 of this document.
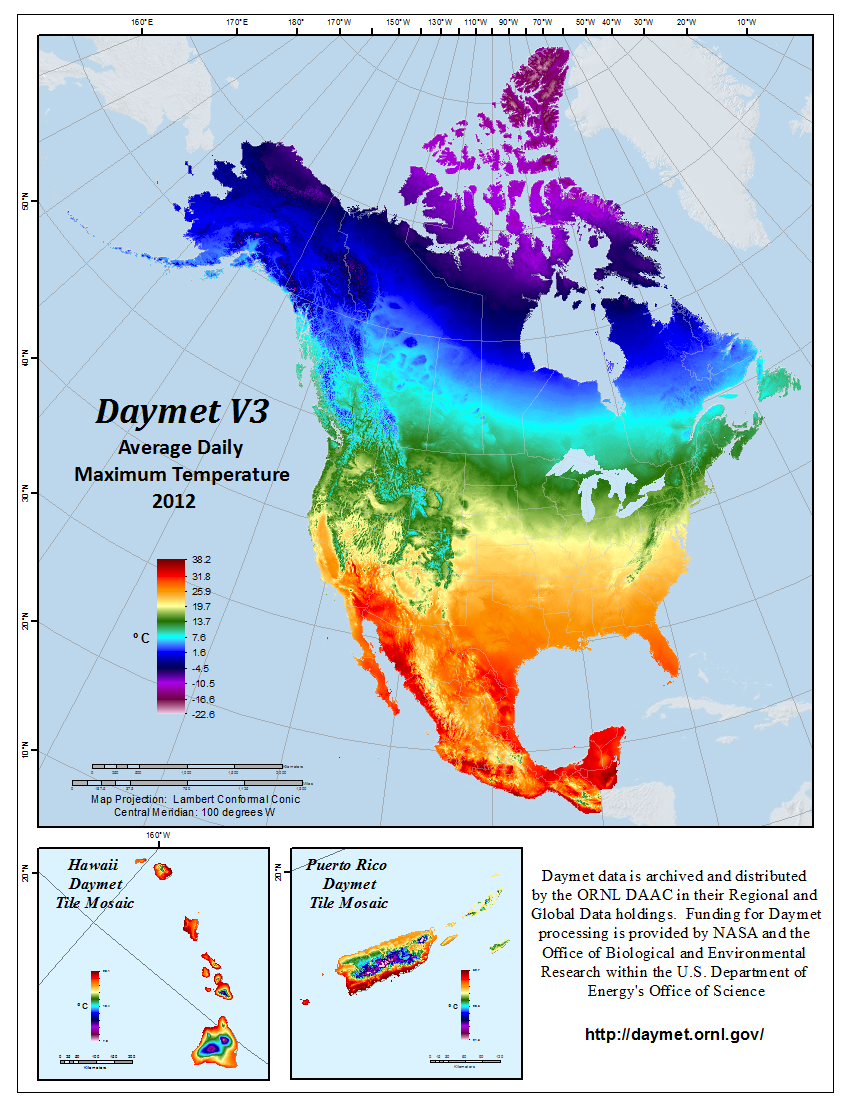
Figure 1. Daymet V3.0 Average Daily Maximum Temperature for North America, Hawaii, and Puerto Rico in the year 2012.
Citation
Thornton, P.E., M.M. Thornton, B.W. Mayer, Y. Wei, R. Devarakonda, R.S. Vose, and R.B. Cook. 2016. Daymet: Daily Surface Weather Data on a 1-km Grid for North America, Version 3. ORNL DAAC, Oak Ridge, Tennessee, USA. https://doi.org/10.3334/ORNLDAAC/1328
Table of Contents
- Dataset Overview
- Data Characteristics
- Application and Derivation
- Quality Assessment
- Data Acquisition, Materials, and Methods
- Data Access
- References
- Dataset Revisions
Dataset Overview
Project: Daymet
This dataset provides Daymet Version 3 model output data as gridded estimates of daily weather parameters for North America and Hawaii; including Canada, Mexico, the United States of America, Bermuda and Puerto Rico. The island areas of Hawaii and Puerto Rico are available as separate files from the continental land mass. Daymet output variables include the following parameters: minimum temperature, maximum temperature, precipitation, shortwave radiation, vapor pressure, snow water equivalent, and day length. The dataset covers the period from January 1, 1980 to December 31 of the most recent full calendar year. Each subsequent year is processed individually at the close of a calendar year after allowing adequate time for input weather station data to be of archive quality. Daymet variables are continuous surfaces provided as individual files, by year, at a 1-km x 1-km spatial resolution and a daily temporal resolution. Data are in a Lambert Conformal Conic projection for North America and are in a netCDF file format compliant with Climate and Forecast (CF) metadata conventions.
Daymet V3 daily gridded data are available for download from the ORNL DAAC through website search and order tools or directly by browsing the Daymet data directories. Data are also accessible through a THREDDS Data Server. The ORNL DAAC also hosts a separate Daymet Project web site which provides customized tools for accessing the data.
Files are available in netCDF version 4.0 format for three separate spatial areas; continental North America (including Canada, the United States, and Mexico), Hawaii, and Puerto Rico.
The development and distribution of the Daymet model and data products has been supported by the NASA Terrestrial Ecology Program. Data are model-produced gridded surfaces of daily weather parameters based on daily meteorological observations. These products were developed to fulfill the need for continuous surfaces of daily weather data necessary for plant growth model inputs but have had broad applications over a wide variety of scientific, research, and educational fields including hydrology, terrestrial vegetation growth models, carbon cycle science, and regional to large scale climate change analysis.
Related Publications:
Thornton, P.E., Running, S.W., White, M.A. 1997. Generating surfaces of daily meteorological variables over large regions of complex terrain. Journal of Hydrology 190: 204-251. http://dx.doi.org/10.1016/S0022-1694(96)03128-9
Thornton, P.E., H. Hasenauer, and M.A. White. 2000. Simultaneous estimation of daily solar radiation and humidity from observed temperature and precipitation: An application over complex terrain in Austria. Agricultural and Forest Meteorology 104:255-271. http://dx.doi.org/10.1016/S0168-1923(00)00170-2
Thornton, P.E. and S.W. Running. 1999. An improved algorithm for estimating incident daily solar radiation from measurements of temperature, humidity, and precipitation. Agriculture and Forest Meteorology. 93:211-228. http://dx.doi.org/10.1016/S0168-1923(98)00126-9
Related Datasets:
Thornton, M.M., P.E. Thornton, Y. Wei, B.W. Mayer, R.B. Cook, and R.S. Vose. 2016. Daymet: Annual Climate Summaries on a 1-km Grid for North America, Version 3. ORNL DAAC, Oak Ridge, Tennessee, USA. https://doi.org/10.3334/ORNLDAAC/1343
Thornton, M.M., P.E. Thornton, Y. Wei, B.W. Mayer, R.B. Cook, and R.S. Vose. 2016. Daymet: Monthly Climate Summaries on a 1-km Grid for North America, Version 3. ORNL DAAC, Oak Ridge, Tennessee, USA. https://doi.org/10.3334/ORNLDAAC/1345
Thornton, P.E., M.M. Thornton, and R.S. Vose. 2016. Daymet: Annual Tile Summary Cross-Validation Statistics for North America, Version 3. ORNL DAAC, Oak Ridge, Tennessee, USA. https://doi.org/10.3334/ORNLDAAC/1348
Thornton, M.M., P.E. Thornton, Y. Wei, R.S. Vose, and A.G. Boyer. 2017. Daymet: Station-Level Inputs and Model Predicted Values for North America, Version 3. ORNL DAAC, Oak Ridge, Tennessee, USA. https://doi.org/10.3334/ORNLDAAC/1391
Data Characteristics
This dataset contains Daymet Version 3 model output for seven parameters: minimum and maximum temperature, precipitation, shortwave radiation, vapor pressure, snow water equivalent, and day length. Data are available for each of the seven parameters on a daily time step.
Data are assembled by parameter and year with each yearly file containing a time dimension of 365 days. Files are in CF-compliant netCDF-4 format with internal compression applied. Chunk size parameterization on spatial and temporal dimensions has been optimized for spatial subsetting spanning fewer time slices.
Three file sets with separate spatial areas are provided: a North American continental file set that includes continuous surfaces of Canada, the United States, Mexico, and Bermuda; a file set for Hawaii; and one for Puerto Rico. For each spatial region, there are 280 *.nc4 files. One file for each of the seven Daymet parameters for 40 years (1980 - 2019). In total, there are 840 files.
Spatial Coverage: North America and Hawaii: including Canada, Mexico, the United States of America, Hawaii, Puerto Rico, and Bermuda.
Spatial Resolution: 1000 m
Temporal Coverage: 1980-01-02 to 2019-12-31
Temporal Resolution: Daily
Site boundaries: (All latitude and longitude given in degrees and fractions)
| Site | Westernmost Longitude | Easternmost Longitude | Northernmost Latitude | Southernmost Latitude | Geodetic Datum |
|---|---|---|---|---|---|
|
North America, Puerto Rico, and Hawaii |
-179 | -52 | 83 | 14 | WGS_1984 |
Filename format: daymet_version_pppp_yyyy_region.nc4
Example file name: daymet_v3_tmax_1980_na.nc4
Where:
pppp is the respective parameter abbreviation (dayl, prcp, srad, swe, tmax, tmin, and vp),
yyyy is year (1980 through 2019), and
region is either 'na' (for continental North America), 'hawaii', or 'puertorico'.
Parameters, Parameter abbreviations, Units, and Descriptions:
| Parameter | Abbr | Units | Description |
|---|---|---|---|
| Day length | dayl | s/day | Duration of the daylight period in seconds per day. This calculation is based on the period of the day during which the sun is above a hypothetical flat horizon |
| Precipitation | prcp | mm/day | Daily total precipitation in millimeters per day, sum of all forms converted to water-equivalent. Precipitation occurrence on any given day may be ascertained. |
| Shortwave radiation | srad | W/m2 | Incident shortwave radiation flux density in watts per square meter, taken as an average over the daylight period of the day. Note: Daily total radiation (MJ/m2/day) can be calculated as follows: ((srad (W/m2) * dayl (s/day)) / l,000,000) |
| Snow water equivalent | swe | kg/m2 | Snow water equivalent in kilograms per square meter. The amount of water contained within the snowpack. |
| Maximum air temperature | tmax | degrees C | Daily maximum 2-meter air temperature in degrees Celsius. |
| Minimum air temperature | tmin | degrees C | Daily minimum 2-meter air temperature in degrees Celsius. |
| Water vapor pressure | vp | Pa | Water vapor pressure in pascals. Daily average partial pressure of water vapor. |
The Daymet Calendar:
The Daymet calendar is based on a standard calendar year. All Daymet years, including leap years, have 1 - 365 days. For leap years, the Daymet database includes leap day (February 29) and values for December 31 are discarded from leap years to maintain a 365-day year.
Data File Descriptions:
Spatial data properties
Continental North America (na) Data
Spatial Representation Type: Raster
Pixel Depth: 32 bit
Pixel Type: float
Number of Bands: 365
Band Information: time
Raster Format: netCDF
Source Type: continuous
No Data Value: -9999
Scale Factor: none
Offset: none
Endian Type: NA
Number Columns: 7,814
Column Resolution: 1,000 meter
Number Rows: 8,075
Row Resolution: 1,000 meter
Extent in the items coordinate system
North: 4984500
South: -3090500
West: -4560750
East: 3253250
xll corner:-4560750.0
yll corner:-3090500.0
Cell Geometry: area
Point in Pixel: corner
Hawaii (hawaii) Data
Spatial Representation Type: Raster
Pixel Depth: 32 bit
Pixel Type: float
Number of Bands: 365
Band Information: time
Raster Format: netCDF
Source Type: continuous
No Data Value: -9999
Scale Factor: none
Offset: none
Endian Type: NA
Number Columns: 284
Column Resolution: 1,000 meter
Number Rows: 584
Row Resolution: 1,000 meter
Extent in the items coordinate system
North: -38500
South: -622500
West: -5802750
East: -5518750
xll corner:-5802750.0
yll corner:-622500.0
Cell Geometry: area
Point in Pixel: corner
Puerto Rico (puertorico) Data
Spatial Representation Type: Raster
Pixel Depth: 32 bit
Pixel Type: float
Number of Bands: 365
Band Information: time
Raster Format: netCDF
Source Type: continuous
No Data Value: -9999
Scale Factor: none
Offset: none
Endian Type: NA
Number Columns: 364
Column Resolution: 1,000 meter
Number Rows: 231
Row Resolution: 1,000 meter
Extent in the items coordinate system
North: -1764500
South: -1995500
West: 3445250
East: 3809250
xll corner:3445250.0
yll corner:-1995500.0
Cell Geometry: area
Point in Pixel: corner
Spatial reference properties (for all files)
Type: Projected
Geographic Coordinate Reference: WGS_1984
Projection: Lambert Conformal Conic
Projection System: Lambert Conformal Conic
Parameters:
projection units: meters
datum (spheroid): WGS_84
1st standard parallel: 25 deg N
2nd standard parallel: 60 deg N
Central meridian: -100 deg (W)
Latitude of origin: 42.5 deg N
false easting: 0
false northing: 0
Version Information:
The data are stored and distributed as individual CF-compliant netCDF files for each parameter. The most current Daymet data are being delivered to the user in both Daymet software and Daymet data versions. Version information is recorded in the header file of each netCDF file in the Global Attribute fields: Version_software and Version_data. All Daymet data are provisional and subject to revision.
Application and Derivation
The Daymet data have broad applications over a wide variety of research fields including hydrology, terrestrial vegetation growth models, carbon cycle science, and regional to large scale climate change analysis. Measurements of near-surface meteorological conditions are made at many locations, but researchers are often faced with having to perform ecosystem process simulations in areas where no meteorological measurements have been taken. The continuous gridded surfaces of the Daymet dataset were developed to overcome these limitations.
Quality Assessment
Tile Quality
The Daymet algorithm manages the large number of input data and large spatial extent of the study area by creating a system of 2-degree x 2-degree “tiles” that are processed individually through the Daymet software. These tiles are identified by a TileID, which is derived within the Daymet algorithm and is consistent throughout the temporal period of the Daymet record. Annual tile-wide summary cross-validation statistics for input data parameters; minimum temperature (tmin), maximum temperature (tmax), and daily total precipitation (prcp) are computed within the model routines. These cross-validation statistics are derived from the station-based daily observations and predictions and summarized for each of the 2-degree by 2-degree tiles. Average and period-of-record mean absolute error (MAE) and bias statistics for observations of tmin, tmax, and prcp are calculated. In addition, tile-wide values of total ground weather stations per tile and total station days per tile are determined.
Snow Water Equivalent Clarification
Snowpack, quantified as snow water equivalent (SWE), is estimated as part of the Daymet processing in order to reduce biases in shortwave radiation estimates related to multiple reflections between the surface and atmosphere that are especially important when the surface is covered by snow (Thornton et al. 2000). The Daymet (v3.0) dataset includes estimated SWE as an output parameter since this quantity may be of interest for research applications in addition to its primary intended use as a component of the Daymet shortwave radiation algorithm. An important caveat in the use of SWE from the Daymet (v3.0) dataset is that the algorithm used to estimate SWE is executed with only a single calendar year of primary surface weather inputs (daily maximum and minimum temperature and daily total precipitation) available for the estimation of a corresponding calendar year of snowpack. Since northern hemisphere snowpack accumulation is commonly underway already at the beginning of the calendar year, the SWE algorithm uses data from a single calendar year to make a two-year sequence of temperature and precipitation, then predicts the evolution of snowpack over this two-year period to provide an estimate of year day 365 (December 31 for non-leap years) snowpack as an initial condition for the January 1 time step of the actual calendar year. The problem with this approach is that it ignores the dependence of January 1 snowpack on preceding calendar year temperature and precipitation conditions, and so generates potential biases in mid-season snowpack which can propagate to biases in late-season timing of snow melt.
Data Acquisition, Materials, and Methods
Model inputs
Version 3.0 Daymet model inputs of spatially referenced ground observations of daily maximum and minimum temperature and precipitation were obtained from the NOAA National Centers for Environmental Information's Global Historical Climatology Network (GHCN)-Daily dataset (Menne et al., 2012). For years 1980 - 2013 through additional NASA support, the sparse network of Mexican stations available through the GHCN-Daily network was augmented with additional stations provided by the Servicio Meteorológico Nacional of Mexico. These data were obtained through an agreement with NOAA/GHCN-Daily in which GHCN-D acquired the station data directly from the Servicio Meteorológico Nacional and processed this data through the same QA/QC measures as all GHCN-D data is subject ensuring credibility to the data provenance of these additional data. The additional Mexican data were then provided to the NASA Daymet processing group.
GHCN-Daily Version Download Dates:
- Daymet V3 for years 1980 - 2014 used GHCN-D data set version 3.22 downloaded on September 16, 2015.
- Daymet V3 for year 2015 used GHCN-D data set version 3.22 downloaded on February 29, 2016.
- Daymet V3 for year 2016 used GHCN-D data set version 3.22 downloaded on March 13, 2017.
- Daymet V3 for year 2017 used GHCN-D data set version 3.23 downloaded on February 6, 2018.
- Daymet V3 for year 2018 used GHCN-D data set version 3.25 downloaded on March 18, 2019.
- Daymet V3 for year 2019 used GHCN-D data set version 3.27 downloaded on February 16, 2020.
Additional inputs for the Daymet algorithm are a digital elevation model (DEM) and Land Mask. The DEM used in Daymet v3.0 processing is a North American subset of the NASA SRTM near-global 30 arc second DEM version 2.1 (SRTM DEM). This DEM was reprojected and resampled from a geographic coordinate system (GCS_WGS_84) to the Daymet Lambert Conformal Conic projection. The resampling method used a cubic convolution interpolation with an output cell size set to 1,000 m. Slope and aspect grids are derived from the DEM within the Daymet algorithm. Horizon files were separately generated within the SVF model using the GRASS GIS software.
The land/water mask for Daymet processing was derived from the MODIS 250 meter Land-Water Mask; MOD44W_v2 (NASA LPDAAC, 2016). The North American study area of Daymet v3.0 was clipped out and the data were resampled and reprojected to the Daymet projection system at a 1 km x 1 km spatial resolution. Inland water was converted to land, retaining only the coast line as the Daymet land/water mask division.
Daymet Algorithm
The Daymet algorithm manages the large number of input data and large spatial extent of the study area by creating a system of 2 degree x 2 degree tiles which are processed individually through the Daymet software. The set of ground surface observation stations that are input for the interpolation methods is collected from the heterogeneously spaced stations of the input data from three separate input files of minimum temperature, maximum temperature, and precipitation. The interpolation method at each prediction point is accomplished through an iterative estimation of local station density using the spatial convolution of a truncated Gaussian filter as further described in Thornton et al., (1997). In it, a system is established in which the search radius of stations is reduced in data-rich regions and increased in data-poor regions. This is accomplished by specifying an average number of observations to be included at each point. The search distance of stations is then varied as a smooth function of the local station density. The result is a seamless match of gridded daily data for adjacent tiles. In the Daymet algorithm, spatially and temporally explicit empirical analyses of the relationships of temperature and precipitation to elevation are performed. In addition, a daily precipitation occurrence algorithm is introduced, as a precursor to the prediction of daily precipitation amount. Surfaces of humidity (water vapor pressure) are generated as a function of the predicted daily minimum temperature and the predicted daily average daylight temperature. Daily surfaces of incident solar radiation are generated as a function of Sun-slope geometry and interpolated diurnal temperature range. Snowpack, quantified as snow water equivalent, is estimated as part of the Daymet processing in order to reduce biases in shortwave radiation estimates related to multiple reflections between the surface and atmosphere that are especially important when the surface is covered by snow (Thornton et al., 2000). The Daymet dataset includes estimated SWE as an output variable since this quantity may be of interest for research applications in addition to its primary intended use as a component of the Daymet shortwave radiation algorithm.
Data Access
These data are available through the Oak Ridge National Laboratory (ORNL) Distributed Active Archive Center (DAAC).
Daymet: Daily Surface Weather Data on a 1-km Grid for North America, Version 3
Contact for Data Center Access Information:
- E-mail: uso@daac.ornl.gov
- Telephone: +1 (865) 241-3952
References
NASA LP DAAC, 2016, MODIS/Terra Land Water Mask Derived from MODIS and SRTM L3 Global 250m Grid (MOD44W). NASA EOSDIS Land Processes DAAC, USGS Earth Resources Observation and Science (EROS) Center, Sioux Falls, South Dakota (https://lpdaac.usgs.gov).
Menne, M.J., I. Durre, R.S. Vose, B.E. Gleason, and T.G. Houston, 2012: An overview of the Global Historical Climatology Network-Daily Database. Journal of Atmospheric and Oceanic Technology, 29, 897-910, doi:10.1175/JTECH-D-11-00103.1. http://dx.doi.org/10.1175/JTECH-D-11-00103.1
Menne, M.J., I. Durre, B. Korzeniewski, S. McNeal, K. Thomas, X. Yin, S. Anthony, R. Ray, R.S. Vose, B.E.Gleason, and T.G. Houston, 2012: Global Historical Climatology Network -Daily (GHCN-Daily), Version 3.22. NOAA National Climatic Data Center. http://doi.org/10.7289/V5D21VHZ February 29, 2016.
Shuttle Radar Topography Mission (SRTM) Near-global Digital Elevation Models (DEMs). Produced from a collaborative mission by the National Aeronautics and Space Administration (NASA), the National Imagery and Mapping Agency (NIMA), the German Aerospace Center (DLR, Deutsches Zentrum fur Luft-und Raumfart), and the Italian Space Agency (ASI, Agenzia Spaziale Italiana). Available at [https://lta.cr.usgs.gov/SRTM] from the U.S. Department of the Interior, U.S. Geological Survey, Earth Resources Observation Systems (EROS) Data Center (EDC), Distributed Active Archive Center (DAAC), Sioux Falls, South Dakota, USA.
Thornton, M.M., P.E. Thornton, Y. Wei, B.W. Mayer, R.B. Cook, and R.S. Vose. 2016. Daymet: Annual Climate Summaries on a 1-km Grid for North America, Version 3. ORNL DAAC, Oak Ridge, Tennessee, USA. https://doi.org/10.3334/ORNLDAAC/1343
Thornton, M.M., P.E. Thornton, Y. Wei, B.W. Mayer, R.B. Cook, and R.S. Vose. 2016. Daymet: Monthly Climate Summaries on a 1-km Grid for North America, Version 3. ORNL DAAC, Oak Ridge, Tennessee, USA. https://doi.org/10.3334/ORNLDAAC/1345
Thornton, P.E., M.M. Thornton, and R.S. Vose. 2016. Daymet: Annual Tile Summary Cross-Validation Statistics for North America, Version 3. ORNL DAAC, Oak Ridge, Tennessee, USA. https://doi.org/10.3334/ORNLDAAC/1348
Thornton, M.M., P.E. Thornton, Y. Wei, R.S. Vose, and A.G. Boyer. 2017. Daymet: Station-Level Inputs and Model Predicted Values for North America, Version 3. ORNL DAAC, Oak Ridge, Tennessee, USA. https://doi.org/10.3334/ORNLDAAC/1391
Thornton, P.E., S.W. Running, and M.A. White. 1997. Generating surfaces of daily meteorological variables over large regions of complex terrain. Journal of Hydrology 190: 214 - 251. http://dx.doi.org/10.1016/S0022-1694(96)03128-9
Thornton, P.E., H. Hasenauer, and M.A. White. 2000. Simultaneous estimation of daily solar radiation and humidity from observed temperature and precipitation: An application over complex terrain in Austria. Agriculturaland Forest Meteorology 104:255 - 271. http://dx.doi.org/10.1016/S0168-1923(00)00170-2
Thornton, P.E. and S.W. Running. 1999. An improved algorithm for estimating incident daily solar radiation from measurements of temperature, humidity, and precipitation. Agriculture and Forest Meteorology. 93:211 - 228. http://dx.doi.org/10.1016/S0168-1923(98)00126-9
Dataset Revisions
Note: The ORNL DAAC revised its methods for versioning datasets to be more consistent with data versioning practices at the NASA Earth Science Data and Information System (ESDIS) and the general Earth Science data community. With the revised versioning strategy, the dataset version number (including both major and minor version numbers) remain unchanged when a release only appends new data and existing data are not changed. At the time of publication of 2023 Daymet data, the version numbers of Daymet datasets, including the Version 4 and prior versions are updated as shown in the revision tables below.
ORNL DAAC Version Record for Version 3:
| ORNL DAAC Release Date | Daymet Product Version | Description |
|---|---|---|
| March 17, 2020 | Version 3 | This release added data for 2019 for each Daymet Version 3 variable. |
| April 3, 2019 | This release added data for 2018 for each Daymet Version 3 variable. | |
| April 19, 2018 | This release added data for 2017 for each Daymet Version 3 variable. | |
| April 20, 2017 | This release added data for 2016 for each Daymet Version 3 variable. | |
| July 15, 2016 | This release provided new daily gridded mosaics for all meteorological variables and all years (1980-2015) based on improvements to the Daymet algorithm and expanded geographic coverage at high latitude. Daymet V2 mosaics are now available only upon request. |
ORNL DAAC Version Record for Version 2:
| ORNL DAAC Release Date | Daymet Product Version | Description |
|---|---|---|
| March 7, 2016 | Version 2 | ORNL DAAC released daily gridded mosaics for 2015 for each Daymet Version 2 variable. |
| May 18, 2015 | ORNL DAAC released daily gridded mosaics for 2014 for each Daymet Version 2 variable. | |
| June 13, 2014 | ORNL DAAC released daily gridded mosaics for 2013 each Daymet Version 2 variable. | |
| May 15, 2014 | ORNL DAAC archived and released new daily gridded mosaics for meteorological parameters and updated Daymet Website. All existing Daymet products and tools continue to be available. | |
| May 10, 2012 |
NACP Modeling and Synthesis Thematic Data Center (MAST-DC) at ORNL released new daily gridded meteorological parameter data for 2-degree Daymet tiles through the Daymet Website. |
What’s New with Daymet Version 3
The biggest question that may arise regarding the Version 3 release of Daymet is; "Is this the same data as Daymet V2"? It’s a valid question as a very large portion of the Daymet V3 dataset covers the same spatial extent and same temporal time frame as the Daymet V2 data. The fundamental answer is no, this is not the same data. However, in areas where input weather station density is reasonably high in both V2 and V3 data, model outputs will be quite similar. The biggest impetus for a new version of Daymet was to improve the model outputs in areas of low weather station density, mainly northern Canada and Alaska, allowing for full North American coverage of the dataset. Following are details of how the datasets are not the same and information on updates to the Daymet algorithm.
Daymet Version 3 was processed with an entirely new suite of inputs including:
1. DEM – NASA SRTM near-global 30 arc second DEM version 2.1.
2. Land/Water Mask – MODIS 250 meter Land-Water Mask; MOD44W_v2.
3. Horizon files – Input horizon files were derived from the SRTM DEM from the SVF model available with GRASS GIS 7.0.1.
4. Ground station weather inputs - At the time of Daymet V3 processing, all station weather inputs were available from a single source, the NOAA National Centers for Environmental Information’s Global Historical Climatology Network – Daily (GHCN-Daily). All GHCN-Daily station data were newly acquired and processed into Daymet input standards. Further, the Community Collaborative Rain, Hail, and Snow Network (CoCoRaHs) stations were included, as available, for all years of Daymet processing. CoCoRaHS stations were not used in Daymet V2 processing. Finally, through a collaborative effort, Mexican station data was acquired through the Mexican Government by GHCN-Daily and processed through the same QA/QC routines as all GHCN-Daily data. The consistency of station weather inputs from one source and one system of quality assurance enhances the data provenance for this version of Daymet data.
Daymet Version 3 model algorithm updates include:
1. The algorithm was updated to better address the station data search radius in low density areas. For V2, local station density was used to calculate a radius for inclusion of data that was likely to hit a target number of input stations. That V2 algorithm behaved poorly in regions with sharp gradients in station density and in large regions of very low station density. This problem made it impossible to apply the V2 algorithms for large parts of Canada and Alaska. The station density algorithm for V3 is more robust, and now finds exactly the target number of input stations for every point. This modification allows reasonable behavior of the V3 algorithms across the full range of station density, and in regions with sharp gradients in station density.
2. A lower threshold for nodata values in each input variable; tmin, tmax, and prcp. Changed from 60 days in V2 to 180 days in V3.
3. The algorithm used to fill missing days in the air temperature station records was modified to fix a problem that occurred when many nearby stations had missing data for the same day or days. The new algorithm now extends its search for good data until a minimum number of non-missing station-days are obtained.
4. A bug was fixed in the routine to fill missing days of precipitation data. Under very rare circumstances this bug could produce low biased precipitation values for the filled days.