Documentation Revision Date: 2024-06-17
Dataset Version: 4
Summary
Daymet V4 daily gridded data are available for download from the ORNL DAAC through website search and order tools. In addition, the ORNL DAAC hosts a separate Daymet Project website which provides customized tools for accessing the data. The V4 data supersede all V3 products. The Daymet algorithms and data processing implemented for V4 are described in detail in the related publication Thornton et al., 2021.
Files are available in netCDF format for three separate spatial areas: continental North America (including Canada, the United States, and Mexico), Hawaii, and Puerto Rico.
There are a total of 1,092 files in netCDF file format. One file by year and spatial region for each of the seven Daymet parameters.
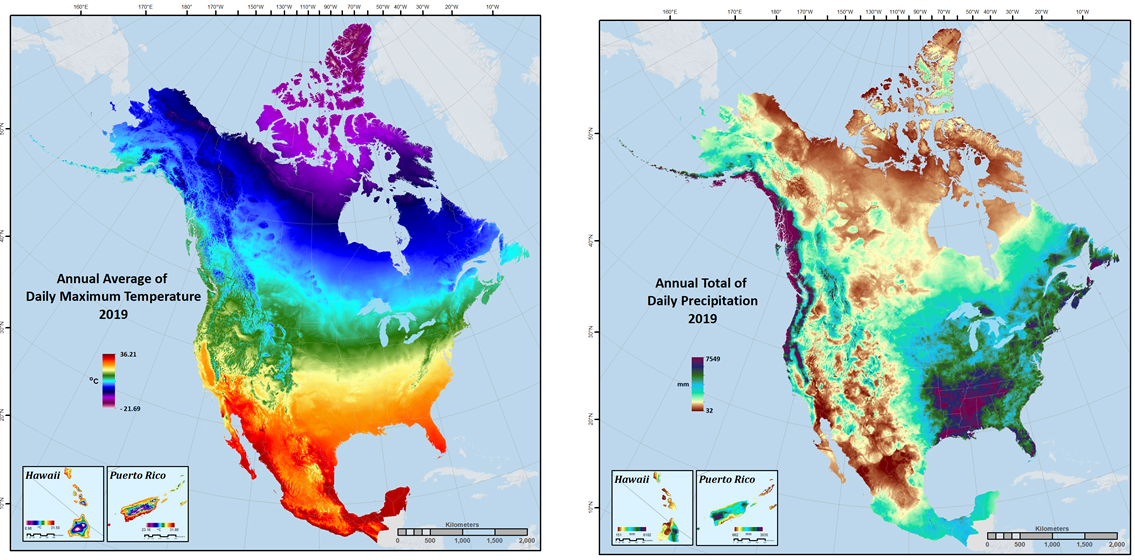
Figure 1. Annual climatologies of 2019 maximum temperature and precipitation derived from Daymet V4 daily data.
Citation
Thornton, M.M., R. Shrestha, Y. Wei, P.E. Thornton, and S-C. Kao. 2020. Daymet: Daily Surface Weather Data on a 1-km Grid for North America, Version 4. ORNL DAAC, Oak Ridge, Tennessee, USA. https://doi.org/10.3334/ORNLDAAC/1840
Table of Contents
- Dataset Overview
- Data Characteristics
- Application and Derivation
- Quality Assessment
- Data Acquisition, Materials, and Methods
- Data Access
- References
- Dataset Revisions
Dataset Overview
This dataset provides Daymet Version 4 data as gridded estimates of daily weather parameters for North America, Hawaii, and Puerto Rico. Daymet variables include the following parameters: minimum temperature, maximum temperature, precipitation, shortwave radiation, vapor pressure, snow water equivalent, and day length. The dataset covers the period from January 1, 1980, to December 31 (or December 30 in leap years) of the most recent full calendar year for the Continental North America and Hawaii spatial regions. Data for Puerto Rico is available starting in 1950. Each subsequent year is processed individually at the close of a calendar year. Daymet variables are provided as individual files, by variable and year, at a 1 km x 1 km spatial resolution and a daily temporal resolution. Areas of Hawaii and Puerto Rico are available as files separate from the continental North America. Data are in a North America Lambert Conformal Conic projection and are distributed in a standardized Climate and Forecast (CF)-compliant netCDF file format.
Daymet V4 daily gridded data are available for download from the ORNL DAAC through website search and order tools. In addition, the ORNL DAAC hosts a separate Daymet Project website which provides customized tools for accessing the data. The V4 data supersede all V3 products. The Daymet algorithms and data processing implemented for V4 are described in detail in the related publication Thornton et al. (2021).
Files are available in netCDF format for three separate spatial areas: continental North America (including Canada, the United States, and Mexico), Hawaii, and Puerto Rico.
Project: Daymet
Daymet provides long-term, continuous, gridded estimates of daily weather and climatology variables by interpolating and extrapolating ground-based observations through statistical modeling techniques. The Daymet data products provide driver data for biogeochemical terrestrial modeling and have myriad applications in many Earth science, natural resource, biodiversity, and agricultural research areas. Daymet weather variables include daily minimum and maximum temperature, precipitation, vapor pressure, shortwave radiation, snow water equivalent, and day length produced on a 1 km x 1 km gridded surface over continental North America and Hawaii from 1980 and over Puerto Rico from 1950 through the end of the most recent full calendar year.
Daymet is a research product of the Environmental Sciences Division at Oak Ridge National Laboratory, Oak Ridge, TN. Daymet algorithm and processing development is also supported by the Office of Biological and Environmental Research within the U.S. Department of Energy's Office of Science. Daymet distribution is supported by NASA through the Earth Science Data and Information System (ESDIS) and the Terrestrial Ecology Program.
Related Publication
Thornton, Peter E., Rupesh Shrestha, Michele Thornton, Shih-Chieh Kao, Yaxing Wei, and Bruce E. Wilson. 2021. “Gridded Daily Weather Data for North America with Comprehensive Uncertainty Quantification.” Scientific Data 8 (1). https://doi.org/10.1038/s41597-021-00973-0.
Related Datasets
Thornton, M.M., R. Shrestha, Y. Wei, P.E. Thornton, and S. Kao. 2020. Daymet: Annual Climate Summaries on a 1-km Grid for North America, Version 4. ORNL DAAC, Oak Ridge, Tennessee, USA. https://doi.org/10.3334/ORNLDAAC/1852
Thornton, M.M., R. Shrestha, Y. Wei, P.E. Thornton, and S. Kao. 2020.Daymet: Monthly Climate Summaries on a 1-km Grid for North America, Version 4. ORNL DAAC, Oak Ridge, Tennessee, USA. https://doi.org/10.3334/ORNLDAAC/1855
Thornton, M.M., Y. Wei, P.E. Thornton, R. Shrestha, and S. Kao. 2020.Daymet: Station-Level Inputs and Cross-Validation Result for North America, Version 4. ORNL DAAC, Oak Ridge, Tennessee, USA. https://doi.org/10.3334/ORNLDAAC/1850
Acknowledgments
The continued development of the Daymet algorithm and processing is supported by the Energy Exascale Earth System Model (E3SM) project, funded by the U.S. Department of Energy, Office of Science, Office of Biological and Environmental Research.
Puerto Rico data for Daymet V4 is available for an extended temporal period starting in 1950. Support was provided by the DOE NGEE Tropics Phase 2 funding to extend the temporal period.
Data Characteristics
Spatial Coverage: Continental North America (Mexico, United States, Canada), Hawaii, and Puerto Rico
Spatial Resolution: 1 km grid
Temporal Coverage
Continental North America (Mexico, United States, Canada) and Hawaii: 1980–2021
Puerto Rico: 1950–2021
Temporal Resolution: Daily
Study Areas (All latitude and longitude given in decimal degrees)
| Site | Westernmost Longitude | Easternmost Longitude | Northernmost Latitude | Southernmost Latitude |
|---|---|---|---|---|
| Continental North America | -178.1333 | -53.0567 | 82.9143 | 14.0749 |
| Puerto Rico | -67.9927 | -64.1196 | 19.9382 | 16.8444 |
| Hawaii | -160.3056 | -154.772 | 23.5186 | 17.9539 |
Data File Information
Filename format: daymet_v4_daily_<region>_<pppp>_<yyyy>.nc, where
<region> is either 'na' (for continental North America), 'hi' (for hawaii), or 'pr' (for Puerto Rico),
<pppp> is the respective parameter abbreviation (dayl, prcp, srad, swe, tmax, tmin, and vp), and
<yyyy> is year (1950 through 2021).
Example filename: daymet_v4_daily_na_prcp_2014.nc
Table 1. Parameters, abbreviations, units, and descriptions.
| Parameter | Abbr | Units | Description |
|---|---|---|---|
| Day length | dayl | s/day | Duration of the daylight period in seconds per day. This calculation is based on the period of the day during which the sun is above a hypothetical flat horizon |
| Precipitation | prcp | mm | Daily total precipitation in millimeters. Sum of all forms of precipitation converted to a water-equivalent depth. |
| Shortwave radiation | srad | W/m2 | Incident shortwave radiation flux density in watts per square meter, taken as an average over the daylight period of the day. Note: Daily total radiation (MJ/m2/day) can be calculated as follows: ((srad (W/m2) * dayl (s/day)) / l,000,000) |
| Snow water equivalent | swe | kg/m2 | Snow water equivalent in kilograms per square meter. The amount of water contained within the snowpack. |
| Maximum air temperature | tmax | degrees C | Daily maximum 2 m air temperature in degrees Celsius. |
| Minimum air temperature | tmin | degrees C | Daily minimum 2 m air temperature in degrees Celsius. |
| Water vapor pressure | vp | Pa | Water vapor pressure in pascals. Daily average partial pressure of water vapor. |
Coordinate Reference System
Projection System: Lambert Conformal Conic
Parameters
Projection units: meters
Datum (spheroid): WGS_84
1st standard parallel: 25 deg N
2nd standard parallel: 60 deg N
Central meridian: -100 deg (W)
Latitude of origin: 42.5 deg N
False easting: 0
False northing: 0
PROJ.4: +proj=lcc +lat_1=25 +lat_2=60 +lat_0=42.5 +lon_0=-100 +x_0=0 +y_0=0 +ellps=WGS84 +units=m +no_defs
The Daymet Calendar
The Daymet calendar is based on a standard calendar year. All Daymet years, including leap years, have 1–365 days. For leap years, the Daymet data include leap day (February 29) and December 31 is discarded from leap years to maintain a 365-day year.
Version Information
The data are stored and distributed as individual CF-compliant netCDF files for each parameter. The most current Daymet data are being delivered to the user in both Daymet software and Daymet data versions. Version information is recorded in the header file of each netCDF file in the Global Attribute fields: Version_software and Version_data. All Daymet data are provisional and subject to revision.
Application and Derivation
The Daymet data have broad applications over a wide variety of research fields including hydrology, terrestrial vegetation growth models, carbon cycle science, and regional to large scale climate change analysis. Figure 2 shows an example of a regional view of an extreme precipitation event that took place in August of 2017. Four consecutive days of daily total precipitation are shown when Hurricane Harvey made landfall in Texas and Louisiana. Measurements of near-surface meteorological conditions are made at many locations, but researchers are often faced with having to perform ecosystem process simulations in areas where no meteorological measurements have been taken. The continuous gridded surfaces of the Daymet dataset were developed to overcome these limitations.
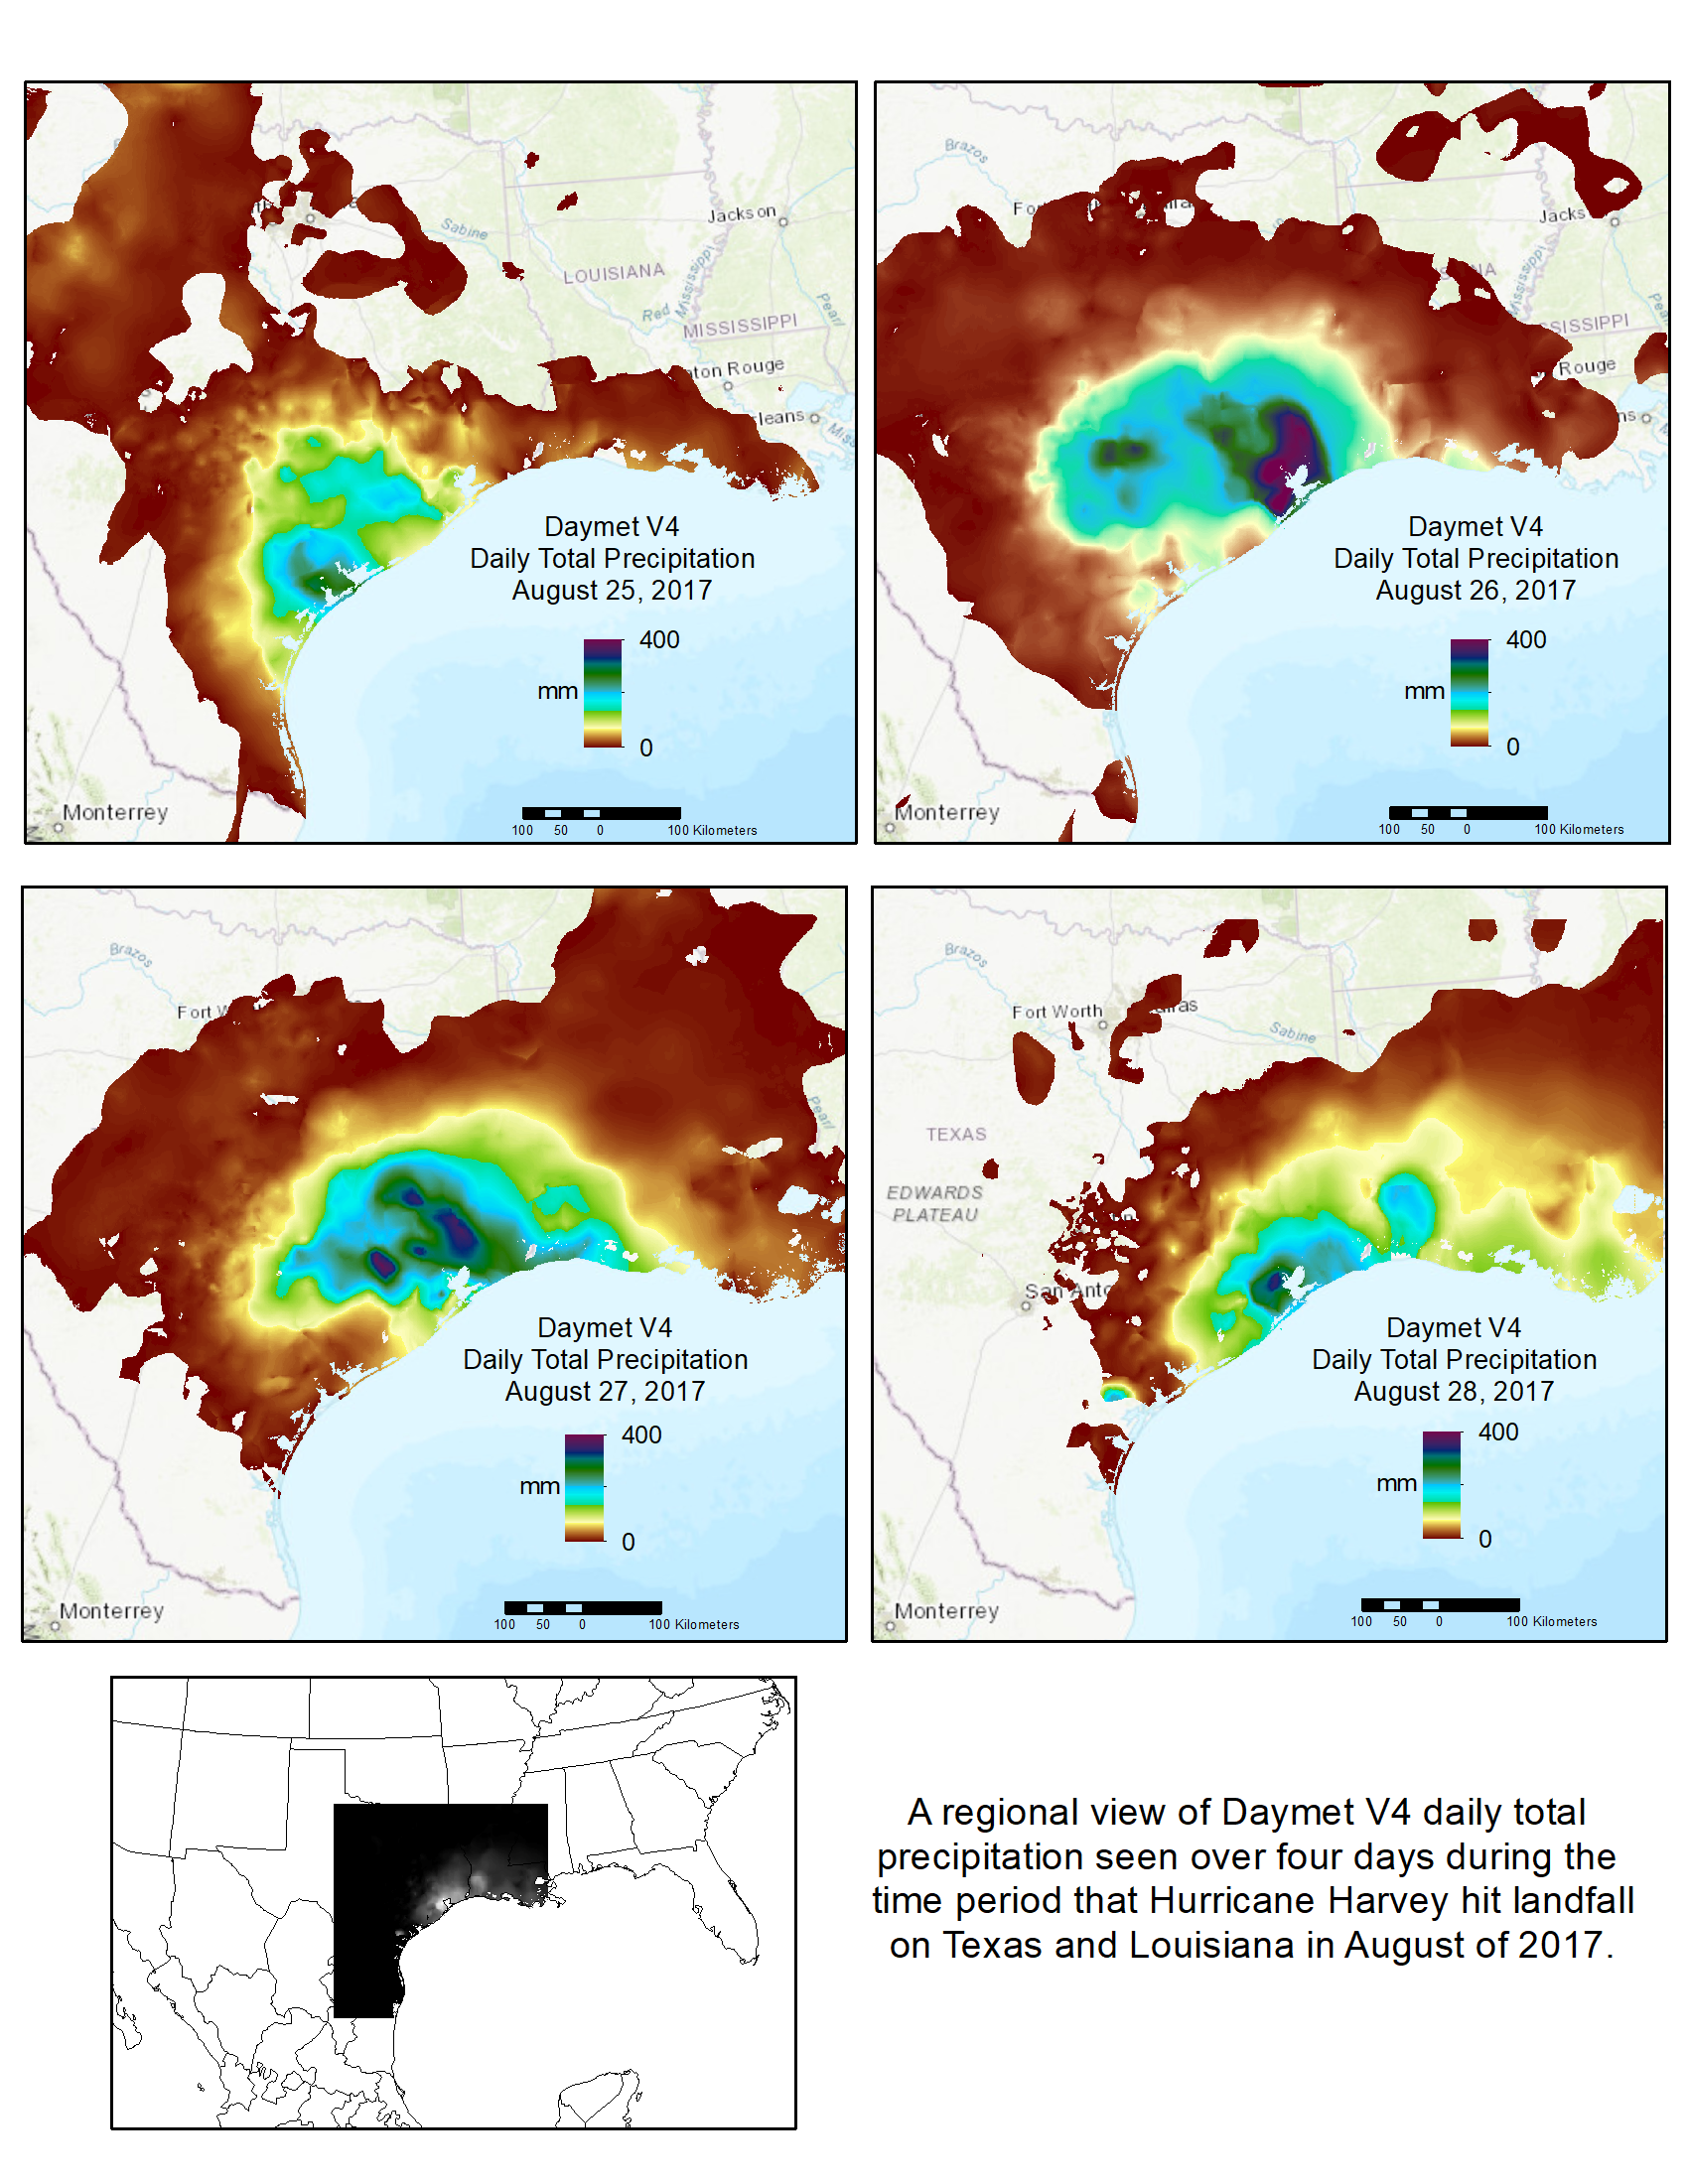
Figure 2. A regional view of Daymet V4 daily total precipitation seen over four days during the time period that Hurricane Harvey hit landfall on Texas and Louisiana in August of 2017.
Quality Assessment
Within the Daymet algorithm, the Daymet cross-validation analyses were used to test the sensitivity of Daymet methods to the variation of parameters and to estimate the prediction errors associated with the final selected parameters. The general cross-validation protocol is to withhold one observation at a time from a sample, generate a prediction error for the withheld case by comparison with observed values within the sample, and repeat over all observations in the sample to generate an average prediction error. Interest is in both the absolute value and the sign of prediction errors generated in this manner.
Data Acquisition, Materials, and Methods
All versions of the Daymet algorithm, including this Version 4, use as its core input daily observations of minimum temperature, maximum temperature, and precipitation from a network of ground-based weather stations. The surface weather input observations for processing Daymet were obtained from the NOAA National Centers for Environmental Information's Global Historical Climatology Network (GHCN)-Daily data set (Menne et al., 2012). Three separate input station files were generated for the continental North America, Puerto Rico, and Hawaii study areas and these three spatially distinct areas were applied separately through the Daymet algorithm.
GHCN-Daily Version Download Dates:
- Daymet V4 for years 1980 - 2019 (or 1950 - 2019 (Puerto Rico only)) used GHCN Daily version 3.27 downloaded on February 5, 2020.
- Daymet V4 for year 2020 used GHCN Daily version 3.28 downloaded on February 14, 2021.
- Daymet V4 for year 2021 used GHCN Daily version 3.28 downloaded on February 16, 2022.
The Daymet approach to estimating daily surface weather parameters at locations lacking instrumentation is based on a combination of interpolation and extrapolation, using inputs from multiple instrumented sites and weights for each site that reflect the spatial and temporal relationships of the estimation location to the instrumental observations. The approximate number of instrumental observations to use for each estimation is defined as a parameter for each of the primary Daymet variables. As part of a series of algorithm modifications intended to improve robustness in regions of very low station density, the Daymet V4 algorithm drops the iterative station density calculation and instead defines a search radius for each estimation location which is sized to capture exactly the average number of input stations, based on pre-calculated arrays of station distances. Given the pre-processed input station observations and the pre-calculated station lists and interpolation weights for each location in the estimation grid, two separate workflows are used to produce the primary Daymet output variables: one for the daily temperature variables (Tmax and Tmin) and another for the daily precipitation variable (Prcp).
The Daymet Version 4 methodology and dataset is described in Thornton, et al., 2021.
In addition to daily maximum and minimum temperature and daily total precipitation, the Daymet data record includes estimates of other important surface weather quantities that are not routinely observed, or are available as observations from only a small fraction of the temperature and precipitation observing stations. These secondary output variables are daily total shortwave radiation (Srad), daily average water vapor pressure (VP), duration of the daylight period (daylength), and a simple estimate of accumulated snowpack, measured as snowpack water equivalent (SWE). The daylength estimate is based on geographic location and time of year. Estimates for the other secondary variables (Srad, VP, and SWE) are derived from the primary temperature and precipitation variables on the basis of theory and empirical relationships, as further described in Thornton et al. 2021.
Data Access
These data are available through the Oak Ridge National Laboratory (ORNL) Distributed Active Archive Center (DAAC).
Daymet: Daily Surface Weather Data on a 1-km Grid for North America, Version 4
Contact for Data Center Access Information:
- E-mail: uso@daac.ornl.gov
- Telephone: +1 (865) 241-3952
References
Menne, M.J., I. Durre, B. Korzeniewski, S. McNeal, K. Thomas, X. Yin, S. Anthony, R. Ray, R.S. Vose, B.E. Gleason, and T.G. Houston 2012. Global Historical Climatology Network - Daily (GHCN-Daily), Version 3. NOAA National Climatic Data Center. Version 3.27-upd-2020020523. https://doi.org/10.7289/V5D21VHZ
Menne, M.J., I. Durre, R.S. Vose, B.E. Gleason, and T.G. Houston. 2012. An Overview of the Global Historical Climatology Network-Daily Database. Journal of Atmospheric and Oceanic Technology, 29: 897-910. http://doi.org/10.7289/V5D21VHZ
Thornton, M.M., R. Shrestha, Y. Wei, P.E. Thornton, and S. Kao. 2020. Daymet: Annual Climate Summaries on a 1-km Grid for North America, Version 4. ORNL DAAC, Oak Ridge, Tennessee, USA. https://doi.org/10.3334/ORNLDAAC/1852
Thornton, M.M., R. Shrestha, Y. Wei, P.E. Thornton, and S. Kao. 2020.Daymet: Monthly Climate Summaries on a 1-km Grid for North America, Version 4. ORNL DAAC, Oak Ridge, Tennessee, USA. https://doi.org/10.3334/ORNLDAAC/1855
Thornton, M.M., Y. Wei, P.E. Thornton, R. Shrestha, and S. Kao. 2020.Daymet: Station-Level Inputs and Cross-Validation Result for North America, Version 4. ORNL DAAC, Oak Ridge, Tennessee, USA. https://doi.org/10.3334/ORNLDAAC/1850
Thornton, Peter E., Rupesh Shrestha, Michele Thornton, Shih-Chieh Kao, Yaxing Wei, and Bruce E. Wilson. 2021. “Gridded Daily Weather Data for North America with Comprehensive Uncertainty Quantification.” Scientific Data 8 (1). https://doi.org/10.1038/s41597-021-00973-0.
Dataset Revisions
Note: The ORNL DAAC revised its methods for versioning datasets to be more consistent with data versioning practices at the NASA Earth Science Data and Information System (ESDIS) and the general Earth Science data community. With the revised versioning strategy, the dataset version number (including both major and minor version numbers) remain unchanged when a release only appends new data and existing data are not changed. At the time of publication of 2023 Daymet data, the version numbers of Daymet datasets, including the Version 4 and prior versions are updated as shown in the revision tables below.
ORNL DAAC Version Record for Version 4
|
ORNL DAAC Release Date |
Daymet Product Version |
Description |
|---|---|---|
| March 9, 2022 | Version 4 | This release added daily gridded mosaics for 2021 for each Daymet Version 4 variable. |
| April 8, 2021 | This release added daily gridded mosaics for 2020 for each Daymet Version 4 variable. | |
| December 15, 2020 |
This release added daily gridded mosaics for Continental North America (Mexico, United States, Canada) and Hawaii for 1980–2019 and for Puerto Rico for 1950 - 2019 for each Daymet Version 4 variable. |
ORNL DAAC Version Record for Version 3
|
ORNL DAAC Release Date |
Daymet Product Version |
Description |
|---|---|---|
| March 17, 2020 | Version 3 | This release added daily gridded mosaics for 2019 for each Daymet Version 3 variable. |
| April 3, 2019 | This release added daily gridded mosaics for 2018 for each Daymet Version 3 variable. | |
| April 19, 2018 | This release added daily gridded mosaics for 2017 for each Daymet Version 3 variable. | |
| April 20, 2017 | This release added daily gridded mosaics for 2016 for each Daymet Version 3 variable. | |
| July 15, 2016 | This release provided new daily gridded mosaics for all meteorological variables and all years (1980-2015) based on improvements to the Daymet algorithm and expanded geographic coverage at high latitude (see below). The Daymet website was also updated. Daymet V2 mosaics are now available only upon request. |
ORNL DAAC Version Record for Version 2
|
ORNL DAAC Release Date |
Daymet Product Version |
Description |
|---|---|---|
| March 7, 2016 | Version 2 | This release added daily gridded mosaics for 2015 for each Daymet variable. |
| May 18, 2015 | This release added daily gridded mosaics for 2014 for each Daymet variable. | |
| June 13, 2014 | This release added daily gridded mosaics for 2013 for each Daymet variable. | |
| May 15, 2014 | This release provided new daily gridded mosaics for meteorological parameters and updated Daymet Website. All existing Daymet products and tools continue to be available. | |
|
May 10, 2012 |
NACP Modeling and Synthesis Thematic Data Center (MAST-DC) at ORNL released new daily gridded meteorological parameter data for 2-degree Daymet tiles through the Daymet Website. |