Documentation Revision Date: 2024-06-24
Dataset Version: 1
Summary
There are 17,036 files with this dataset: 7 files in comma separated values (CSV) format, 2760 ENVI binary data files with 2760 ENVI headers, 10,942 quicklook images in TIFF format, 12 calibration plots saved as TIFF images, 552 shapefiles saved in Zip archives, and 3 files in Keyhole Markup Language (KML). In addition, there are four companion files in Portable Document Format (PDF).
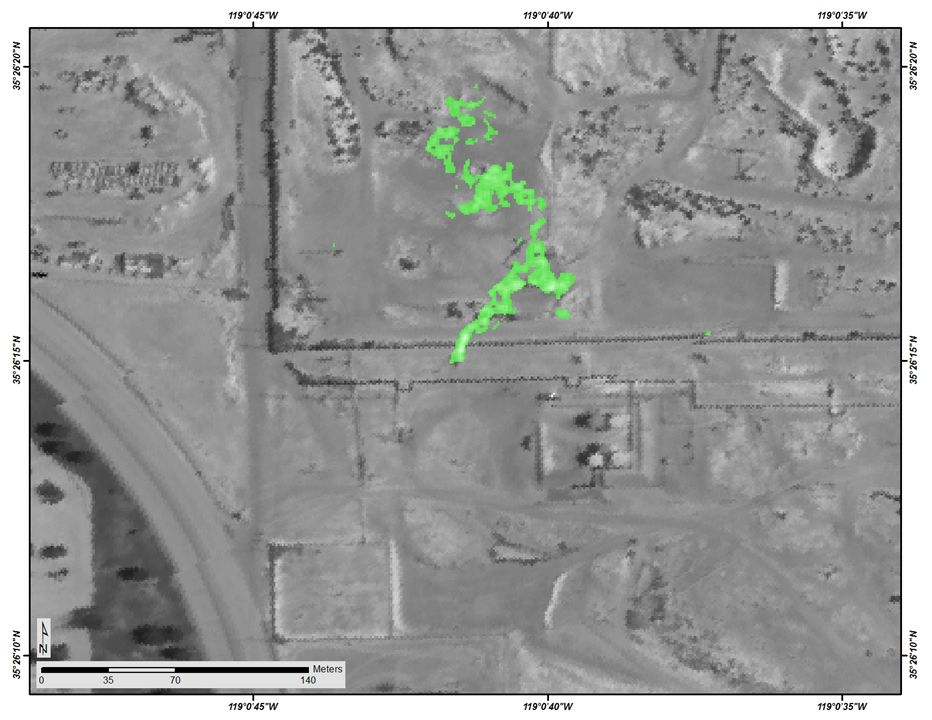
Figure 1. Methane detection signal (green) of pump jack leak at the Kern River oil field superimposed on the thermal radiance scene image. Image sources: 060_140724_165004_KE_150_6k_Kern02_Whisk55_L2S.dat, 060_140724_165004_KE_150_6k_Kern02_Whisk55_ACE.dat.
Citation
Tratt, D.M., K.N. Buckland, and E.R. Keim. 2024. Longwave-infrared spectral imagery in support of COMEX, 2014. ORNL DAAC, Oak Ridge, Tennessee, USA. https://doi.org/10.3334/ORNLDAAC/2331
Table of Contents
- Dataset Overview
- Data Characteristics
- Application and Derivation
- Quality Assessment
- Data Acquisition, Materials, and Methods
- Data Access
- References
Dataset Overview
This dataset provides calibrated at-sensor radiance, retrieved surface brightness temperature, and adaptive coherence estimator (ACE) detection imagery of methane, and a limited number of auxiliary gases collected with the Aerospace Corporation's Mako airborne longwave-IR hyperspectral imager flown during July 22-25, 2014 over a variety of methane generating sites in southern and central California (CA), U.S. These sites included animal husbandry and oil/gas production facilities. Specific study areas included the Coal Oil Point marine seep field off of Goleta, CA, the Kern River oil field complex at Bakersfield, CA, and the extensive stockyards in Chino, CA. The Kern River complex was acquired at 1-m ground sampling distance (GSD), while the other study areas were at 2-m GSD. Levels 1-3 data are provided according to the processing prescriptions described in Buckland et al. (2017). The data were collected in support of the NASA/ESA COMEX (CO2 and Methane EXperiment) campaign.
The dataset provides data logs, calibration diagnostic files, imagery footprints as shapefiles and in KML; Level 1 thermal radiance quicklook images and georegistration data; Level 2 calibrated at-sensor spectral radiance cubes and sensor performance; Level 3 surface brightness temperature, adaptive coherence estimator (ACE) gas detections for specific gas species.
Project: COMEX
The CO2 and MEthane eXperiment (COMEX) campaign, funded bilaterally by NASA and ESA, supported the mission definition of CarbonSat and HyspIRI by providing representative airborne remote sensing data as well as ground-based and airborne in situ data. The objectives were addressed by a unique combination of VIS/NIR/SWIR hyperspectral remote sensing airborne instrumentation (AVIRIS-C, AVIRIS-NG), TIR hyperspectral remote sensing airborne instrumentation (Mako), NIR/SWIR spectroscopic remote sensing airborne instrumentation (MAMAP) as well as in situ airborne (Picarro GHG sensor/analyzer and CIRPAS atmospheric measurements suite) and ground based (AMOG - AutoMObile greenhouse Gas surveyor) measurements for validation and interpretation support. COMEX demonstrated that methane emissions associated with fossil fuel production activities in the Los Angeles area were of sufficient magnitude and size for space-based observations. COMEX was executed between May and September 2014 around the Southern California, USA, area.
Related Publications
Krautwurst, S., K. Gerilowski, T. Krings, J. Borchard, and H. Bovensmann. 2016. COMEX - Final Report. University of Bremen; Germany. https://earth.esa.int/eogateway/documents/20142/37627/COMEX-Final-Report.pdf. https://doi.org/2060/20190025386
Leifer, I., C. Melton, D.M. Tratt, K.N. Buckland, C.S. Chang, J. Frash, J.L. Hall, A. Kuze, B. Leen, L. Clarisse, T. Lundquist, M. Van Damme, S. Vigil, S. Whitburn, and L. Yurganov. 2018. Validation of mobile in situ measurements of dairy husbandry emissions by fusion of airborne/surface remote sensing with seasonal context from the Chino Dairy Complex. Environmental Pollution 242:2111–2134. https://doi.org/10.1016/j.envpol.2018.03.078
Leifer, I., and C. Melton. 2021. Using mobile surface in situ and remote sensing and airborne remote sensing to derive emissions from a producing central California oil field in complex terrain. Atmospheric Pollution Research 12:101145. https://doi.org/10.1016/j.apr.2021.101145
Leifer, I., C. Melton, D.M. Tratt, and K.N. Buckland. 2022. Airborne trace gas remote sensing and surface mobile in situ: a novel tool for the study of structural geological controls from a producing oil field. SPE Production & Operations 37:654–663. https://doi.org/10.2118/209799-PA
Acknowledgments
The Aerospace Corporation’s Independent Research and Development program funded acquisition, processing, and interpretation of the subject data.
Data Characteristics
Spatial Coverage: Three sites in California: the Coal Oil Point marine seep field off of Goleta, CA, the Kern River oil field complex (Bakersfield, CA), and the extensive stockyards in Chino (S. CA.).
Spatial Resolution: Coal Oil Point: 2-m GSD, Kern River complex: 1-m GSD, Chino stockyards: 2-m GSD.
Temporal Coverage:
- Coal Oil Point (Seep): 2014-07-22 22:36:42-22:40:30 UTC
- Kern River complex (Kern): 2014-07-24 16:43:45-16:55:25 UTC
- Chino stockyards (Chino): 2014-07-25 18:20:31-18:54:13 UTC. Local time = UTC - 7 h.
Site Boundaries: Latitude and longitude are given in decimal degrees.
| Site | Westernmost Longitude | Easternmost Longitude | Northernmost Latitude | Southernmost Latitude |
|---|---|---|---|---|
| Three sites in California | -119.95 | -117.45 | 35.49 | 33.89 |
Data File Information
There are 17,036 files with this dataset: 7 files in comma separated values (CSV) format, 2760 ENVI binary data files with 2760 ENVI headers, 10,942 quicklook images in TIFF format, 12 calibration plots saved as TIFF images, 552 shapefiles saved in Zip archives, and 3 files in Keyhole Markup Language (KML). In addition, there are four companion files in Portable Document Format (PDF).
The dataset provides data logs, calibration diagnostic files, imagery footprints as shapefiles and KML; Level 1 georegistration data and thermal radiance quicklook images; Level 2 calibrated at-sensor spectral radiance cubes and sensor performance; Level 3 surface brightness temperature, adaptive coherence estimator (ACE) gas detections for specific gas species.
There are also four companion files in .pdf format described at the end of this section. The companion files must be downloaded separately from the data files.
File Descriptions
The file naming conventions include these components:
- S = shot number 001-999
- X = YYMMDD ("140722", "140724", or "140725"); multiple flights on the same day are designated with an "a" or "b"
- Y = HHMMSS
- N = Target name
- Z = sssss (Julian second)
- F = "ACE", SMF
- K = Signature name
Ancillary Data and Files
Comprehensive data log for each whisk (data cube) with associated plots for instrument health assessment.
There is a single file named COMEX_Radiant_Gray_Metadata.csv.
Imagery footprints compatible with Google Earth. There are three files named Footprints_MAKO_YYMMDD.kml.
Example File name: Footprints_MAKO_140724a.kml
Calibration and Metadata Files
Flight log metadata. There are three files named Flightlog_mako_YYMMDD.csv.
These files hold the same information as in COMEX_Radiant_Gray_Metadata.csv but separated by the three dates.
Example file name: Flightlog_mako_140725.csv
Calibration diagnostics for assessing sensor performance. There are three files named caldiag_mako_YYMMDD.csv.
Example file name: caldiag_mako_140725.csv
Calibration plots (gain, NESR) used to assess sensor performance. There are 12 files named calset_X_Y_l_Z.tiff.
There are six files for the date 140725, four files for 140724, and two files for the date 140722.
Example file name: calset_140725_184625_l_68090.tiff
L1 Files
Imagery footprints of single whisk data cubes are provided as shapefiles stored in zip archives, named S_X_Y_N.zip.
Example file name: 102_140724_165004_KE_150_6k_Kern02_Whisk97.zip
The footprint of each whisk datacube is also included in the ancillary KML footprint files.
Pixel center points for each flightline are provided in ENVI format. For each flightline, there is a binary data file (.dat) and associated ENVI header file (.hdr) holding metadata in text format.
The file naming convention is S_X_Y_N_geo.<ext>, where <ext> is "dat" or "hdr".
The ENVI files have two bands:
- Band 1: longitude of pixel centers
- Band 2: latitude of pixel centers
Example file names: 109_140725_183203_CS_270_12k_Chino02_Whisk104_geo.dat (binary data)
and 109_140725_183203_CS_270_12k_Chino02_Whisk104_geo.hdr (associated header file)
Flightline footprint quicklook images are named S_X_Y_N_raw.tif. These images are not georeferenced. There are 552 footprint quicklook files.
Example file name: 112_140725_183203_CS_270_12k_Chino02_Whisk107_raw.tif.
L2 Files
At-sensor radiance in microflicks (µW cm-2 sr-1 µm-1) is provided in ENVI format.
Files are named S_X_Y_N_L2S.<ext>.
The ENVIs hold data for 128 channels (bands); wavelength of each channel is listed in the header file.
Example file names: 099_140725_183203_CS_270_12k_Chino02_Whisk94_L2S.dat (binary data)
and 099_140725_183203_CS_270_12k_Chino02_Whisk94_L2S.hdr (associated header file).
Sensor performance data for each whisk (data cube) is provided in ENVI format.
Files are named S_X_Y_N_aux.<ext>
Band contents are described in the header file. Noise-equivalent spectral radiance (NESR) is given in microflicks.
Example file names: 099_140725_183203_CS_270_12k_Chino02_Whisk94_aux.dat (binary data)
and 099_140725_183203_CS_270_12k_Chino02_Whisk94_aux.hdr (associated header file).
L3 Files
Surface brightness temperature in degrees C is provided in ENVI format.
Files are named S_X_Y_N_BTEMP.dat.
Example file names: 105_140725_183203_CS_270_12k_Chino02_Whisk100_BTEMP.dat (binary data)
and 105_140725_183203_CS_270_12k_Chino02_Whisk100_BTEMP.hdr (associated header file).
Adaptive coherence estimator (ACE) signal strength is provided in ENVI format.
Files are named S_X_Y_N_ACE.<ext>.
ACE signal strength; -1 ≤ ACE ≤ +1 (dimensionless) for each molecule. Negative ACE values are in absorption; positive in emission.
- Band 1: Ammonia
- Band 2: Carbon Dioxide
- Band 3: Methane
- Band 4: Nitrogen Dioxide
- Band 5: Nitrous Oxide
Example file names: 066_140725_184625_CS_090_12k_Chino03_Whisk61_ACE.dat (binary data)
and 066_140725_184625_CS_090_12k_Chino03_Whisk61_ACE.hdr (associated header file).
Quicklook images of molecule-specific ACE signal strength are named S_X_Y_N_<molecule>_raw.tif.
These quicklooks are not georeferenced. There are 10,390 molecule-specific quicklook files.
Example file name: 066_140725_184625_CS_090_12k_Chino03_Whisk61_ACE_Methane_raw.tif
Table 1. Measured molecules in the ACE files (S_X_Y_N_ACE.<ext>) by target study site.
| Site | Measured Molecules |
|---|---|
| Seep | Methane, Water, Water (aerosol) |
| Kern | 1,1,1-Trichloroethane, 1,2,4-Trimethylbenzene, 1,4-Dichlorobenzene,1-Propanol, Acetone, Ammonia, Benzene, Butane, Carbon dioxide, Carbon tetrachloride, Cyclohexane, Dichloromethane, Ethane, Ethanol, Ethene, Ethyl acetate, Ethyl benzene, Formaldehyde, Heptane, Hexane, Hydrogen Peroxide, Isoprene, Isopropanol, Methane, Methanol, Methyl ethyl ketone, Methyl isobutyl ketone, Methyl methacrylate, Naphthalene, Nitrogen dioxide, Pentane, Propane, Tetrachloroethylene, Tetrahydrofuran, Toluene, Trichloroethylene, Water, Water (aerosol), a-Pinene, d-Limonene, m-Xylene ,o-Xylene, p-Xylene |
| Chino | Ammonia,Carbon dioxide,Methane,Nitrogen dioxide,Nitrous oxide |
Variables in the flightlog files
Table 2. Flight metadata in the file COMEX_Radiant_Gray_Metadata.csv and the three flight log files Flightlog_mako_YYMMDD.csv
| Column Header | Units | Description |
|---|---|---|
| Flight | - | Flight number |
| shot | - | Shot number |
| session | - | Session |
| Target_X_time | GMT | Date and time (GMT) |
| Target_Name | - | Target site name |
| Platform_HAE | m | |
| Platform_AGL | kft | Altitude above ground level |
| Slant_Range | km | |
| Horizontal_Standoff | km | |
| COG_0_equals_N_T_plus_equals_E | degrees | Course over ground |
| W_Mirror | degrees s-1 | |
| Frames | 1 | |
| Coadds | 1 | |
| PreTrigger_Frame | 1 | |
| Target_Lat | degrees north | Latitude of target site |
| Target_Lon | degrees east | Longitude of target site |
| Target_HAE | m | |
| Median_Gain | µf | Radiance gain in microflicks (µW cm-2 sr-1 µm-1) |
| Median_Offset | µf | Radiance offset in microflicks |
| Median_Cold_NESR | µf | Noise equivalent spectral radiance in microflicks |
| Median_Hot_NESR | µf | Noise equivalent spectral radiance in microflicks |
| Bad_Pixels | 1 | |
| Frame_Rate | Hz | Number of measured pixels per frame |
| IFOV | μrad | Instantaneous Field-Of-View; the angle subtended by a pixel in micro radians |
| Pointing_Offset_Estimate | m | |
| Processing_Time_sec | s | |
| Processing_Time_req | s |
Table 3. Data provided in the three diagnostic files caldiag_mako_X.csv
| Column | Units |
|---|---|
| Session | - |
| AvgTime | sec |
| QFlagSet | 1 |
| nCalFiles | 1 |
| ShotNum | 1 |
| ShotQFlag | 1 |
| Median_Gain | µf |
| Median_Offset | µf |
| Median_Cold_NESR | µf |
| Median_Hot_NESR | µf |
| Temp_X (6 columns where X is 1-6) | degrees C |
Companion Files
COMEX_LongwaveInfrared_Imagery_Header_File_Descriptions.pdf: Provides a description of the fields in the header (.hdr) files.
COMEX_LongwaveInfrared_Imagery_Instrument_Calibration_report.pdf: Instrument calibration report.
COMEX_LongwaveInfrared_Imagery_Instrument_Problem_Report.pdf: Instrument problem report regarding the georeferencing of data from Chino Stockyards site session 140725_181857
HyperSEAL_DataDelivery_v1.pdf: Provides data flow diagrams from L0 to L3 and ancillary files.
Application and Derivation
Airborne remote sensing data were used to image large-scale spatial distribution of methane plumes at the study sites. These data were used to assess the impact that topography and infrastructure have on the representativeness of associated in-situ measurements.
Quality Assessment
Absolute spectral radiances are computed with reference to hot and cold NIST-traceable blackbody sources that are viewed immediately before and after acquisition of each flight line.
Data Acquisition, Materials, and Methods
Calibrated at-sensor radiance, retrieved surface brightness temperature, and adaptive coherence estimator (ACE) detection imagery of methane and a limited number of auxiliary gases were collected with the Aerospace Corporation's Mako airborne longwave-IR hyperspectral imager flown during July 22-25, 2014 over a variety of methane generating sites in southern and central California (CA). These sites included animal husbandry and oil/gas production facilities. Specific study areas included the Coal Oil Point marine seep field off of Goleta, CA, the Kern River oil field complex at Bakersfield, CA,, and the extensive stockyards in Chino, CA. The Kern River complex was acquired at 1-m ground sampling distance (GSD), while the other study areas were at 2-m GSD. Levels 1-3 data are provided according to the processing prescriptions described in Buckland et al. (2017).
Data were acquired by airborne longwave-infrared imaging spectrometer (Mako) over the sites listed above. Processing was completed at The Aerospace Corporation's Los Angeles facility using the procedures described in Buckland et al. (2017). The imagery was intended to supplement other in-situ and remote sensing data acquired during the NASA/ESA COMEX campaign conducted in central and southern California. However, the subject data were not acquired contemporaneously with those other data sets (Krautwurst et al., 2016).
Data Access
These data are available through the Oak Ridge National Laboratory (ORNL) Distributed Active Archive Center (DAAC).
Longwave-infrared spectral imagery in support of COMEX, 2014
Contact for Data Center Access Information:
- E-mail: uso@daac.ornl.gov
- Telephone: +1 (865) 241-3952
References
Buckland, K.N., S.J. Young, E.R. Keim, B.R. Johnson, P.D. Johnson, and D.M. Tratt. 2017. Tracking and quantification of gaseous chemical plumes from anthropogenic emission sources within the Los Angeles Basin. Remote Sensing of Environment 201:275–296. https://doi.org/10.1016/j.rse.2017.09.012
Krautwurst, S., K. Gerilowski, T. Krings, J. Borchard, and H. Bovensmann. 2016. COMEX - Final Report. University of Bremen; Germany. https://earth.esa.int/eogateway/documents/20142/37627/COMEX-Final-Report.pdf. https://doi.org/2060/20190025386
Leifer, I., C. Melton, D.M. Tratt, K.N. Buckland, C.S. Chang, J. Frash, J.L. Hall, A. Kuze, B. Leen, L. Clarisse, T. Lundquist, M. Van Damme, S. Vigil, S. Whitburn, and L. Yurganov. 2018. Validation of mobile in situ measurements of dairy husbandry emissions by fusion of airborne/surface remote sensing with seasonal context from the Chino Dairy Complex. Environmental Pollution 242:2111–2134. https://doi.org/10.1016/j.envpol.2018.03.078
Leifer, I., and C. Melton. 2021. Using mobile surface in situ and remote sensing and airborne remote sensing to derive emissions from a producing central California oil field in complex terrain. Atmospheric Pollution Research 12:101145. https://doi.org/10.1016/j.apr.2021.101145
Leifer, I., C. Melton, D.M. Tratt, and K.N. Buckland. 2022. Airborne trace gas remote sensing and surface mobile in situ: a novel tool for the study of structural geological controls from a producing oil field. SPE Production & Operations 37:654–663. https://doi.org/10.2118/209799-PA